Spatially-resolved Thermal Continuum Absorption against the Supernova Remnant W49B
Abstract
We present sub-arcminute resolution imaging of the Galactic supernova remnant W49B (catalog ) at 74 MHz (25″) and 327 MHz (6″), the former being the lowest frequency at which the source has been resolved. While the 327 MHz image shows a shell-like morphology similar to that seen at higher frequencies, the 74 MHz image is considerably different, with the southwest region of the remnant almost completely attenuated. The implied 74 MHz optical depth () is much higher than the intrinsic absorption levels seen inside two other relatively young remnants, Cas A and the Crab Nebula, nor are natural variations in the relativistic electron energy spectra expected at such levels. The geometry of the absorption is also inconsistent with intrinsic absorption. We attribute the absorption to extrinsic free-free absorption by a intervening cloud of thermal electrons. Its presence has already been inferred from the low-frequency turnover in the integrated continuum spectrum and from the detection of radio recombination lines toward the remnant. Our observations confirm the basic conclusions of those measurements, and our observations have resolved the absorber into a complex of classical H II regions surrounded either partially or fully by low-density H II gas. We identify this low-density gas as an extended H II region envelope (EHE), whose statistical properties were inferred from low resolution meter- and centimeter-wavelength recombination line observations. Comparison of our radio images with H I and H2CO observations show that the intervening thermal gas is likely associated with neutral and molecular material as well. This EHE may be responsible for the enhanced radio-wave scattering seen in the general direction of the W49 (catalog ) complex.
1 Introduction
The integrated radio continuum spectra of Galactic supernova remnants (SNRs) are generally power-law from meter to centimeter wavelengths and shorter, with a continuum of spectral indices ranging from () for shell-type remnants to for plerions, with many presenting blended emission at intermediate indices. However, below 100 MHz, roughly two-thirds of SNRs show spectral turnovers indicative of thermal absorption (Dulk & Slee, 1975; Kassim, 1989, and references within). The inferred continuum optical depths and the poor correlation between the presence of a turnover and the, albeit poorly constrained, distance to a SNR are inconsistent with absorption arising in the (globally-distributed) warm ionized medium (WIM, cm-3, Kulkarni & Heiles, 1988). Instead, the absorption must arise from localized ionized regions having an enhanced density ( cm-3) but of unknown scale size and with a small (%) filling factor (Kassim, 1989). The favored interpretation has been that the absorbers represent extended H II region envelopes (EHEs), ionized gas surrounding normal H II regions, as postulated by Anantharamaiah (1986) from comparison of centimeter- and meter-wavelength radio recombination line (RRL) observations. Alternatively, the absorption could be caused by the superposition of many small, normal H II regions or planetary nebulae along the line of site. Until now, low-frequency observations have had insufficient resolution to resolve spatially the morphology of the absorption and thereby constrain the geometry and scale size of the absorber.
We distinguish between the free-free absorption responsible for low-frequency turnovers and the intrinsic thermal absorption now documented in two Galactic SNRs (Cas A (catalog ), Kassim et al. 1995; Crab Nebula (catalog ), Bietenholz et al. 1997). In these two SNRs, the free-free optical depths in their interiors are far smaller than the levels considered here, and the radio absorption can be linked to thermal material seen at other wavelengths, e.g., optical filaments in the Crab Nebula.
The supernova remnant W49B (catalog ) (G43.30.2 (catalog )) is the nonthermal component of the W49 (catalog ) complex and is approximately 12′ from the H II region W49A (catalog ). It is a relatively young ( yr, Pye et al. 1984; Smith et al. 1985), bright ( Jy at 1 GHz), and reasonably extended () shell-type SNR. As such it has been a common target for testing the predictions of shock acceleration theory against the energy spectrum of the relativistic electrons inferred from spectral index studies above 100 MHz (Moffett & Reynolds, 1994; Dyer et al., 2000). Its integrated spectrum also shows a low-frequency turnover near 100 MHz (Dulk & Slee, 1975; Kassim, 1989). Kassim (1989) fitted its spectrum with a power law, finding a spectral index above 100 MHz and a free-free 30.9 MHz optical depth of . Low resolution detection of RRLs in the direction of W49B (catalog ), unusual for a Galactic SNR, provide further strong evidence for ionized gas along the line of sight (Pankonin & Downes, 1976). Its distance is estimated to be 10 kpc based on H I absorption (Radhakrishnan et al., 1972). Though there is some dispute about whether these two sources are physically related, there is general agreement that W49A (catalog ) is behind W49B (catalog ) (e.g., Radhakrishnan et al., 1972, but see Brogan & Troland 2000).
This paper reports the first low frequency radio observations to resolve spatially the long-inferred, extrinsic thermal absorption toward a Galactic SNR. We describe the observations in §2 and present the results in §3. We discuss the implications of our observations with respect to the properties of the absorber in §4 and summarize our conclusions in §5.
2 Observations and Data Reduction
We used the VLA to observe W49B (catalog ) at 74 and 327 MHz. Table 1 summarizes various observing details.
| VLA | ||||||
|---|---|---|---|---|---|---|
| Configuration | Epoch | Beam | ||||
| (MHz) | (MHz) | (hr) | (″ ″) | (mJy beam-1) | ||
| 74 | A | 1998 February 22 | 1.4 | 5.0 | @ | 90 |
| 327 | A | 1995 August 21 | 1.6 | 5.9 | @ 71° | 0.62 |
| 327 | B | 1995 October 8 | 1.6 | 5.9 | … | … |
| 327 | B | 1994 August 7 | 3.1 | 3.4 | … | … |
| 327 | C | 1994 October 24 | 3.1 | 2.1 | … | … |
Note. — The 327 MHz observations were combined to produce a single image. We list the beam and rms noise level on that image only once.
The 74 MHz observations were conducted on 1998 February 22 with the VLA in the A configuration. We note some of the salient features of the NRL-NRAO 74 MHz system on the VLA. Signals are received by a pair of crossed dipoles mounted at the prime focus of the VLA’s 25 m diameter antennas. The signals are filtered to a 1.5 MHz bandwidth, converted to right- and left-circular polarization, and amplified. As the system temperature ( K) is dominated by the Galactic background, the receivers are uncooled. The filtered and amplified signals are then passed to the regular VLA IF chain. The VLA IF chain can handle four simultaneous IFs. Two of these are utilized by the right- and left-circularly polarized signals at 74 MHz. The system was designed so that the remaining two IFs may also carry signals at 327 MHz. In this case, the simultaneous 3 MHz bandwidth 327 MHz data were acquired in the event that dual-frequency ionospheric phase referencing (DFIPR, Kassim et al., 1993) was later required to compensate for strong ionospheric effects. Often, as was the case here, DFIPR was not required.
The 327 MHz observations occurred between 1994 and 1995 in the VLA’s A-, B-, and C-configurations (Table 1). These multi-configuration observations provided a range of spatial frequencies and ensured that larger angular scale structures in the SNR were well represented at the higher frequency. In combining the observations from the various configurations, we made no attempt to compensate for any time-dependent changes in the SNR.
Post-processing of low-frequency VLA data uses procedures similar to those
at higher frequencies, though certain details differ.111A full description of low-frequency VLA data reduction procedures is at
http://rsd-www.nrl.navy.mil/7213/lazio/tutorial/. Cygnus A (catalog ) served as the bandpass, flux density, and
initial phase calibrator. Several iterations of self-calibration were
then utilized to make the final images.
Two significant differences for the post-processing are the need to remove radio frequency interference (RFI) and the wide-field imaging requirement imposed by the large fields of view. In order to combat RFI, the data were acquired with a much higher spectral resolution than used for imaging. Excision of potential RFI is performed on a per-baseline basis for each 10 s visibility spectrum. The large fields (11° at 74 MHz and 25 at 327 MHz) and non-coplanar baselines of the VLA require full three-dimensional deconvolution to reach thermal limits. The 74 MHz data was reduced in AIPS using IMAGR, while NRAO’s Software Development Environment polyhedron algorithm dragon (Cornwell & Perley, 1992) was utilized at 327 MHz. The rms noise level in the resulting 327 MHz image, 0.62 mJy beam-1, makes this one of the most sensitive, low-frequency images ever obtained by the VLA toward the inner Galaxy.
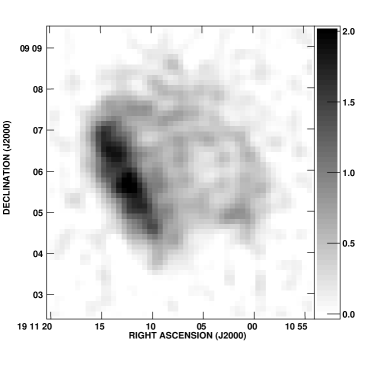
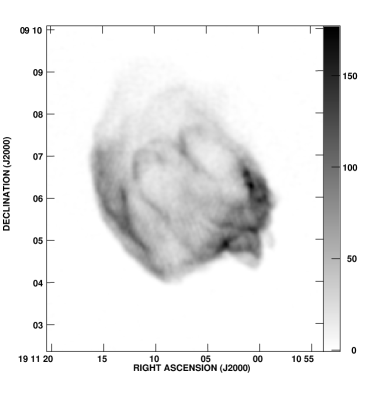
Figures 1 and 2 show the 74 and 327 MHz images of W49B (catalog ), respectively. The images are strikingly different. At 327 MHz (Figure 2) W49B (catalog ) shows a limb-brightened, shell morphology similar to that seen at higher frequencies and in previous 90 cm observations (Moffett & Reynolds, 1994), with the southwest portion of the supernova remnant being the brightest. In contrast, at 74 MHz (Figure 1) the morphology is reversed, with the eastern portion brightest, and the emission toward the southwest dramatically suppressed.


3 Results
Figure 1 suggests strongly that we have resolved spatially the thermal absorption inferred previously from the low-frequency turnover in the continuum spectrum and from RRLs detected toward W49B (catalog ). In this section, we first demonstrate that the 74 MHz flux density we measure is consistent with the degree of absorption inferred from the integrated continuum spectrum. We then argue that this level of absorption and its morphology favor an extrinsic ISM absorber. Finally, we address the scale size constrained by the spatially-resolved structure in the absorber toward W49B (catalog ).
3.1 Integrated Spectrum and Absorption of W49B
Figure 3 shows the spectrum of the total remnant and compares our flux density measurements to those published previously. The data for the spectrum of the remnant are taken from Kassim (1989), as is the fit to those data. The expected 74 MHz flux density from Kassim’s (1989) spectral fit (66 Jy) exceeds the value we measure (55 Jy) by 20%. We do not consider this discrepancy to be significant. First, the lowest frequency flux densities compiled by Kassim (1989) were often plagued by confusion, resulting from the poor angular resolution, and therefore tend to overestimate the flux densities of SNRs. Variations at the levels of the uncertainties in the spectral fits ( in spectral index and % in optical depth) can account for the discrepancy between expected and observed flux densities. Second, some of the discrepancy may result from W49B (catalog ) being partially resolved out by our A-configuration 74 MHz observations. Even so, this would not affect our general conclusions: There is considerable asymmetry in the structure of W49B (catalog ) at 74 MHz, an asymmetry that differs substantially from what is seen at higher frequencies. Moreover, B-configuration observations obtained recently show a similar east-west asymmetry of the 74 MHz emission, albeit at lower resolution (Perley 2000, private communication), giving us further confidence that resolution effects are not the dominant cause of the low-frequency asymmetry. We therefore consider our 74 MHz integrated flux density consistent with previous work, although the optical depths we present here could be considered conservatively as upper limits. Our multi-configuration observations at 327 MHz means that resolution effects do not affect these data.

Figure 3 also shows the spectra for the eastern and western halves of W49B (catalog ). The data for the eastern and western halves of the remnant were obtained from the images presented here and from images presented by Moffett & Reynolds (1994, at 1452 and 4885 MHz) and are summarized in Table 2. We used the 74 MHz image as a guide for delimiting the eastern and western halves of the remnant, with the dividing line being the right ascension . The flux densities shown for the eastern and western halves of the remnant were taken to be the integrated brightness of the remnant either east or west of this dividing line. No attempt has been made to account for frequency-dependent position shifts within the remnant.
| Total | East Half | West Half | |
|---|---|---|---|
| (MHz) | (Jy) | (Jy) | (Jy) |
| 74 | 55.6 0.8 | 41.5 0.7 | 14.2 0.5 |
| 326 | 56.0 0.02 | 28.5 0.02 | 27.6 0.02 |
| 1452 | 34.9 0.07 | 16.7 0.05 | 18.4 0.04 |
| 4885 | 13.7 0.03 | 5.87 0.02 | 7.90 0.02 |
Uncertainties in the flux densities are taken to be where is the rms noise level in the image and is the size of the region expressed as a number of synthesized beams. These uncertainties do not take into account various systematic effects, e.g., the amount of flux resolved out by the interferometer, so should be viewed conservatively as lower limits to the actual uncertainties.
A division into only eastern and western halves of the remnant is clearly a crude measure of the morphology. Nonetheless, it will serve our purpose of demonstrating a link between the morphology and spectrum, and it will suffice for obtaining an estimate of the amount of absorption along the line of sight (see below).
Following Kassim (1989) we fit the spectra for the eastern and western halves of the remnant to the functional form
| (1) |
where and are the flux density and free-free optical depth, respectively, at the fiducial frequency of 408 MHz.
The best-fit values for the free-free optical depths, scaled to 74 MHz assuming a dependence, are for the eastern half and for the western half. The western half of W49B (catalog ) shows a significant increase in optical depth as compared to the eastern half.
The value for is likely to be an overestimate. As Kassim (1989) discusses, if the low-frequency turnover occurs near the lowest observation frequency, the resulting estimates of the optical depth will be highly uncertain. He illustrates this point by comparing Culgoora and Clark Lake Radio Observatory flux density measurements for W49B (catalog ). However, given that the flux density for the western half of the remnant at 74 MHz is significantly below the value at 327 MHz, we regard as being a robust estimate of the free-free optical depth. The equivalent emission measure for the western half is , for an electron temperature of K and where we have taken the Gaunt factor to be unity.
3.2 Intrinsic vs. Extrinsic Absorption
Intrinsic thermal absorption at low radio frequencies has been detected toward two young Galactic SNRs, but we do not favor this scenario as an explanation for the low-frequency absorption toward W49B (catalog ). In Cas A (catalog ) (Kassim et al., 1995) the morphology of the absorption is centrally condensed, consistent with the presumed location of unshocked ejecta interior to the reverse shock. Moreover, the magnitude of the absorption () is much less than what we observe toward the western side of W49B (catalog ). The observed absorption in the Crab Nebula (catalog ) (Bietenholz et al., 1997) is not centrally condensed but has been linked to one of the largest thermal filaments at the foreground periphery of the remnant. Furthermore, the degree of absorption corresponds to an optical depth , even lower than that seen within Cas A (catalog ).
Fujimoto et al. (1995) find a centrally-condensed X-ray morphology for W49B (catalog ), which they attribute to thermal emission from hot gas in the remnant’s interior. This hot gas is unlikely to contribute to any appreciable free-free absorption at our observing frequencies. Using the parameters they derive for the hot gas ( K, cm-3, pc), we find an optical depth of at 74 MHz.
We consider both the asymmetry and magnitude of the observed absorption toward W49B (catalog ) to be evidence in favor of extrinsic thermal absorption, in agreement with conclusions drawn from earlier low frequency measurements. Since W49B (catalog ) is a young SNR, we cannot rule out that unshocked ejecta near the center of the remnant may be contributing to the absorption, but it is unlikely to dominate.
3.3 Morphology of the Absorption: Scale Sizes
The gross appearance of the 74 MHz image (Figure 1) and the analysis of §3.1 suggests that the absorber toward W49B (catalog ) is a discrete structure covering mainly the western half of the source with a scale size of a few arcminutes. We now use Figures 1 and 2 to assess the existence of smaller scale absorption structures as well.
Assuming that the high-frequency spectrum can be extrapolated to 74 MHz and that there are no intrinsic spatial variations in the radio spectrum of the remnant between 74 and 327 MHz, we used the 327 MHz image to produce an expected 74 MHz image . In combination with the observed 74 MHz image , we then produced an image of the 74 MHz optical depth, , and across the face of the remnant. A temperature of K and a Gaunt factor of unity were used to convert to EM. Figure 4 shows the resulting distribution of EM across the face of W49B (catalog ).
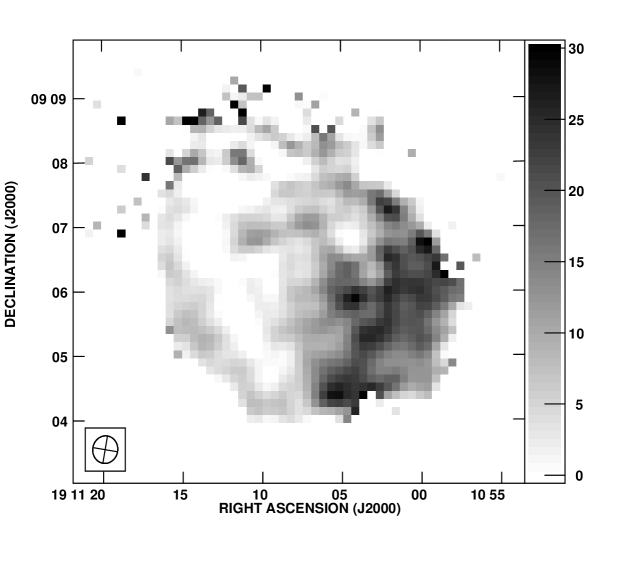
Although the signal-to-noise level is low in the region of maximum EM and optical depth (typically 3–), Figure 4 clearly shows that there are small scale variations in EM across the face of the remnant. The typical scale size of the variations appears to be comparable to or smaller than our beam, indicating that the absorber has EM variations at least as small as 25″ (1.2 pc at 10 kpc).
4 An Extended Hydrogen Envelope Toward W49B
Extended hydrogen envelopes (EHEs) were postulated by Anantharamaiah (1985), primarily to explain various RRL observations (see also Pankonin & Downes, 1976; Anantharamaiah, 1985). The observations require EHEs to be low density (–10 cm-3), extended (–200 pc), inhomogeneously-distributed H II gas. In this section we show that the absorber in front of W49B (catalog ) is likely to be a series of classical H II regions around which an EHE has formed.
4.1 Previous Observations and Constraints on EHEs Toward W49B
Pankonin & Downes (1976) have already analyzed the line of sight toward W49B (catalog ), using both RRLs, which are unusual in the direction of a Galactic SNR, and previous estimates of the low-frequency optical depth toward W49B (catalog ). Assuming that the RRLs and the free-free absorption arise from the same gas, they constrained the ionized gas to have an electron density cm-3 and temperature – K. In order to make these determinations, Pankonin & Downes (1976) had to make an assumption about the radial extent of the ionized region. They argued that the transverse extent of the region is roughly 15′, equivalent to a linear extent of 45 pc at a distance of 10 kpc, and so that plausible values for the radial extent were 10 pc–1 kpc, leading to the values quoted.
4.2 Low-Frequency Imaging of H II Regions and Their Envelopes
Our observations show that the absorption across the western face of W49B (catalog ) has a mean value of and can be explained by a thermal cloud of size of a few arcminutes (10 pc at 10 kpc) with . Pankonin & Downes’ (1976) analysis used a free-free optical depth of , a value determined by Dulk & Slee (1975) from spatially unresolved observations. Our higher angular resolution measurements show that the optical depth is larger than what Pankonin & Downes (1976) assumed, but only by a factor of a few. For an observed and assumed radial extent , and are constrained to be . Therefore, the somewhat smaller value of employed by Pankonin & Downes (1976) does not change their conclusions substantively and can be accommodated by a slightly higher value for or slightly lower value for or both. Furthermore, the few arcminute scale size constrained from our observations is within a factor of a few of their estimate of 15′ for the size of the ionized region.
Anantharamaiah’s (1986) model for an EHE is low-density H II gas surrounding, either partially or fully, a classical H II region. Figure 4 shows that there are EM variations on size scales of approximately the synthesized beam (25″). We now show that these regions of highest EM are likely to be classical H II regions around which an EHE (or overlapping EHEs) has formed.
The regions of maximum EM in Figure 4 have pc cm-6 (for an assumed temperature K) and size of roughly 25″. (We refer only to the regions of maximum EM in the interior of the western half of the SNR. The rim of the SNR, particularly to the northeast, shows artificially high values of EM due to low signal-to-noise ratios.) The linear extent of these regions is roughly 1 pc (at 10 kpc), so the electron density within these regions is cm-3. The electron density within these regions also cannot exceed cm-3 by too large of a factor. Figure 2 shows that W49B (catalog )’s morphology at 327 MHz is similar to that seen at higher frequencies. Thus, these EM variations must not arise from regions so dense as to cause appreciable free-free absorption at 327 MHz. A free-free optical depth at 327 MHz of requires that an H II region have pc cm-6, for an assumed temperature K. The pressure within such a region would be K cm-3, well in excess of the typical ISM pressure of K cm-3 (Kulkarni & Heiles, 1988). Such objects would have to be either extremely young or immersed in a higher pressure environment. All of these properties— pc cm-6, cm-3, size of roughly 1 pc, and high pressure—are consistent with these EM variations representing classical H II regions.
Figure 4 shows that not only are there localized enhancements in the EM, but that there is a diffuse, extended region of lower EM surrounding these localized enhancements. The diffuse, extended regions of lower EM have a typical value of pc cm-6. We emphasize two aspects of the regions of lower EM. First, the regions of lower EM represent regions of higher signal-to-noise ratios than the localized enhancements. The lower EM regions are more significant. Second, the typical size of the localized EM enhancements are comparable in size to the synthesized beam while being separated by angular distances comparable to or larger than the synthesized beam. Thus, the regions of lower EM represent areas of real, lower absorption as opposed to a resolution effect. If classical, density-bounded H II regions were in front of W49B (catalog ) but located so close together on the sky that our resolution was just capable of separating them, regions of apparently lower EM would exist simply because of spatial averaging by the synthesized beam. Our synthesized beam is small enough and the localized EM enhancements are well separated enough that the regions of lower EM represent actual absorption.
Figure 4 is constructed assuming K. Pankonin & Downes’ (1976) analysis indicates that EHEs likely have a lower temperature, probably closer to K. A lower assumed temperature implies that the EM in the extended, diffuse EM regions is a factor of order lower or pc cm-6. For a scale size of order 10 pc, the density within these diffuse EM regions is then cm-3. Thus, the extended, diffuse EM portion of Figure 4 represents the EHE of Pankonin & Downes (1976) and Anantharamaiah (1986) while the localized EM enhancements are the classical H II regions. The lower density and pressure of the EHE suggests that the classical H II regions are only partially radiation-bounded or that they are expanding into a lower density region (a.k.a. the “blister” model, Israel, 1978).
4.3 Associated Neutral and Molecular Material
The RRLs observed toward W49B (catalog ) have LSR velocities near 60 km s-1. Both H I (Brogan & Troland, 2000) and a variety of molecular species, including OH (Crutcher et al., 1987) and H2CO (Bieging et al., 1982; Wadiak et al., 1988), also are seen in absorption at the same velocity toward the W49 (catalog ) complex. Most of these observations have targeted W49A (catalog ), though some (notably those cited above) have included W49B (catalog ). We use those observations that have resolved W49B (catalog ) to show that the ionized material has associated neutral and molecular material. We emphasize that we shall focus only on material at a velocity of 60 km s-1; the H I absorption in particular is both spatially complex and present at a number of velocities (Brogan & Troland, 2000), but RRLs are seen only at 60 km s-1.
Figure 5 shows the angular distribution of the H I absorption at 60 km s-1 measured by Brogan & Troland (2000) compared to the 74 MHz radio continuum (Figure 1). The close correspondence between the region of maximum H I absorption and the 74 MHz continuum absorption is clear. Moreover, Brogan & Troland (2000) describe the appearance of the H I absorption as “spotty,” which is similar to the appearance of the 74 MHz image (Figure 1). Observations with the Chandra X-ray telescope also suggest that the X-ray emission is attenuated in the southwestern portion of the remnant (Hwang 2000, private communication), consistent with an increase in H I column density along this line of sight. Figure 5 also shows the location of the peak H2CO absorption at 60 km s-1 measured by Bieging et al. (1982). Although Bieging et al.’s (1982) observations only marginally resolved W49B (catalog ) (26 beam), the peak H2CO absorption occurs on the western side of the SNR.
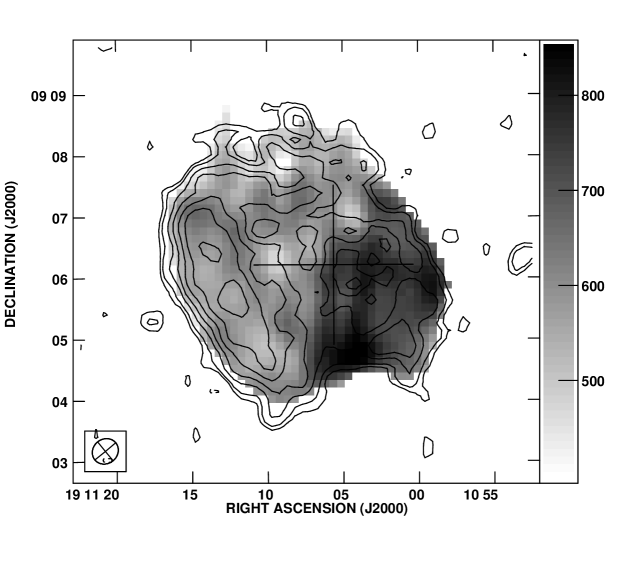
The correspondence between the angular distribution of the H I and H2CO absorption at 60 km s-1 and the 74 MHz continuum absorption and the common velocities of the RRLs, H I absorption, and H2CO absorption (and other molecular species) indicates that the ionized, neutral, and molecular material is spatially collocational along this line of sight. Furthermore, the appearance of both the ionized and neutral absorption suggests that the material has considerable small-scale structure. This material probably is located within the Sagittarius arm (Greaves & Williams, 1994). If so, it could be considerably closer (factor of 2 or more closer or 5 kpc) than the presumed distance to W49B (catalog ). Though we have assumed a distance of 10 kpc in converting angles to distances above, using a distance of 5 kpc will lead to no more than a factor of 2 error in the derived quantities (e.g., ).
Absorption in various molecular species is seen toward W49A (catalog ) at a velocity of 60 km s-1. We consider it likely that common material is responsible for the absorption toward both W49A (catalog ) and W49B (catalog ) at 60 km s-1. Comparison of line ratios and radiative transfer modeling suggest that the molecular material is at a low density ( cm-3) and has an excitation temperature close to 3 K. Many authors (e.g., Wadiak et al., 1988; Greaves & Williams, 1994) have concluded that these molecular clouds do not currently support any star formation.
This apparent discrepancy between the 74 MHz observations—clearly indicating the presence of ionized material—and the molecular observations—suggesting no ionizing sources—may have a number of resolutions. The molecular clouds may simply have a low level of star formation or the H II regions may be produced by passing early-type stars that are otherwise not associated with the clouds.
Cosmic-ray ionization is unlikely to be the explanation of this discrepancy as the ionization rate required to produce the observed electron density if the neutral and ionized material are mixed (Hughes et al., 1971) is – s-1, orders of magnitude larger than the nominal cosmic ray ionization rate (Kulkarni & Heiles, 1988). Future observations of molecular species with a resolution similar to or better than that of the 74 MHz and H I observations would aid greatly in assessing to what extent the molecular material shows a similar morphology.
4.4 Interstellar Scattering toward W49B
Lines of sight to the west of W49B (catalog ) show enhanced radio-wave scattering, via enhanced angular broadening measurements of OH masers and extragalactic sources (Kent & Mutel, 1982; Fey et al., 1991). The gas responsible for the RRLs and free-free absorption may be responsible for this enhanced scattering.
It is commonly assumed that the density fluctuations responsible for interstellar scattering have a power-law power spectrum parameterized as
| (2) |
for length scales between an inner scale and an outer scale (Rickett, 1990). The (slowly-varying) coefficient describes the strength of density fluctuations and is related to the rms density. Analogous to the emission measure EM, the scattering measure SM is the line-of-sight integral of ,
| (3) |
Various observables (for a review see Taylor & Cordes, 1993), including scattering diameters, can be used to infer SM. Based on the EM of the EHE, the scattering measure contributed by this absorbing cloud can be no more than (Cordes et al., 1991), for an assumed outer scale of pc. The SM must be less than this value because all free electrons along the line of sight contribute to the EM while only fluctuations in the electron density contribute to SM.
The measured angular diameters imply kpc m-20/3. Taken at face value our predicted value for the SM is sufficient to explain the enhanced scattering. However, we have assumed a larger than normal value for . In particular, other analyses of enhanced scattering regions suggest that pc (Frail et al., 1993; Lazio & Cordes, 1998).
In general, unambiguous association of an absorbing cloud with the scattering material will be difficult. W49B (catalog ) (and many other supernova remnants) lies at a fairly large distance at a low Galactic latitude toward the inner Galaxy. Other ionized gas along the line of sight could contribute to the radio-wave scattering.
5 Conclusions
We have used the VLA to image the Galactic supernova remnant W49B (catalog ) at 74 and 327 MHz with 25″ and 6″ angular resolution, respectively. Our 74 MHz image (Figure 1) marks the lowest frequency at which this remnant has been angularly resolved. At frequencies above 1 GHz, W49B (catalog ) has a limb-brightened shell. This remnant retains this morphology at 327 MHz (Figure 2).
A dramatic difference in the remnant’s morphology is seen between 74 MHz and higher frequency images, with the southwestern portion of the remnant being significantly fainter. The flux densities we measure at 74 and 327 MHz are consistent with previous determinations of a low-frequency turnover in the SNR’s integrated continuum spectrum near 80 MHz. We have also compared the spectra of the eastern and western halves of the SNR (Figure 3). The western half of the SNR is significantly more absorbed, demonstrating that the morphological differences and the low-frequency turnover are linked.
Both the low-frequency turnover and morphology of W49B (catalog ) are due to foreground ionized gas. Earlier analyses (Pankonin & Downes, 1976; Anantharamaiah, 1986), based on lower resolution observations, suggested that the ionized gas should be extended ( pc or a few arcminutes) and low density ( cm-3). The gross morphology and integrated spectrum that we obtain are consistent with these analyses, if we include additional absorption from small scale H II regions as well.
Our 74 and 327 MHz images have sufficient angular resolution to enable us to resolve the distribution of emission measure EM across the face of W49B (catalog ) (Figure 4). The EM distribution shows localized enhancements— pc cm-6, cm-3, size of roughly 1 pc, and high pressure—that we identify as being classical H II regions. Strengthening their identification as H II regions is the high correlation between the distribution of EM and H I absorption. Regions of high EM are also regions of high H I absorption. At the same velocity as the H I absorption, there are also H2CO absorption observations that just resolve the SNR. These molecular observations also indicate an increase in absorption to the western side of the SNR.
Surrounding the localized EM enhancements are regions of lower EM. This lower EM material represents the extended, low-density, ionized gas or extended H II envelope suggested by previous analyses. We have therefore resolved the low-frequency absorption in front of W49B (catalog ) into a complex of H II regions and an EHE (or nearly overlapping EHEs).
The ionized gas responsible for the free-free absorption and radio recombination lines may be responsible for the enhanced radio-wave scattering seen in the general direction of the W49 (catalog ) complex. However, given the line of sight into the inner Galaxy, it is difficult to make an unambiguous determination of the location of the enhanced scattering region.
Future observations at both low and high frequencies will be essential for constraining further the properties of the ionized gas responsible for low-frequency turnovers. Future high-frequency interferometers may have sufficient sensitivity to map the angular distribution of molecular material toward W49B (catalog ) and other supernova remnants. At low frequencies resolving the angular distribution of the radio recombination lines is essential to verifying a crucial assumption in both this work and that of Pankonin & Downes (1976), that the RRLs and the free-free absorption do arise from the same ionized gas. Low-frequency observations of other supernova remnants are planned with both the NRL-NRAO 74 MHz system at the VLA (and the GMRT and other future low-frequency interferometers) and will be used to establish to what extent the line of sight toward W49B (catalog ) is or is not representative. Low-frequency observations of a high-latitude or outer Galaxy supernova remnant may also allow a more definitive connection to be established between the extended low-density ionized gas and the gas responsible for radio-wave scattering. Particularly powerful would be a demonstration of a correlation in free-free absorption and scattering, e.g., enhanced angular broadening for sources seen near one side of a remnant showing enhanced free-free absorption.
References
- Anantharamaiah (1985) Anantharamaiah, K. R. 1985, J. Astrophys. Astron., 6, 177
- Anantharamaiah (1986) Anantharamaiah, K. R. 1986, J. Astrophys. Astron., 7, 131
- Bieging et al. (1982) Bieging, J. H., Wilson, T. L., & Downes, D. 1982, A&AS, 49, 607
- Bietenholz et al. (1997) Bietenholz, M. F., Kassim, N., Frail, D. A., Perley, R. A., Erickson, W. C., & Hajian, A. R. 1997, ApJ, 490, 291
- Brogan & Troland (2000) Brogan, C. L. & Troland, T. H. 2000, ApJ, submitted
- Crutcher et al. (1987) Crutcher, R. M., Kazès, I., & Troland, T. H. 1987, A&A, 181, 119
- Cordes et al. (1991) Cordes, J. M., Weisberg, J. M., Frail, D. A., Spangler, S. R., & Ryan, M. 1991, Nature, 354, 121
- Cornwell & Perley (1992) Cornwell, T. J. & Perley, R. A. 1992, A&A, 261, 353
- Dyer et al. (2000) Dyer, K. K., Kassim, N., Reynolds, S. P., Petre, R. 2000, ApJ, in The Universe at Low Frequencies (ASP: San Francisco) in press
- Dulk & Slee (1975) Dulk, G. A. & Slee, O. B. 1975, ApJ, 199, 61
- Fey et al. (1991) Fey, A. L., Spangler, S. R., & Cordes, J. M. 1991, ApJ, 372, 132
- Frail et al. (1993) Frail, D., Kulkarni, S., & Vasisht, G. 1993, Nature, 365, 136
- Fujimoto et al. (1995) Fujimoto, R., et al. 1995, PASJ, 47, L31
- Greaves & Williams (1994) Greaves, J. S. & Williams, P. G. 1994, A&A, 290, 259
- Hughes et al. (1971) Hughes, M. P., Thompson, A. R., & Colvin, R. S. 1971, ApJS, 23, 323
- Israel (1978) Israel, F. P. 1978, A&A, 70, 769
- Kassim (1989) Kassim, N. E. 1989, ApJ, 347, 915
- Kassim et al. (1995) Kassim, N. E., Perley, R. A., Dwarakanath, K. S., & Erickson, W. C. 1995, ApJ, 455, L59
- Kassim et al. (1993) Kassim, N. E., Perley, R. A. Erickson, W. C., & Dwarakanath, K. S. 1993, AJ, 106, 2218
- Kent & Mutel (1982) Kent, S. R. & Mutel, R. L. 1982, ApJ, 263, 145
- Kulkarni & Heiles (1988) Kulkarni, S. R. & Heiles, C. 1988, in Galactic and Extragalactic Radio Astronomy, eds. G. L. Verschuur & K. I. Kellermann (Springer-Verlag: Berlin) p. 95
- Lazio & Cordes (1998) Lazio, T. J. W. & Cordes, J. M. 1998, ApJ, 505, 715
- Moffett & Reynolds (1994) Moffett, D. A. & Reynolds, S. P. 1994, ApJ, 437, 705
- Pankonin & Downes (1976) Pankonin, V. & Downes, D. 1976, A&A, 47, 303
- Pye et al. (1984) Pye, J. P., Thomas, N., Becker, R. H., & Seward, F. D. 1984, MNRAS, 207, 649
- Radhakrishnan et al. (1972) Radhakrishnan, V., Goss, W. M., Murray, J. D., & Brooks, J. W. 1972, ApJS, 24, 49
- Rickett (1990) Rickett, B. J. 1990, ARA&A, 28, 561
- Smith et al. (1985) Smith, A., Peacock, A., Jones, L. R., & Pye, J. P. 1985, ApJ, 296, 469
- Taylor & Cordes (1993) Taylor, J. H. & Cordes, J. M. 1993, ApJ, 411, 674
- Wadiak et al. (1988) Wadiak, E. J., Rood, R. T., & Wilson, T. L. 1988, ApJ, 324, 931