Acoustic Oscillations in the Early Universe and Today
Christopher J. Miller, Robert C. Nichol,
Department of Physics,
Carnegie Mellon University,
Pittsburgh, PA 15213,
United States of America.
and
David J. Batuski,
Department of Physics & Astronomy,
University of Maine,
Orono, ME, 04469
United States of America.
During its first years, the universe was a fully ionized plasma with a tight coupling by Thompson scattering between the photons and matter. The trade–off between gravitational collapse and photon pressure causes acoustic oscillations in this primordial fluid. These oscillations will leave predictable imprints in the spectra of the cosmic microwave background and the present day matter-density distribution. Recently, the BOOMERANG and MAXIMA teams announced the detection of these acoustic oscillations in the cosmic microwave background (observed at redshift ). Here, we compare these CMB detections with the corresponding acoustic oscillations in the matter-density power spectrum (observed at redshift ). These consistent results, from two different cosmological epochs, provide further support for our standard Hot Big Bang model of the universe.
The standard model of cosmology is the Inflationary Hot Big Bang scenario. A key aspect of this model is the ease with which it explains some critical observational facts about the universe. For example, the existence of the cosmic microwave background (CMB) radiation that fills all space is simply the radio remnant of a hot early phase of the universe i.e. when it was only 100,000 years old. The model also provides a natural explanation for Hubble’s famous expansion, large–scale coherent structures in the mass distribution (caused by quantum effects in the early universe), as well as producing a flat global geometry for the universe (1). In this scenario, the distribution of matter on the largest scales is connected, through well-established physics, to the temperature fluctuations in the CMB. Thus, any independent agreement between the CMB (at redshift ) and the matter-density distribution (at redshift ), is naturally explained by the Hot Big Bang Inflationary model.
The early universe was a plasma made uo of photons, electrons and protons, along with the so-called Dark Matter. During this period, the gravitational force from potential wells (created as a result of local curvature pertubations or dark matter clumps) causes compressions in this fluid. As the plasma collapses inward, it meets resistance from photon pressure, reversing the plasma direction and causing a subsequent rarefaction. This cycle of compression and rarefaction results in acoustic oscillations, where baryons act as a source of inertia. Compression (rarefaction) of the plasma creates hot (cold) spots in the temperature of the plasma. Because the photons and baryons are coupled through Thompson scattering, the matter-density power spectrum will also exhibit these oscillations. As the universe cooled and the photons and matter decoupled, the acoustic oscillations became frozen as oscillatory features in both the temperature and matter-density power spectra. These acoustic oscillations are a general prediction from gravitational instability models of structure formation (2,3).
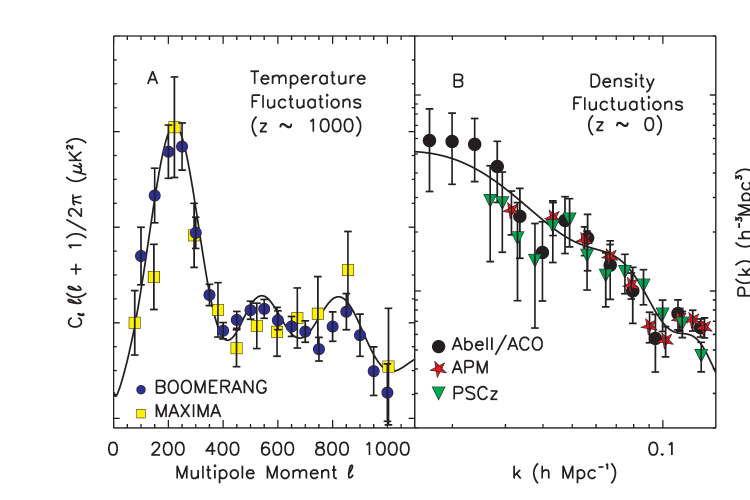
The recent results from the MAXIMA and BOOMERANG CMB balloon experiments provide evidence for the first two acoustic peaks (4–8). These acoustic oscillations are the peaks and valleys in Fig. 1A. The location and amplitude of the first peak indicates that we live in a universe that is geometrically flat, with a fractional contribution of the total mass over the critical mass (required for a flat universe) of , where the reduced Hubble constant is km s-1Mpc-1. The remaining contribution to the critical mass must come in some form of dark energy (specified as ). The CMB data also indicate the detection of the second acoustic peak that, along with the first peak, can constrain the density of baryons in the universe ().
Until recently, the use of the local matter distribution in the universe has been limited to constraining just , as the datasets were not large enough to detect the acoustic oscillations. On scales smaller than Mpc, the oscillations will be wiped out by the individual motions of galaxies and clusters. Here, we examine the matter-density power spectrum on near-gigaparsec scales, where the imprint of the acoustic oscillations should be detectable. For our study, we use clusters of galaxies and individual galaxies as tracers of the matter in the universe, and describe their distribution by the power spectrum, of fluctuations in this density field, :
| (1) |
The power spectrum is a function of wavenumber , where is the scale size in units of Mpc. We have derived from three cosmological redshift surveys: the Abell/ACO Cluster Survey (9,10), the IRAS Point Source redshift catalog (PSCz) (11,12), and the Automated Plate Measuring machine (APM) cluster catalog (13,14). The volumes traced by these surveys are large enough to accurately probe the power spectrum to near-gigaparsec scales.
We find oscillatory features in the matter-density power spectrum (Fig 1B), consistent with a cosmological model having , , and , where is the primordial spectra index ( confidence limits) (15,19). These fitted parameters provide almost enough information to independently predict the CMB temperature spectrum free of any CMB data. All that is needed is a choice for , which affects the temperature power spectrum, but has no effect on the shape of the local matter-density power spectrum (16). Fortunately, the recent Type Ia supernovae results provide us with an independent measurement of (17,18). Thus, using the data at redshift from galaxies and clusters of galaxies, along with the recent supernovae data at redshift , we can accurately predict the CMB temperature power spectrum (Fig. 1A) at redshift , under the assumption of the standard cosmological model.
We see a direct concordance between the CMB, which originated 100,000 years after the Big Bang, the supernovae data, measured at roughly half the age of the universe, and the matter-density distribution, which is measured today. Not only do these results provide support for the Hot Big Bang Inflationary model, they also show that we understand the physics of the early universe. This physics can take us forward in time, predicting the matter-density distribution from the CMB, or as we have shown here, backwards in time, “predicting” the CMB using the distribution of galaxies and clusters in our local universe.
References
| 1. Peebles, P. J. E. Principles of Physics Cosmology (Princeton University Press, NJ, | |
| 1993). | |
| 2. Peebles, P. J. E. & Yu, J. T., Astrophys. J. 162, 815 (1970). | |
| 3. Hu, W. & White, M., Astrophys. J. 471, 30 (1996). | |
| 4. Miller, A.D., et al. Astrophys. J. 524L, 1 (1999). | |
| 5. Balbi, A. et al., Astrophys. J. 545, L1 (2000). | |
| 6. Melchiorri, A. et al., Astrophys. J. 536, L63 (2000). | |
| 7. Netterfield, C.B., et al. submitted to Astrophys. J. (2001) astro-ph/0104460. | |
| 8. Lee, A.T., et al. (2001) astro-ph/0104459 | |
| 9. Miller, C.J., Batuski, D.J., Astrophys. J. in press (2001). | |
| 10. Miller, C.J., Krughoff, K.S., Batuski, D.J., Slinglend, K.A., Hill, J.M., | |
| submitted to Astron. J. (2001). | |
| 11. Saunders, W. et al., Mon. Not. R. astr. Soc. 317, 55 (2000). | |
| 12. Hamilton, A.J.S., Tegmark, M., submitted to Mon. Not. R. astr. Soc. (2001) | |
| astro-ph/0008392. | |
| 13. Dalton, G.B., Efstathiou, G., Maddox, S.J., and Sutherland, W.J., | |
| Mon. Not. R. astr. Soc. 271, 47 (1994). | |
| 14. Tadros, H.,Efstathiou, G., & Dalton, G., Mon. Not. R. astr. Soc. 296, 995 (1998). | |
| 15. Miller, C.J., Nichol, R.C. & Batuski, D.J., Astrophys. J. in press (2001). | |
| 16. This is only true if we fix the Hubble constant, , and , | |
| thus altering only the curvature of the universe, which has no effect on the shape of | |
| the matter-density power spectrum. | |
| 17. Perlmutter, S. et al., Astrophys. J. 517, 565 (1999). | |
| 18. Reiss, A.G, Press, W.H., Kirshner, R.P. Astrophys. J. 438L, 17 (1995) | |
| 19. We use the publicly available CMBFAST code to generate our cosmological models. | |
| This code is described in Seljak, U. & Zaladarriaga, M., Astrophys. J. 469, | |
| 437 (1996) |