Searching for the Physical Drivers of the Eigenvector 1 Correlation Space
Abstract
We recently discussed an Eigenvector 1 (E1) parameter space that provides optimal discrimination between the principal classes of broad-line Active Galactic Nuclei (AGN). In this paper we begin a search for the most important physical parameters that are likely to govern correlations and data point distribution in E1 space. We focus on the principal optical parameter plane involving the width of the H broad component [FWHM(H)] and the equivalent width ratio between the Fe ii blend at 4570 and H. We show that the observed correlation for radio-quiet sources can be accounted for if it is primarily driven by the ratio of AGN luminosity to black hole mass (L/M Eddington ratio) convolved with source orientation. L/M apparently drives the radio-quiet correlation only for FWHM(H)4000 km s-1 which includes Narrow Line Seyfert 1 (NLSy1) galaxies and can be said to define an AGN “main sequence.” Source orientation plays an increasingly important role as FWHM(H) increases. We also argue that AGN lying outside the radio-quiet “main sequence,” and specifically those with optical Fe ii much stronger than expected for a given FWHM(H), may all be Broad Absorption Line QSOs.
1 Introduction
We have recently identified a correlation space for broad line AGN involving:(1) Balmer line width (FWHM(H)), (2) relative strength of optical Fe iiopt and H emission lines (the equivalent width ratio of Feiiopt emission in the range 4435–4685 Å and the broad component of H: W(Feii 4570)/W(H)=RFeII), (3) soft X-ray photon index and (4) Civ1549 broad line profile centroid shift (Sulentic et al., 2000a, b). In simplest terms the parameters can be said to measure: (1) the broad line region (BLR) velocity dispersion, (2) the relative strengths of low ionization lines that are thought to arise in the same structure, (3) the strength of a (thermal) soft X-ray photon excess, and (4) the amplitude of systematic radial motions in the high ionization gas. We call this parameter space “Eigenvector 1” (hereafter E1) reflecting its partial origin in a principal component analysis of the low redshift (z0.5) part of the Palomar-Green quasar sample (Boroson & Green 1992, hereafter BG92). E1 allows us to discriminate between most AGN classes that show broad emission lines (Sulentic et al., 2000a, b).
E1 separates the majority of radio-quiet (RQ) sources from radio-loud (RL) AGN. The E1 parameter space distribution also suggests the possible existence of two RQ classes. Population A with FWHM(H) 4000 km s-1 and average E1 parameter values: (a) RFeII 0.7, (b) 2.8 and (c) Civ1549 centroid (blue)shift km s-1. Population B includes all of the remaining RQ AGN with FWHM(H) 4000 km s-1and shows average E1 parameter values: (a) RFeII , (b) and, (c) Civ1549 centroid shift 0 km s-1. See Sulentic et al. (2000b) for sample variance and other details. RL and RQ population B sources occupy a similar parameter domain in E1 and show a large number of other observational similarities (Sulentic et al., 2000c).
After reviewing the occupancy of the optical E1 parameter plane (FWHM(H) vs. RFeII) and defining a “main sequence” for RQ Population A, we show that the mean ionization level of the broad lines decrease as one goes from RQ population B to population A sources (§2.2). In §4, we show how this result and the occupancy of the parameter plane can be explained in terms of different values of the Eddington ratio (analyzed in §3.2) convolved with the effect of source orientation (discussed in §3.1 and 3.2). We also consider potentially important outlier sources in §2.1 and in 6.1.
2 Relevant Trends
2.1 Definition of “Main Sequence” and “Outliers”
Population A sources show a clear and significant correlation among the E1 parameters while RQ population B and RL sources show a larger scatter with no obvious correlation. RQ population B sources occupy the same E1 parameter domain as, especially, flat spectrum (core dominated) RL sources (see Table 2 in Sulentic et al. (2000b)). It is however important to recognize that uncertainties are larger for most measures of RL and RQ population B sources. Limited S/N and line blending limit the accuracy of Feiiopt equivalent width measurements for sources with W(Feii 4570) 20 Å (RFeII0.2). That is why we cannot rule out the possibility that the RQ population A correlation extends into the RQ population B domain. At any rate, the RL sources are preferentially found in the same E1 domain as RQ population B, and are rarely found in the domain of population A. The concepts of a RQ population A – population B difference and of a RQ population B – RL similarity were motivated by the optical parameters but they are reinforced by X-ray and UV Civ1549 line shift measures. These differences/similarities are true irrespective of the reality of a parameter space break between population A and B (Sulentic et al., 2000b).
Figure 1 presents a schematic view of source occupancy in the FWHM(H) vs. RFeII parameter plane. We show correlation trends for: (1) our sample (Sulentic et al., 2000b), (2) two radio-loud samples (Brotherton, 1996; Corbin, 1997), and (3) a soft X-ray selected sample (Grupe et al., 1999). The solid lines representing (1) and (3) connect average values for sources in FWHM(H) ranges 0–2000, 2000–4000 and 4000 km s-1 respectively. All samples show the same general trends with broad line, Feiiopt-weak RQ population B/RL sources displaced towards the upper left and narrow line, Feiiopt strong, population A RQ towards the lower right. These lines indicate a tendency for AGN to lie along a “main sequence” (MS). In addition to some prototype sources, we show data points for Feiiopt strong (FIR bright) quasars (Lipari et al., 1993). The Lipari et al. (1993) sources are shown as a single point representing their average FWHM(H) and RFeII, with the exception of two objects, IRAS 0759+651 and Mark 231 which are reported individually in Fig. 1. We also identify all known broad absorption line (BAL) QSOs with absorption W(Civ1549) Å from the Sulentic et al. (2000b) and Lipari et al. (1993) samples. For PG quasars, data on absorption W(Civ1549) were obtained from Brandt, Laor, & Wills (2000) except for PG 1351+234, for which we measured the Civ1549 absorption on the IUE spectrum SWP54205.
We see that I Zw 1 (and other NLSy1), as well as several (low z) BAL QSOs, are located toward the high RFeII end of the MS. One could infer from Figure 1 that the MS may extend from the broadest double-peaked RL sources to the narrowest and Feiiopt strongest sources (like PHL 1092). It is not yet clear if these extrema should be considered outliers or extensions of the correlation found for the bulk of RQ Population A sources studied so far (see also §6). We can identify one clear class of outliers: sources occupying the upper right quadrant of the E1 plane (Fig. 1, which turn out to be all BAL QSOs. These are sources with FWHM(H) 3000 km s-1 and RFeII 1). In general, sources with RFeII [FWHM(H)/(2500 km s-1)]-1.4 (which approximately defines the upper boundary to the MS of Sulentic et al. (2000a)) are sources with Feiiopt in excess of the mean value expected for a given FWHM(H). They will be briefly considered in §6.1.
2.2 An Ionization Decrease from population B to population A
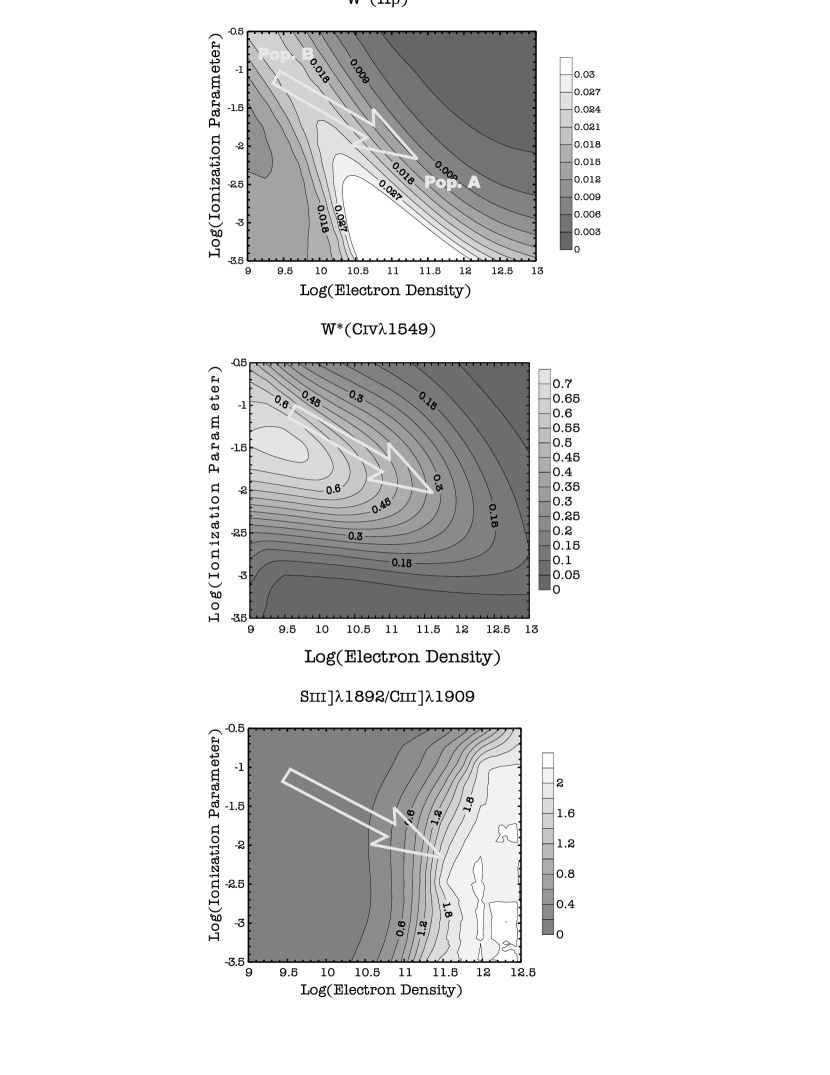
Table 1 shows relevant mean parameter values for RQ population A and B sources as well as for the extreme population A NLSy1 sources. All averages and sample standard deviations are from Sulentic et al. (2000b) except for I(Si III]1892)/I(Ciii]1909) which comes from HST data (Laor et al., 1994, 1995; Wills et al., 1999). The decrease in equivalent width of Civ1549 (our representative high ionization line) along with an increase in W(Feii 4570) (low ionization emission) suggest a systematic decrease in ionization level from RQ population B to population A. We interpret the data in Table 1 by considering the behavior of I(Si III]1892)/I(Ciii]1909), W(Civ1549) and W(H) as a function of the ionization parameter (U) and electron density ne. We compare the observed values with a grid of cloudy computations for AGN broad line emission (Korista et al., 1997). The models assumed a total column density and a standard AGN continuum (model 3–23 of Korista et al. (1997)). Figure 2 shows that all trends passing from population B towards population A consistently suggest a decrease in U and an increase in (from log(U) 1 to 1.5, log() 9.5, canonical value from AGN photoionization models to log(U) 2 to 2.5, log() 11.5). Notably, the density sensitive line ratio I(Si III]1892)/I(Ciii]1909) (almost independent of U for log(U) 0.5) indicates that (ne) 10.5 – 11 towards the NLSy1 domain.
These considerations quantify a general trend which is very appreciable in the spectra of AGN with different Balmer line widths (see Fig. 2 of Sulentic et al. (2000a)) and which has been systematically ignored in photoionization computations. It is probably the origin of our inability to explain some line ratios in quasar spectra (Sulentic et al., 2000b) and is obviously a zeroth-order result. Our earlier comparison of Civ1549BC and H properties motivated us to suggest that high and low ionization lines are not emitted in the same region, at least in population A sources (Marziani et al., 1996; Dultzin-Hacyan et al., 2000).
3 The Main Physical Parameters
3.1 The Role of Orientation in E1
Why is orientation important and why, at the same time, can it not account for all of the phenomenology? Important evidence in favor of orientation effects in RQ AGN involves H – Civ1549BC profile comparisons (Marziani et al., 1996; Sulentic et al., 2000b). Some NLSy1 sources such as I Zw 1 show a Civ1549BC profile that is almost completely blueshifted relative to a very narrow H. This robust observational result is easily explained in terms of: (1) a high-ionization wind emitting Civ1549BC and (2) an optically thick disk emitting H. The disk will obscure the opposite (receding) side of the high-ionization outflow (Marziani et al., 1996). Not all NLSy1 show large amplitude Civ1549 blueshifts but the currently observed range is from 0 to 5000 km s-1. NLSy1 also show low W(Civ1549) (Rodriguez-Pascual et al., 1997). The rarity of large amplitude Civ1549 blueshifts points toward a role for orientation since Civ1549 shifts are expected to be strongly orientation dependent in a disk + wind scenario.
In principle, it is possible to ascribe low W(H), W(Civ1549) and W([Oiii]5007) to an orientation dependent “blue bump” that amplifies the UV/optical continua and whose contribution to the continua increases with decreasing inclination (Marziani et al., 1996). However, this assumption is rather ad hoc and can not easily account for the increase of RFeII in sources with narrower FWHM(H). In that scenario RFeII should remain constant because H and Feiiopt would be similarly affected by the amplified continuum unless H and Feiiopt are both, but differently, anisotropic (Marziani et al., 1996). We remark that the observed RFeII increase appears to be mainly due to a decrease in W(H) towards the NLSy1 domain. This has been interpreted as the effect of collisional suppression of H (Gaskell, 1985) implying an increase in electron density. The correlation between ne-sensitive I(Si III]1892)/I(Ciii]1909) ratio and FWHM(H) also cannot be explained in terms of orientation. Physical conditions must change significantly along the AGN main sequence.
Further difficulties for an orientation-only hypothesis may involve the range of [Oiii]4959,5007 luminosity observed among PG quasars (BG, 92). We suggest that this issue needs reconsideration also because the [Oiii]4959,5007 emitting region in several Seyfert galaxies shows a bipolar structure (Falcke, Wilson, & Simpson, 1998), a result that suggests a strong orientation dependence.
3.2 The Eddington Ratio: A Parameter Affecting BLR Physical Conditions
E1 shows us that the diversity of AGN properties can be organized on the basis of a set of parameters involving: , FWHM(H), RFeII and Civ1549 line shift. Apart from the reasons outlined above, it is reasonable to infer that orientation alone would be unlikely to account for the E1 correlations because we would expect to find an overlapping domain for all RQ and RL AGN. A distinct RL sequence, if it exists, is apparently displaced from the RQ one. E1 suggests that it begins near FWHM(H)4000 km s-1 (Sulentic et al., 2000a, b). Our BG92 dominated sample suggests that RQ sources become rare above FWHM(H) 6000 km s-1 while RL are common from 4000 to, at least, 8000 km s-1. Support for a RQ-RL displacement comes from the detection of a strong H line in BLLAC with FWHM(H)4000 km s-1 (Corbett et al., 2000) which should be a near pole-on RL source. The presence of the soft X-ray excess as one of the principal correlates in E1 suggests that the Eddington ratio (i.e., the ratio L/M) may be the most important physical parameter driving E1, as well as the main factor accounting for the RQ and RL sequence displacement (BG, 92; Pounds et al., 1995; Boller et al., 1996; Sulentic et al., 2000a).
3.3 A Correlation Between FWHM(H) and L/M?
We often refer to the L/M ratio rather than the Eddington ratio (ratio between the bolometric and Eddington luminosities = dimensionless accretion rate ) because we rely, in this context, on independent observational measurements for both L and M. X-ray variability determination of M for a few AGN (Czerny et al., 2001) suggests an anti-correlation between L/M and FWHM(H). Figure 3 shows the best current observational evidence for the anti-correlation between dimensionless accretion rate and FWHM(H). It involves the sources with most accurate reverberation and/or X-ray variability based black hole mass determination. Sources like NGC 4051 and 4151 show a transient broad line component, which at some epochs is completely absent in unpolarized light (see e.g., Ulrich, Maraschi & Urry (1997) and references therein). FWHM(H) and X-ray properties for such sources may not allow a reliable mass estimate that is comparable with AGN showing a more typical variability pattern. At the other extreme, the two highest radiators, PHL 1092, and IRAS 132243809 show extreme optical properties (see §6 for a possible interpretation). The Czerny et al. (2001) dataset is obviously biased towards objects that show large amplitude X-ray variability. Only six sources remain in the X-ray sample if we omit them which is too few for a reliable determination of the correlation coefficient. The results shown in Figure 3 are suggestive with the X-ray based points showing a correlation at a 2 confidence level. If only the six sources are considered, Pearson’s correlation coefficient rP is with a probability P 0.04 that uncorrelated points could give rise to the computed rP. If all data points are taken into account, r (P 0.02).
Other approaches favor a strong correlation between and FWHM(H). Modeling of a radiation pressure-driven wind (Nicastro, 2000; Witt et al., 1997) predicts the relationship between and FWHM(H) (shown as the thick line of Fig. 3). A rather strong correlation between L/M and FWHM(H) also emerges using masses derived from reverberation mapping (Kaspi et al. (2000)) (filled circles and squares in Fig. 3). If all RQ and RL objects are considered except the outliers NGC 3227 (another transient H object) and NGC 4051, the correlation coefficient is r -0.75 (P 210-4). We obtain the following functional relationship by a robust fitting technique (e.g., Press, Teukolsky, Vetterling, & Flannery (1992)):
| (1) |
where Lλ is the specific luminosity at 5000 Å and FWHM(H) is expressed in units of 1000 km s-1. In order to transform to we assume a constant bolometric correction , appropriate for the typical AGN continuum as parameterized by Mathews and Ferland (1987). The –FWHM(H) best fit is shown in Fig, 3 as a thin solid line.
A FWHM(H) – L/M correlation in the case of reverberation masses is not surprising since it results in part from circular arguments (i.e., FWHM(H) is used to compute M from reverberation mapping data). Monte Carlo simulations were carried out assuming: (1) that distance r, FWHM(H) and luminosity are randomly distributed and uncorrelated in the observed ranges and (2) that M is related to the velocity dispersion by the virial relationship: M r v2. Observational errors for were assumed to contribute a Gaussian scatter with . In approximately 4000 random trials we found a probability P 0.05 that a correlation coefficient as large as 0.75 would be obtained. In order to fully circumvent the circularity issue we also assumed that FHWM(H) does not correlate strongly with either L or M separately (as noted also by Sulentic et al. (2000a)). Optical luminosity appears to be an orthogonal variable with respect to the E1 parameters (in BG92 it is part of their Eigenvector 2). Mass and FWHM(H) have r0.48. If we simulate data points for which: (1) the correlation between FWHM(H) and M falls in the range and (2) mass and luminosity are not correlated, we obtain a negligible probability that an 0.75 correlation between FWHM(H) and could occur randomly.
We conclude that the circularity inherent in the mass computation cannot fully explain the strength of the observed L/M vs. FWHM(H) correlation for reverberation masses. This provides much needed support for a physical relationship between L/M and FWHM(H). Given the caveats outlined above (small numbers of X-ray determined masses; M(FWHM) dependence in optical reverberation masses), an independent verification of any – FWHM(H) relationship would be best derived from X-ray variability (Braito & Marziani, in preparation). In the present study, we assume that Eq. 1 describes the appropriate relation.
Differences between the disk + wind model expectation and the linear fit described by Eq. 1 are appreciable for FWHM(H) 1500 km s-1 (Fig. 3). The disk + wind model predicts an average difference of more than one order of magnitude between NLSy1 and other population A sources. The assumption of constant for all population A yields a lower normalized ( 3.2) than the disk + wind fit () (see also §6 for possible interpretations).
4 Why Does Ionization Level Decrease With Increasing L/M?
The ionization parameter can be defined as
| (2) |
where Q(H) is the number of hydrogen ionizing photons and r is the distance of the BLR from the central continuum source. U can be rewritten in terms of L/M and M, if we assume:
-
1.
. A typical AGN continuum as parameterized by Mathews and Ferland (1987) yields Hz and f 0.54.
-
2.
The velocity field for the low ionization line-emitting gas is mainly rotational. We assume that the velocity dispersion is the square root of the mean square velocity for a rotating annulus:
(3) with FWHM(H) = 2.35 .
We also consider that the ratio I(Si III]1892)/I(Ciii]1909) is a good density diagnostic (almost independent of the ionization parameter) in the density range . cloudy (Ferland, 2000) photoionization computations suggest that
| (4) |
Since the ratio I(Si III]1892)/I(Ciii]1909) is directly correlated with FWHM(H) (Wills et al., 1999), adopting the FWHM(H) – L/M correlation yields:
| (5) |
We can use Eq. 5 to write U in terms of Lbol/M:
| (6) |
with , mass in units of 107, and the luminosity-to mass ratio in units of 104 the solar value (L/M 1.9 ergs s-1 g-1). This accounts for the somewhat counterintuitive result that U decreases with decreasing FWHM(H) and increasing L/M. We note that for we get for FWHM(H) 2000 km s-1 as expected. However a shallower dependence may be possible; the L/M power is constrained within 1.1 1.7 for a reasonable choice of the input parameters. For instance, if we use the relationship between luminosity and BLR radius (Kaspi et al., 2000), we would obtain . Values of are a consequence of the assumption of a Keplerian (or virial or similar) velocity field (i.e., v ).
5 Connecting the Observational Plane to L/M and i
The above results allow us to relate L/M to the FWHM(H) – RFeII plane of E1. Determining the relationship between RFeII and U is not trivial since Feiiopt emission is poorly understood. Photoionization calculations suggest a four-fold increase in total Feiiopt emission from to 2. We assume that RFeII scales as total Feiiopt intensity divided by I(H) as a function of U for an average density ne 1010 cm-3. We use the calculations of Korista et al. (1997) to estimate the dependence on U. The normalization has been chosen following Netzer (1990) with RFeII 0.25 for . We note that using the possibly stronger correlation between I(Si III]1892)/I(Ciii]1909) and RFeII (i.e., I(Si III]1892)/I(Ciii]1909) 0.1 + 0.5 RFeII, Wills et al. (1999)) gives a consistent relationship without any assumption about the relationship between U and RFeII. Equating the above relationship involving I(Si III]1892)/I(Ciii]1909) and RFeII to Eq. 4 and using Eq. 5 to relate ne and L/M allows us to obtain RFeII .
If low ionization lines like H are emitted in a flattened configuration, then some effect of viewing angle is expected. In order to take into account the effect of orientation we assume that:
-
1.
the relationships employed above are valid for an average . We write the FWHM(H) dependence on i as
(7) where
(8) -
2.
RFeII depends on i following a law with a ratio RFeII that may change by a factor 1.6 (an amplitude taken from the mean Feiiopt difference between lobe-dominated and core-dominated RL objects).
These assumptions allow us to reproduce the parameter space covered by sources in our samples by assuming in the expression of U, and FWHM(0) = 500 km s-1. Fig. 4 shows a grid of theoretical values superimposed on the data points of Sulentic et al. (2000a). If ( is assumed in Fig. 4), then somewhat larger will result for the same RFeII, yielding however the same qualitative behavior. For instance, for 0.4, 4.5 corresponds to RFeII 1.5.
6 Discussion
Our calculations do not attempt to reproduce the observed point distribution, but only to account for the occupancy of the parameter plane, since instrumental factors and biases affect the distribution. The cluster of points at RFeII0.2, for example, is due to limits on S/N and resolution. Another source of concern involves the role of selection biases in our E1 AGN sample. RQ population A sources are favored by soft X-ray (e.g., Grupe et al. (1999)) and optical color-based (e.g., BG92) selection techniques while RL/RQ population B AGN are not. The latter sources may be seriously under-represented in the RFeII vs. FWHM(H) plane.
On the theoretical side, a distribution of masses will blur the grid, since different masses would deform and displace the grid horizontally. An additional source of scatter may involve Fe abundance. Therefore no rigorous inference can be made about individual values of L/M and i from the Figure 4 grid.
The low RFeII region (RFeII) of Figure 4 suggests that orientation is responsible for some of the population B sources. They would fall in the population A domain if viewed face-on. Towards the middle of Figure 4, we see that decreasing i and increasing L/M apparently have a concomitant effect (decreasing i implies decreasing FWHM(H) and RFeII; increasing L/M implies the same observational trends). This is also true in the domain of NLSy1, which should be an L/M extremum (but not necessarily of i). The concurrent effects of both parameters may explain why the correlations above have been found by a number of workers without any contradictory result. Observational prediction of some wind models are sensitive to both i and L/M, and account for, at least qualitatively, the Civ1549 shift amplitude distribution as considered by Sulentic et al. (2000b).
Radiation pressure driven wind models (Nicastro, 2000; Witt et al., 1997) predict a decrease of with increasing FWHM(H). However, the model by Nicastro (2000) predicts highly super-Eddington accretion for NLSy1. Existing evidence is still sparse, but neither a dynamical mass determination nor X-ray mass estimate supports this prediction. Rather, NLSy1 as the bulk of population A sources, seem constrained within (e.g., Puchnarewicz et al. (2001) constrain for RE J1034+396; a similar result is inferred for Akn 564 (Comastri et al., 2001). Laor (2000a) also infers 0.3 for NLSy1 from X-ray variability. RQ AGN with reverberation mapping mass estimates (excluding NGC 4051 and 4151) of Fig. 3 show that there is no strong discontinuity between NLSy1 and the rest of population A (i.e., sources with 2000 km s-1 FWHM(H) 4000 km s-1). The values become significantly different if population A and population B are compared with a K-S test (the difference is also appreciable in Fig. 3). The K-S test applied to population A (13 sources) and population B (11 sources) yields a probability P1 that the values are drawn from the same parent population.
Most NLSy1 sources radiate at , as do a sizeable fraction of the sources with 2000 km s-1 FWHM(H) 4000 km s-1 supporting the identification of a unique population up to at least FWHM(H) 3500 km s-1. PHL 1092 may be radiating at (IRAS 132243809 may be another case). The extreme location of PHL 1092 in Fig. 1 and in Fig. 3 is consistent with both an exceptionally high value of () and a pole-on orientation (also suggested by the strong X-ray variability (Forster & Halpern, 1996)). Sources like PHL 1092 may therefore be intrinsically rare even if not peculiar in a strict sense.
Recent results suggest a clear dichotomy between RL and RQ AGN in terms of black hole mass with RL AGN having a systematically larger black hole mass (Laor, 2000b). According to our considerations, the optical properties of AGN should be largely transparent to black hole mass differences (with a dependence of U on M yielding a second order effect). However, the probability of having low L/M is obviously favored for large masses. This is in agreement with the upwardly displaced location of RL AGN in the RFeII – FWHM(H) plot with respect to radio quiet AGN. Also, in the idealized case of a sample where L constant, there could be a sequence of increasing mass from NLSy1 to population A and then to population B, with RL AGN hosting the most massive black holes.
6.1 On the Nature of the Outliers
A major difference we are able to identify between MS and outlying BAL QSOs is related to their far IR spectral index () between 25 and 60 m. The index (25,60) is 1.47 and 1.32 for Mrk 231, and 0759+651 respectively. Consistently, from ISO data (Haas et al., 2000), (25,60) 1.13 for PG 0043+039 (PG 1351+236 has been detected only at 60m). In both Fig. 1 and in Fig. 4 all the BAL QSOs known to us from Sulentic et al. (2000a) and Lipari et al. (1993) with W(Civ1549) Å in absorption are reported. The three MS BAL QSOs for which there are reliable IRAS or ISO data (PG 1411+442, PG 1700+518, and PG 1001+054) have (25,60)0.24, 0.56, 0.33 respectively. In the remaining two cases (PG 1004+130 and PG 2112+059) it is not possible to compute the (25,60), but detection at 12m and no detection at 60 m argues against large (25,60).
The most straightforward interpretation of this difference is a continuum steeply rising toward the far IR due to a significant contribution from circum-nuclear star formation in the outlying BAL QSOs (in line with the analysis of Haas et al. (2000) of the far IR spectral shapes of PG quasars). This contribution may not be dominant in the MS BAL QSOs. For both 0759+651 and Mrk 231, several lines of evidence suggest the presence of a strong circumnuclear starburst affecting the integrated broad line spectrum of these AGN (Taylor et al., 1999; Lipari, 1994). If we consider the general population of AGN in a diagram rest-frame W(Feii 4570) vs. W(H), we see that Feiiopt strong quasars (their average is shown in Fig. 1, Lipari et al. (1993)) define a boundary with W(Feii 4570) W(H), while the general population of AGN fills the area with W(Feii 4570) W(H). Mrk 231 and 0759+651 remain outliers: they show W(Feii 4570) significantly larger than that expected from W(H). This may indicate a significant overproduction of Feiiopt due to an additional excitation mechanism (i.e., shocks), possibly associated with strong circumnuclear star formation.
7 Conclusion
Our work (Sulentic et al. (2000a) and references therein) shows that optical Feiiopt emission is a fundamental parameter in AGN correlation studies. This result underlies the need for more sophisticated models for the production of Feiiopt (e.g., Verner et al. (1999)). It also points out the need for much higher S/N spectroscopic observations of many sources with weaker Feiiopt emission in order to clarify the upper left part of E1. In this paper we have attempted to explain, semi-quantitatively but self- consistently, the diversity among RQ AGN. Our attempt has been based upon the assumption that two of their most prominent emission features, H and Feiiopt, are influenced primarily by source orientation and the Eddington ratio. The results have allowed us to reinforce the distinction between two RQ AGN populations and to tentatively identify those AGN that may be peculiar in a statistical and phenomenological sense including some BAL QSOs.
References
- Brandt, Laor, & Wills (2000) Brandt, W. N., Laor, A., & Wills, B. J. 2000, ApJ, 528, 637
- Boller et al. (1996) Boller, T., Brandt, W. N., & Fink, H. 1996, A&A, 305, 53
- BG (92) Boroson, T. A., & Green, R. F. 1992, ApJS, 80, 109 (BG92)
- Brotherton (1996) Brotherton, M. S. 1996, ApJS, 102, 1
- Comastri et al. (2001) Comastri, A., et al. 2001, A&A, 365, 400
- Corbett et al. (2000) Corbett, E. A., Robinson, A., Axon, D. J., & Hough, J. H. 2000, MNRAS, 311, 485
- Corbin (1997) Corbin, M. R. 1997, ApJS, 113, 245
- Czerny et al. (2001) Czerny, B., Piasecki, M., Kuraszkiewicz, J., & Nikolajuk, M. 2001, MNRAS, in press (preprint astro-ph/0009200)
- Dultzin-Hacyan et al. (2000) Dultzin-Hacyan, D., Marziani, P., & Sulentic, J. W. 2000, Revista Mexicana de Astronomia y Astrofisica Conference Series, 9, 308
- Falcke, Wilson, & Simpson (1998) Falcke, H., Wilson, A. S., & Simpson, C. 1998, ApJ, 502, 199
- Ferland (2000) Ferland, G. J. 2000, Rev. Mexicana Astron. Astrofis. Ser. Conf., 9, 153
- Forster & Halpern (1996) Forster, K., & Halpern, J. P. 1996, ApJ, 468, 565
- Gaskell (1985) Gaskell, C. M. 1985, ApJ, 291, 112
- Grupe et al. (1999) Grupe, D., Beuermann, K., Mannheim, K., & Thomas, H. -. C. 1999, A&A, 350, 805
- Grupe (2000) Grupe, D. 2000, New Astronomy Review, 44, 455
- Haas et al. (2000) Haas, M., Müller, S. A. H., Chini, R., Meisenheimer, K., Klaas, U., Lemke, D., Kreysa, E., & Camenzind, M. 2000, A&A, 354, 453
- Kaspi et al. (2000) Kaspi, S., Smith, P. S., Netzer, H., Maoz, D., Jannuzi, B. T., & Giveon, U. 2000, ApJ, 533, 631
- Korista et al. (1997) Korista, K., Baldwin, J., Ferland, G., & Verner, D. 1997, ApJS, 108, 401
- Laor (2000a) Laor, A. 2000, ApJ, 543, L111
- Laor (2000b) Laor, A. 2000, New Astronomy Review, 44, 503
- Laor et al. (1995) Laor, A., Bahcall, J. N., Jannuzi, B. T., Schneider, D. P., & Green, R. F. 1995, ApJS, 99, 1
- Laor et al. (1994) Laor, A., Bahcall, J. N., Jannuzi, B. T., Schneider, D. P., Green, R. F., & Hartig, G. F. 1994, ApJ, 420, 110
- Lipari (1994) Lipari, S. 1994, ApJ, 436, 102
- Lipari et al. (1993) Lipari, S., Terlevich, R., & Macchetto, F. 1993, ApJ, 406, 451
- Marziani et al. (1996) Marziani, P., Sulentic, J. W., Dultzin-Hacyan, D., Calvani, M., & Moles, M. 1996, ApJS, 104, 37
- Mathews and Ferland (1987) Mathews, W. G., & Ferland, G. J. 1987, ApJ, 323, 456
- Netzer (1990) Netzer, H., 1990, in Blandford, R. D., Netzer, H., Woltjer, L., Courvoisier, T. J., & Mayor, M. 1990, Saas-Fee Advanced Course 20. Lecture Notes 1990. Swiss Society for Astrophysics and Astronomy, XII, p. 57 (Springer-Verlag Berlin Heidelberg New York)
- Nicastro (2000) Nicastro, F. 2000, ApJ, 530, L65
- Pounds et al. (1995) Pounds, K. A., Done, C., & Osborne, J. P. 1995, MNRAS, 277, L5
- Press, Teukolsky, Vetterling, & Flannery (1992) Press, W. H., Teukolsky, S. A., Vetterling, W. T., & Flannery, B. P. 1992, Cambridge: University Press, 2nd ed., p. 694
- Puchnarewicz et al. (2001) Puchnarewicz, E.M., Mason, K.O., Siemiginowska, A., Fruscione, A., Comastri, A., Fiore, F., & Cagnoni, I., 2001, ApJ, accepted (astro-ph/0011389)
- Rodriguez-Pascual et al. (1997) Rodriguez-Pascual, P. M., Mas-Hesse, J. M., & Santos-Lleo, M. 1997, A&A, 327, 72
- Sulentic et al. (2000a) Sulentic, J. W., Marziani, P. and Dultzin-Hacyan, D. 2000a, ARA&A, 38, 521
- Sulentic et al. (2000b) Sulentic, J. W., Zwitter, T., Marziani, P., & Dultzin-Hacyan, D. 2000b, ApJ, 536, L5
- Sulentic et al. (2000c) Sulentic, J. W., Marziani, P., Zwitter, T., Dultzin-Hacyan, D., & Calvani, M. 2000c, ApJ, 545, L15
- Taylor et al. (1999) Taylor, G. B., Silver, C. S., Ulvestad, J. S., & Carilli, C. L. 1999, ApJ, 519, 185
- Ulrich, Maraschi & Urry (1997) Ulrich, M., Maraschi, L., & Urry, C. M. 1997, ARA&A, 35, 445
- Verner et al. (1999) Verner, E. M., Verner, D. A., Korista, K. T., Ferguson, J. W., Hamann, F., & Ferland, G. J. 1999, ApJS, 120, 101
- Wills et al. (1999) Wills, B. J., Laor, A., Brotherton, M. S., Wills, D., Wilkes, B. J., Ferland, G. J., & Shang, Z. 1999, ApJ, 515, L53
- Witt et al. (1997) Witt, H. J., Czerny, B., & Solarzycki, P. T. 1997, MNRAS, 286, 848


| W(H) | W(Feii 4570) | RFeII | I(Si III]1892)/I(Ciii]1909) | W(Civ1549) | |
|---|---|---|---|---|---|
| [Å] | [Å] | [Å] | |||
| NLSy1 | 7228 | 5417 | 0.80.3 | 0.530.16 | 4119 |
| Pop A | 9539 | 6016 | 0.50.3 | 0.430.19 | 5025 |
| Pop B | 10434 | 3117 | 0.30.1 | 0.230.11 | 10785 |