Evidence for a Circumnuclear Disk in 1946+708
Abstract
A number of extragalactic radio sources which exhibit symmetric jets on parsec scales have now been found to have neutral hydrogen absorption at or near the systemic velocities of their host galaxies. Understanding the spatial distribution and kinematics of the Hi detected toward the central parsecs of these sources provides an important test of unified schemes for AGN.
We present results of Global VLBI Network observations of the redshifted 21 cm Hi line toward the Compact Symmetric Object 1946+708 (=0.101). We find significant structure in the gas on parsec scales. The peak column density of the Hi (N31023 cm-2() ) occurs near the center of activity of the source, as does the highest velocity dispersion (FWHM 350 to 400 km s-1). There is also good evidence for a torus of ionized gas with column density 7 1022 cm-2. The jets in 1946+708 exhibit bi-directional motion measurable on timescales of a few years. The resulting unique information about the geometry of the continuum source greatly assists in the interpretation of the gas distribution, which is strongly suggestive of a circumnuclear torus of neutral atomic and ionized material with one or more additional compact clumps of gas along the line of sight to the approaching jet.
1 Introduction
Compact Symmetric Sources (CSOs) are a recently identified class of radio sources which are less than 1 kpc in size, and are thought to be very young objects (104 yr, Readhead et al. 1996; Owsianik & Conway 1998). CSOs exhibit milliarcsecond scale jets marked by steep spectrum hotspots (Taylor et al. 1996). The jets are oriented at large angles to the line of sight, resulting in very little Doppler boosting of the approaching jet (Wilkinson et al. 1994). This means that the receding jet may be responsible for up to half of the observed radio continuum flux density, and thus an obscuring torus, such as that predicted by unified schemes of AGN, (see e.g. Antonucci 1993), should be detectable in absorption toward the core and one or both hotspots.
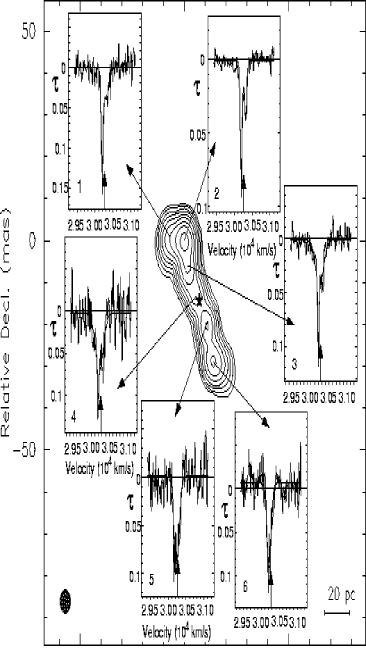
This class of sources is unique among radio galaxies in that 50% of CSOs searched thus far have detectable Hi absorption (0.01; Vermeulen 2001, Peck et al. 2000) toward the core. We present extremely high spatial resolution observations of the Hi absorption in the CSO 1946+708. The radio axis in this source is thought to be oriented between 65 and 80∘ to the line of sight, based on VLBI radio continuum studies of the proper motions in the jet components (Taylor & Vermeulen 1997). This source exhibits an “S” shaped symmetry, shown by the contours in Fig. 1. The location of the radio core is indicated with an asterisk. The northern hotspot (NHS) is located in the approaching jet, while the end of the receding jet is marked by a southern hotspot (SHS).
2 Observations and Analysis
The observations were made on 1999 23 February using 13 antennas of the Global VLBI Network (8 stations of the NRAO111The National Radio Astronomy Observatory is a facility of the National Science Foundation operated under a cooperative agreement by Associated Universities, Inc. Very Long Baseline Array (VLBA), the 27 element NRAO Very Large Array (VLA) in phased-array mode, the NRAO Greenbank 140 ft telescope, the Effelsberg 100m telescope, the Westerbork tied-array, and the Onsala 25m telescope) with 2 bit sampling. A single IF with a bandwidth of 8 MHz was observed in 256 channels, resulting in a frequency resolution of 31.25 kHz. Following bandpass correction performed using 3C345 and 2344+8226, Doppler correction was applied using the AIPS task CVEL. At this point it was found that the central frequency of the line does not match that shown in the VLBA observations of 1995 (Peck, Taylor and Conway 1999, hereafter referred to as PTC99) due to an error in the application of CVEL in the earlier data set. The central velocity is actually 220 km s-1 higher than that indicated in PTC99. The correct velocity is closer to the optical systemic velocity of the host galaxy, and thus still consistent with the model presented in PTC99.
3 Results
3.1 Radio Continuum
The radio structure of 1946+708 has been previously reported on by Taylor & Vermeulen (1997), and by PTC99. The angular resolution of Fig. 1 is 4.9 4.3 mas, or about 50% better than that obtained by PTC99 at the same frequency. At 5 mas resolution the core component, located midway between the hot spots, is still blended with the inner jet components (identified as N5 and S5 in Taylor and Vermeulen 1997) and the smooth underlying jet. The brightest feature in Fig. 1 is the NHS, but it is only a few times brighter than the SHS or the string of jet components in between. Faint and symmetric extensions are seen to emerge from the hotspots, but they fade rapidly into the noise.
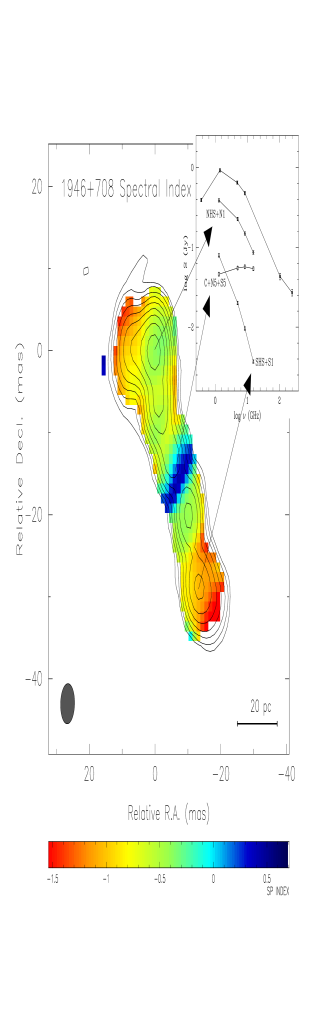
We have obtained observations of 1946+708 at 5 GHz from the Caltech-Jodrell Bank survey program (CJF – Taylor et al. 1996) session on February 8, 1998. The 5 GHz data were tapered and then restored with the same beam as the 1.29 GHz image in order to produce the spectral index image shown in Fig. 2. This image is comparable with that produced by PTC99, but our enhanced resolution reveals a dramatic spectral turnover close to the center of activity. In fact the most strongly inverted region is about a fourth of a beam southwest of the core component. This region runs perpendicular to the radio jet axis. Since the jet has a deconvolved width of just 0.5 mas at 5 GHz, it is difficult to assess the significance of features transverse to the jet, but we suspect that there is sufficient SNR at the edges of the jet ( 4:1) to support the claim that the region of the low frequency spectral turnover extends across the jet.
3.2 Hi Absorption
Neutral hydrogen absorption is present toward all of the radio components in the Compact Symmetric Object 1946+708. The profiles shown in Fig. 1 are integrated over 33 pixels, an area slightly smaller than the synthesized beam, toward the peak of each continuum component identified in Taylor & Vermeulen (1997). The smooth line in each panel indicates a multicomponent Gaussian fit to the data. In panels 1 through 4, two Gaussian components were used, while in panels 5 & 6, only one was used. The parameters derived from the Gaussian fits to the profiles are shown in Table 1. The optical depth has been estimated using Ts=8000 K, as described in PTC99. The systemic velocity obtained from optical observations of both emission and stellar absorption lines (Stickel & Kühr 1993) is 30279300 km s-1. Thus all of the Hi absorption features reported here are at the systemic velocity to within the uncertainty of the optical measurements.
A broad component is seen in all 6 profiles. This broad line varies significantly in width across the source, with the broadest region appearing near the center of activity of the source (profile 4). The narrowest region in the broad line occurs toward the continuum peak seen in profile 2. Although the line appears broad toward the northeastern extremity of the jet in profile 1, is seems likely that this is due to lower signal to noise in this region. This profile lacks the bluer wing seen in the other broad profiles, suggesting that, although the gap between the broad and narrow line is not apparent, the profile is more similar to that seen in profile 2 than to profiles 3 through 6. The opacity does not vary much, but increases gradually toward the receding jet, while the column density peaks near the core.
A deep narrow line is distinguishable from the broad component in profiles 1 through 4. This line appears to be present toward profiles 5 & 6 as well, but the higher optical depth of the broad line in this region makes it impossible to fit with a separate Gaussian component. The line has a FWHM linewidth of only 3570 km s-1 and does not vary much in central velocity. These fits are shown as the (b) components in the first four profiles in Table 1.
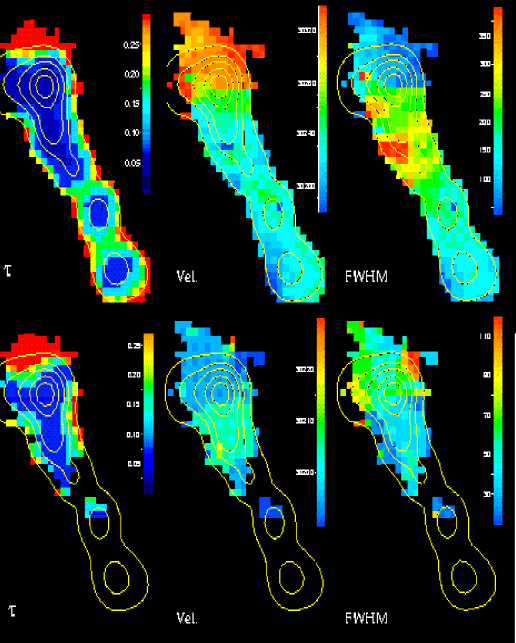
In addition to fitting Gaussian functions to the integrated Hi absorption profiles shown above, fits have also been made at each pixel across the source. The top row of plots in Fig. 3 contains the parameters obtained from fits to the broader line. Pixels with a peak signal to noise ratio less than 2 have been blanked. The broad absorption occurs toward the entire continuum source, as seen in the optical depth () distribution shown in the first panel. The second panel shows the velocity field, with centroids ranging from 30190 to 30340 km s-1. The linewidth distribution shown in the third panel indicates a dramatic increase in velocity dispersion just to the northeast of the core, where the FWHM is 300 km s-1. The second row of plots shows the narrower line, which is only distinguishable from the broad line over part of the source. In this component, little variation in , velocity centroid or FWHM is seen.
4 Discussion
4.1 Evidence for an atomic torus
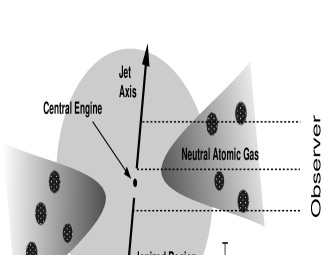
The Hi absorption in 1946+708 consists of a very broad line and a lower velocity narrow line which are visible toward the entire 100 pc of the continuum source. The broad line has low optical depth and peaks in column density near the core of the source. This is consistent with a thick torus scenario in which gas closer to the central engine is much hotter, both in terms of kinetic temperature and spin temperature, so a longer path-length through the torus toward the core would not necessarily result in a higher optical depth. The gas toward the core, however, would be rotating much more quickly around the central massive object, and thus would have a higher velocity dispersion and column density. Given the known orientation of the radio axis, close to the plane of the sky with the northern jet on the approaching side, we would expect the broadest linewidths to appear in projection just south of the core of the source. The offset to the north shown in Fig. 3 (panel 3) might indicate that the inner part of the atomic torus is inclined by 20-30∘ from perpendicular to the radio axis. A schematic of this scenario is shown in Fig. 4. Lu (1990) has suggested that an “S” shaped symmetry in radio jets might be due to precession caused by an offset accretion disk, making this scenario consistent with the observed morphology of the radio continuum source.
The narrow line has a higher optical depth, and does not vary much across the source. The most likely explanation for this narrow line is that it arises from gas further out in the torus, perhaps an extended region of higher density gas on the order of at least 80-100 pc in diameter. This cloud would have a higher optical depth than much of the torus, occurring in a region where the shielding from the central x-ray source is greater and thus Ts lower, and it would also have a narrower linewidth, given that we would be seeing a much smaller section of the annulus of rotating material at that radius. The FWHM of much of the gas in the narrow line is still significantly greater than that seen toward the center of our own Galaxy (20 km s-1; van der Hulst et al. 1983) and so it seems unlikely that it is simply a cloud in the host galaxy which happens to lie on the line of sight to the central radio source. The slightly higher velocity centroid of the broad line might be due to an inward streaming motion of the gas in this region of the torus, or might be indicative of a contribution from gravitational redshift if the gas is within a few pc of a central object loosely estimated to have a mass of 5108M⊙ (PTC99).
So far, no molecular gas has been detected in this source. Observations at the frequency of the redshifted OH line have yielded an upper limit of 0.006 (PTC99).
4.2 Evidence for a torus of ionized gas
The low frequency spectral turnover near the core presented in §3 (see Fig. 2) could be the result of either synchrotron self-absorption (SSA) of the emitting components, or free-free absorption by a foreground disk of ionized gas. In the case of SSA we expect the frequency at which the turnover occurs to be related to the angular size and flux density of the components. Based on a flux density of 250 mJy, size of 0.8 mas measured at 5 GHz, and assuming equipartition (Scott & Readhead 1977), we derive a spectral turnover for the NHS at an observed frequency of 1.3 GHz. This is roughly consistent with the spectrum presented in PTC99, although the peak frequency is poorly constrained since the spectrum of the NHS has not been measured below 1.3 GHz. For the weaker jet components of similar angular size, the peak frequency should be well below 1 GHz. For the inner jet components this poses a problem for the SSA model, and requires significant departures from equipartition conditions.
A more likely explanation for the spectral turnover is that it is produced by free-free absorption from the ionized innermost region of the circumnuclear torus. This explanation was also explored by PTC99, as shown in Fig. 8 of that paper. The new observations reveal that the opacity of the ionized gas reaches 2.2 toward the core. This is larger than the estimate of PTC99 of 0.4 owing to the higher resolution afforded by the new observations which reduce blending of the absorbed region with the unabsorbed steep spectrum jet on either side. The assumptions used in PTC99 (temperature 8000 K and a path length of 50 pc) now imply a column density of 6.9 1022 cm-2 and a density of 460 cm-3 for the ionized material. The peak in the column density of ionized gas is not spatially coincident with the peak velocity dispersion in the Hi gas, indicating that the longest pathlength through the ionized region is not precisely toward the innermost radius of the atomic torus, as shown in Fig. 4. This is consistent with model outlined in PTC99, and with the expected ionization fraction of only 1-10% in the atomic torus (Neufeld & Maloney 1995).
A similar case for a disk of free-free absorbing material has been made for the CSO 0108+388 (Marr, Taylor and Crawford 2000). A problem for both the free-free absorption and the SSA models is that the turnover in 1946+708 appears so broad (Fig. 2 inset). This is probably the result of blending of components with different spectra within the synthesized beam, or a non-uniform opacity in the torus.
5 Conclusion
The high velocity dispersion toward the core of 1946+708 is indicative of fast moving circumnuclear gas, perhaps in a rotating toroidal structure. Further evidence for this region of high kinetic energy and column density is found in the spectral index distribution which indicates a region of free-free absorption along the line of sight toward the core and inner receding jet. The Hi optical depth increases gradually toward the receding jet. The most likely scenario to explain these phenomena consists of an ionized region around the central engine, as well as an accretion disk or torus, with a scale height of 10 pc at the inner radius and at least 80 pc at the outer radius, which is comprised primarily of atomic gas.
References
- (1) Antonucci, R. 1993, ARA&A, 31, 473
- (2)
- (3) van der Hulst, J. M., Grolisch, W. F. & Haschick, A. D 1983, ApJ, 264, L37
- (4)
- (5) Lu, J. F. 1990, A&A, 229, 424
- (6)
- (7) Marr, J. M., Taylor, G. B. and Crawford, F. 2000, ApJ, in press
- (8)
- (9) Neufeld, D. A. & Maloney, P. R. 1995, ApJ, 447, L17
- (10)
- (11) Owsianik, I. & Conway, J. E. 1998, AA, 337, 690
- (12)
- (13) Peck, A. B., Taylor, G. B., Fassnacht, C. D., Readhead, A. C. S. and Vermeulen, R. C. 2000, ApJ, 534, 104
- (14)
- (15) Peck, A. B., Taylor, G. B. & Conway, J. E. (PTC99) 1999, ApJ, 521, 103
- (16)
- (17) Readhead, A. C. S., Taylor, G. B, Xu, W., Pearson, T. J., Wilkinson, P. N. & Polatidis, A. G. 1996, ApJ, 460, 612
- (18)
- (19) Scott, M. A. & Readhead, A. C. S 1977, MNRAS, 180, 539
- (20)
- (21) Stickel, M. and Kühr, M. 1993, A&AS, 100, 395
- (22)
- (23) Taylor, G. B., & Vermeulen, R. C. 1997, ApJ, 485, L9
- (24)
- (25) Taylor, G. B., Readhead, A. C. S., & Pearson, T. J. 1996, ApJ, 463, 95
- (26)
- (27) Vermeulen, R. C. 2001, to appear in The Universe at Low Radio Frequencies, IAU Symposium 199, ASP Conference Series, eds. V.K. Kapahi & A.P. Rao, astro-ph/0012352
- (28)
- (29) Wilkinson, P. N., Polatidis, A. G., Readhead, A. C. S., Xu, W. & Pearson, T. J. 1994, ApJ, 432, L87
- (30)
| Amplitude | Central Velocity | FWHM | NHIaaAssuming a spin temperature of 8000 K and a covering factor of 1. | |||
| Profile | Component | (mJy) | (km s-1) | (km s-1) | (1022 cm-2) | |
| 1 | a | 3.90.4 | 3031515 | 16633 | 0.040.011 | 9.7 |
| b | 10.40.7 | 301951.9 | 69.05.3 | 0.120.017 | 12.0 | |
| 2 | a | 11.50.6 | 303182.1 | 84.95.4 | 0.040.005 | 5.0 |
| b | 23.80.6 | 301980.9 | 63.12.2 | 0.080.008 | 7.4 | |
| 3 | a | 5.90.4 | 302375.8 | 25615 | 0.040.005 | 14.9 |
| b | 10.50.7 | 302061.2 | 35.93.1 | 0.070.008 | 3.7 | |
| 4 | a | 3.20.3 | 302329.9 | 26425 | 0.070.007 | 29.6 |
| b | 3.00.7 | 301923.6 | 34.59.5 | 0.060.026 | 3.0 | |
| 5 | a | 5.50.3 | 302345.0 | 18112 | 0.090.010 | 23.8 |
| 6 | a | 5.40.3 | 302173.5 | 1368.7 | 0.100.011 | 19.8 |