An XMM-Newton observation of the luminous Seyfert 1 galaxy Markarian 509
Abstract
We present the spectral analysis of an early XMM-Newton observation of the luminous Seyfert 1 galaxy Mkn 509. We find the hard (2–10 keV) continuum slope, including reflection, to be somewhat flatter () than for a typical BLS1. The most obvious feature in the hard X-ray spectrum is a narrow emission line near 6.4 keV, with an equivalent width of 50 eV. The energy and strength of this line is consistent with fluorescence from ‘neutral’ iron in the molecular torus, and we note the emerging ubiquity of this feature in XMM-Newton and Chandra observations of Seyfert 1 galaxies over a wide luminosity range. We also find evidence for a second emission line at 6.7–6.9 keV, which we attempt to model by reflection from a highly ionised disc. A ‘soft excess’, evident as an upward curvature in the continuum flux below 1.5 keV, cannot be explained solely by enhanced reflection from the ionised disc. The RGS spectrum shows only weak discrete emission and absorption features in the soft X-ray spectrum, supporting our conclusion that the soft excess emission in Mkn 509 represents the high energy portion of optically thick, thermal emission from the inner accretion disc.
1 Introduction
In the standard paradigm the primary luminosity of an AGN originates in an accretion disc around a super-massive black hole. In the X-ray band, a hard power-law component generally dominates above 2 keV in the well-studied Seyfert 1 galaxies and is believed to arise in a hot corona above the surface of the accretion disc, where optical/UV photons from the disc are Comptonised to X-ray energies. These X-rays in turn illuminate the disc, being either ‘reflected’ towards the observer or thermalised back into optical/UV emission (Mushotzky et al. 1993). In the X-ray spectral band, evidence for this disc reflection component may be seen in the form of a broad fluorescent Fe K line near 6.4 keV, an Fe K edge at keV and a Compton ‘hump’ at keV . All these features have been observed in bright Seyfert 1 galaxies (e.g. Pounds et al. 1990, Nandra & Pounds 1994). The improved resolution of ASCA showed the Fe K line was often broad with excess flux, particularly in a ‘red’ wing to the line, explained by emission from the inner disc in a region of both high velocities and high gravity (Tanaka et al. 1995, Nandra et al. 1997a).
The substantial gains in sensitivity, bandwidth and spectral resolution of XMM-Newton and Chandra are now beginning to further qualify this standard picture, with indications that the energy, breadth and strength of the broad Fe K line (the inner disc component) is a function of the luminosity and hardness of the X-ray continuum emission. Also, there is growing evidence for a narrow emission line at 6.4 keV having a distinct origin, away from the inner disc (e.g., Reeves et al. 2001, Yaqoob et al. 2001, Kaspi et al. 2001).
In this paper we report on the XMM-Newton observation of Mkn 509, the most luminous, hard spectrum Seyfert 1 galaxy observed in the early phase of the mission. At , Mkn 509 has a typical X-ray luminosity (2–10 keV) of erg s-1. The Galactic absorption column towards Mkn 509 is cm-2 (Murphy et al. 1996), rendering it easily visible over the whole (0.25–10 keV) spectral band of the EPIC detectors on XMM-Newton. First detected by Ariel V (Cooke et al. 1978), an EXOSAT observation showed the X-ray spectrum of Mkn 509 to be described by a power-law of index and a ‘soft excess’ of eV (Singh et al. 1989). Ginga observations in 1988 showed the 2–20 keV spectrum could be fitted by a power-law of index of (steepening with increasing intensity), a variable soft excess with a relatively high (black body) temperature of eV, and a weak emission line near 6 keV (Singh et al. 1990). During a simultaneous Ginga and ROSAT observation in 1990, Mkn 509 was seen at a ‘typical’ 2–10 keV flux of ergs cm-2 s-1, the (at that time) uniquely large bandwidth (0.15–15 keV) yielding a complex continuum fit, of a power-law of index of , with some flattening at higher energies due to reflection, a soft excess modelled by a black body of eV, and an ‘emission line’ near 1 keV, possibly from Fe L (Pounds et al. 1994, see also Turner et al. 1991). The total of 4 Ginga observations of Mkn 509 also provided evidence for a weak Fe K emission line at 6.55 keV (Nandra & Pounds 1994).
Fitting a narrow line to the 1994 ASCA observation refined the peak energy to keV, with an EW of 70 eV, increasing to 200 eV for a broad line fit (Nandra et al. 1997a). Interestingly, the ASCA spectral fit for Mkn 509 indicated the presence of a warm absorber rather than a ‘soft excess’ (Reynolds 1997, George et al. 1998).
2 Observations and Data reduction
Mkn 509 was observed on 2000 October 25 during orbit 161 of the PV phase of XMM-Newton. The observations with the EPIC MOS (Turner et al. 2001) and PN (Strüder et al. 2001) detectors were of 25 ksec and 27 ksec duration, respectively, all in Small Window mode. The simultaneous RGS observation lasted 30 ksec. The EPIC data were screened with the XMM SAS (Science Analysis Software) and pre-processed using the CCD gain values for the time of the observation. X-ray events corresponding to patterns 0–12 for the 2 MOS cameras (similar to grades 0,2,3,4 in ASCA) were used; for the PN, only pattern 0 events (single pixel events) were selected. A low energy cut of 200 eV was applied to the data and known hot or bad pixels were removed during screening. The non-X-ray background remained low throughout the observation.
We initially extracted source and background spectra for the PN and both MOS detectors separately. In each case a circular source region of 45′′ radius was defined around the centroid position of Mkn 509 with the background being taken from an offset position close to the source. As there was little variability of Mkn 509 (10%) during the observations and no significant difference between the MOS 1 and MOS 2 spectra, we combined these into a single spectral file to maximise signal-to-noise. The integrated X-ray flux from Mkn 509 over the 0.5–10 keV range, was ergs cm-2 s-1. At this flux level, the effect of photon pile-up in Small Window mode is negligible. The background-subtracted spectra for the PN and combined MOS detectors were then fitted, using xspec v11.0, with the latest response matrices produced by the EPIC team; the systematic level of uncertainty is %. Finally spectra were binned to a minimum of 20 counts per bin, to facilitate use of the minimisation technique. In the spectral analysis described in the following section, values of km s-1 Mpc-1 and are assumed and all fit parameters are given in the AGN rest-frame. Errors are quoted at the 90% confidence level (e.g. for one interesting parameter).
3 Spectral Analysis
3.1 Fe K emission
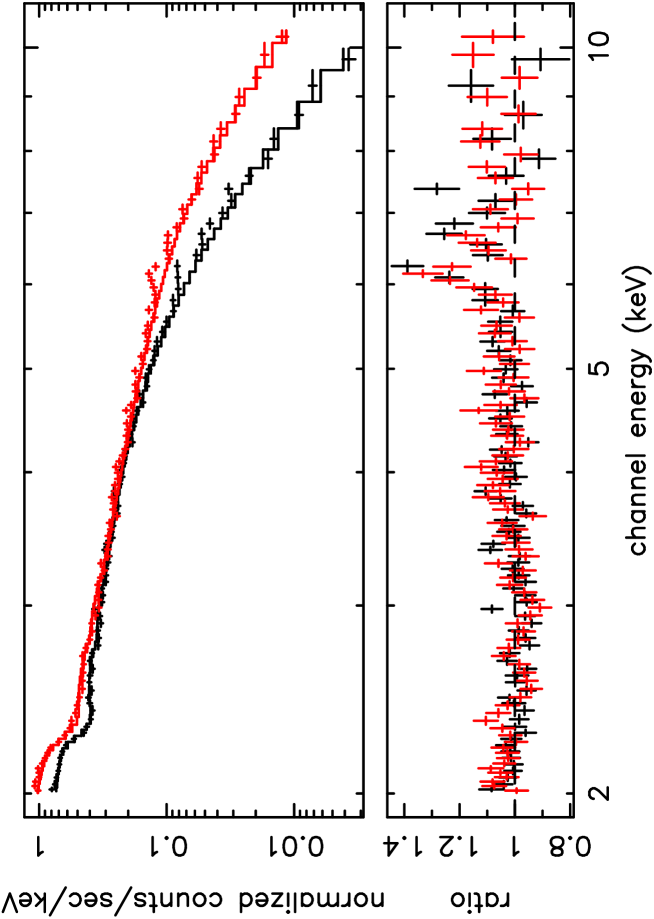
We initially fitted the hard X-ray (2–10 keV) spectrum of Mkn 509 for the PN and MOS data separately, with a power law and neutral absorption corresponding to the line-of-sight Galactic column of . For the PN data the best-fit power-law index of showed significant excess flux between 6–7 keV suggestive of iron K-shell emission. Very similar residuals were found from a fit to the MOS data, albeit with a slightly flatter power law index of . Figure 1 shows the ratio of measured flux to best-fit power law for both detector systems, with evidence for a narrow emission line near 6.4 keV and additional emission to the ‘blue’ side. We then proceeded to fit the MOS and PN data simultaneously, but allowing for a small normalisation difference. The power law indices were left free. The sequence of fits to the combined EPIC data for the 2–10 keV band are summarised in Table 1.
The initial comparison of the combined data set with a power law plus Galactic absorption gave an unacceptable fit (fit 1 in table 1), mainly due to excess measured flux in the 6–7 keV region. The addition of a Gaussian emission line, with energy and width free, produced a significantly improved fit ( for 3 additional parameters; fit 2 in table 1). The line appears marginally resolved (with intrinsic width eV), has an EW of 82 eV and lies at keV, in close agreement with the narrow line fit to the ASCA data. We note this rest energy is consistent with fluorescence from neutral iron. The addition of a second narrow Gaussian emission line gave a further improvement ( for 3 extra parameters), with the overall fit-statistic now (fit 3 in table 1). This second emission line is less well determined, but clearly lies to the high energy side of the first line, with a best-fit energy of keV and EW 44 eV. Inclusion of the 2 Gaussian lines in the fit increased the power law index by 0.03, to a value consistent with the directly measured index from 2–5 keV.
3.2 The Soft Excess
Extrapolating the best-fit 2–10 keV spectrum (fit 3 in table 1) to the lower useful limit of EPIC ( 0.25 keV) revealed a clear excess of soft X-ray flux below keV (figure 2). Modelling this ‘soft excess’ with a second power law, or a single black body, gave a poor fit, the breadth of the soft excess requiring 3 black-body components to approach a minimum value of chi-squared. Table 2 (line 2) details this best-fit to the overall (0.25–10 keV) spectrum. Parameterised in this way, the multiple BB components account for 40% of the de-reddened luminosity of Mkn 509 of erg s-1 between 0.25–2 keV, but a negligible fraction of the harder (2–10 keV) luminosity of erg s-1.
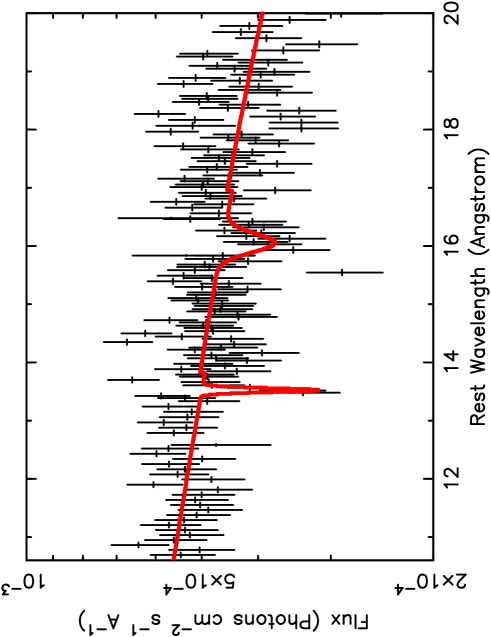
The RGS spectrum showed no strong features between 6–38 Å(0.3–2 keV), other than the absorption edge of neutral interstellar oxygen at 23.3 Å(0.53 keV), supporting the EPIC modelling of the soft excess in terms of thermal continuum emission. However, detailed examination did reveal a weak absorption trough centred at 16.1 Å, and an unresolved absorption line at Å, which we tentatively identify with a blend of Ne IX and Fe XIX (Figure 3a). Both features are weak, with equivalent widths of eV and eV, respectively. Although the long wavelength ‘edge’ of the ‘trough’, at Å, is close to the K-edge of OVII (16.8Å), the shape is unlike that of continuum absorption and we favour identification with absorption via an unresolved transition array (mainly 2p–3d transitions) in Fe M-shell ions, as found in the RGS spectrum of the infrared-loud quasar IRAS 13349+2438 (Sako et al. 2001; see also Chenais-Popovic et al. 2000).
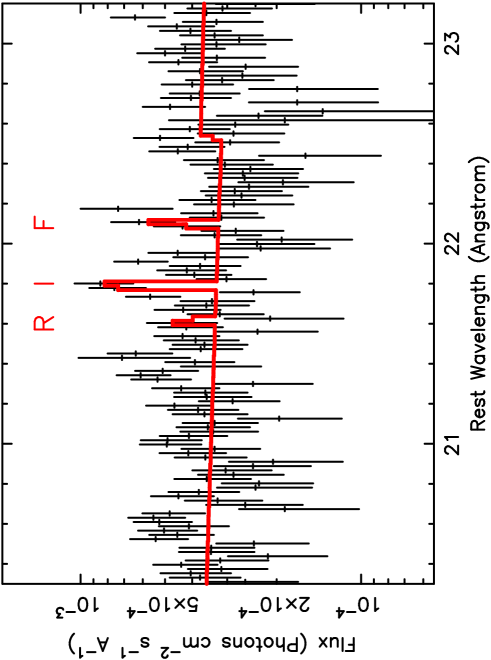
The only emission features we find are consistent with the triplet of helium-like OVII (see Figure 3b). The equivalent widths of the individual components are eV (R), eV (I) and eV (F). The relative weakness of the resonance line is consistent with emission from a photo-ionised gas, a point we take up again in section 5. For now, we reiterate our main finding, that the high resolution RGS spectrum supports the EPIC modelling of the soft excess of Mkn 509 in terms of thermal continuum emission.
4 Modelling the Spectrum
The XMM-Newton spectrum of Mkn 509 is strikingly similar to that of the low luminosity quasar, Mkn 205 (Reeves et al. 2001), with the main spectral features in common being: a narrow Fe K line at 6.4 keV, additional emission centred at 6.7–6.9 keV, and a moderately strong, featureless soft excess below 2 keV. On a more detailed comparison, the underlying power law in Mkn 509 is only slightly harder (0.1 in index), and the soft excess is very similar (measured by the ratio of BB to PL flux at 0.25–2 keV: 0.7 in Mkn 509 and 0.6 in Mkn 205).
In order to test our parameterisation of the Mkn 509 spectrum against a physical model, we have compared our XMM-Newton data for Mkn 509, and for the similar case of Mkn 205, with a model including the effects of X-ray reflection from an ionised disc. Since the narrow line at 6.4 keV is believed to be unrelated to the disc emission it is excluded from the modelling. The model used here will be described in detail in Nayakshin et al (2001, in preparation), and here we only summarise it. The approach is similar to the one used for stellar spectra. Specifically, a large number of models are computed for a range of values of the spectral index, the incident X-ray flux, disc gravity, the thermal disc flux and iron abundance. The output of each model is an un-smeared reflected spectrum for 5 different inclination angles ranging from nearly pole-on to nearly face on, stored in a look-up table. The ‘lamppost’ geometry is then assumed, with free parameters of the model being the height of the X-ray source above the disc, , the dimensionless accretion rate through the disc, , the luminosity of the X-ray source, , the inner and outer disc radii, and the spectral index. This defines the gravity parameter, the ratio of X-ray to thermal fluxes, etc., for each radius, which enables the look-up table to be used to approximate the reflected spectrum. This procedure is repeated for about 30 different radii. The total disc spectrum is then obtained by integrating over the disc surface, including relativistic smearing of the spectrum for a non-rotating black hole (e.g., Fabian et al. 1989).
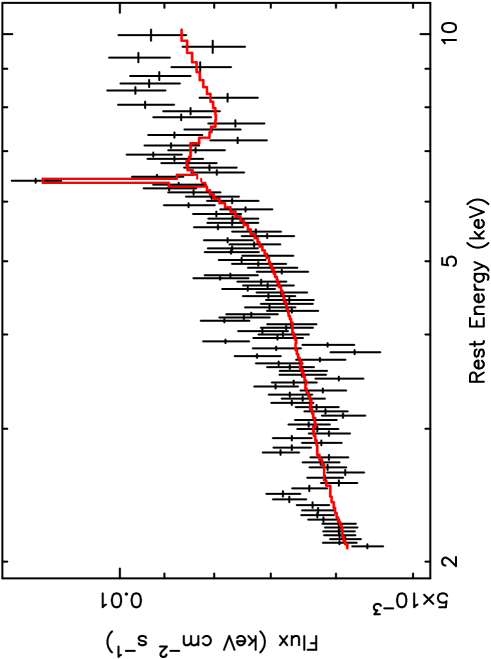
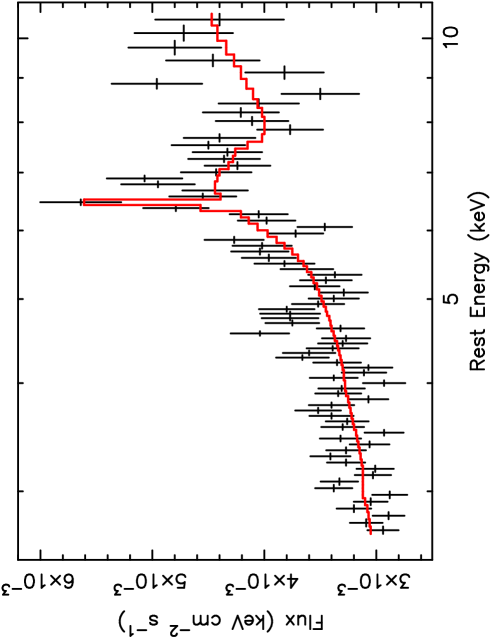
In using this model, the XMM-Newton data were first fitted between 2–10 keV, excluding the narrow 6.4 keV line, and freezing at . Good fits were obtained for both Mkn 509 (fit 4 in table 1) and Mkn 205, with the Fe K feature being identified with predominantly helium-like Fe, emitted at 6.7 keV, and observed at an inclination of 30 degrees. Figure 4 illustrates how the model is constrained by the overall profile, as well as the energy and strength of the line. We note in passing that the underlying power-law index is now 0.1 higher as the fit also models the flattening due to continuum reflection at high energies. The ‘red wing’ of the 6.7 keV line constrains the inner disc radius for Mkn 509 to be . While not tightly constrained, the remaining parameters in the ionised disc model fit for Mkn 509 are interesting, with a best fit for 1 and an accretion rate (where corresponds to the Eddington limit).
It is important to note, however, that the spectral table employed in the fits assumed that the power-law continuum extends out to keV, whereas a recent BeppoSAX observation of Mkn 509 has suggested that the high energy spectrum is modified by an approximately exponential roll-over at keV (Perola et al. 2000). If confirmed, this would be significant for our present fits since, for hard X-ray spectra such as Mkn 509, determines the Compton temperature of the gas, and consequently the ionisation state of the reflector (see the appendix and figures in Nayakshin & Kazanas 2001a). To test this we re-ran the code of Nayakshin et al. (2000) with the best fit parameters described above, but with a cutoff energy of keV. We indeed found that this led to a substantially cooler temperature and a higher fraction of He-like iron in the skin. The latter then produced a much stronger He-like line than required by our data (300 eV). To recover the ionization state of the skin to the degree corresponding to our keV fit, we needed to increase to a value much higher than unity. This contrasts sharply with a deduction from the SED of Mkn 509 which suggests that is much smaller than unity (see Walter & Fink 1993). In addition, Kriss et al. (2000) find that the ionising UV luminosity of Mkn 509 is erg s-1, while its 2-10 keV luminosity is . Clearly, for the condition (required by our photo-ionisation model) to be consistent with the observed luminosity ratio, we need to invoke a geometry of the X-ray source different from the ‘lamppost’. An origin of the hard X-ray emission in magnetic flares above the disc is an attractive possibility, since in that case only a small fraction of the disc is illuminated by the flare and hence the local ionising flux is much larger than (for estimates see Nayakshin & Kazanas 2001b). In addition, the hard X-ray spectrum of Mkn 509 puts constraints on the amount of cooling due to reprocessed radiation, again requiring a patchy corona (Haardt, Maraschi & Ghisellini 1994).
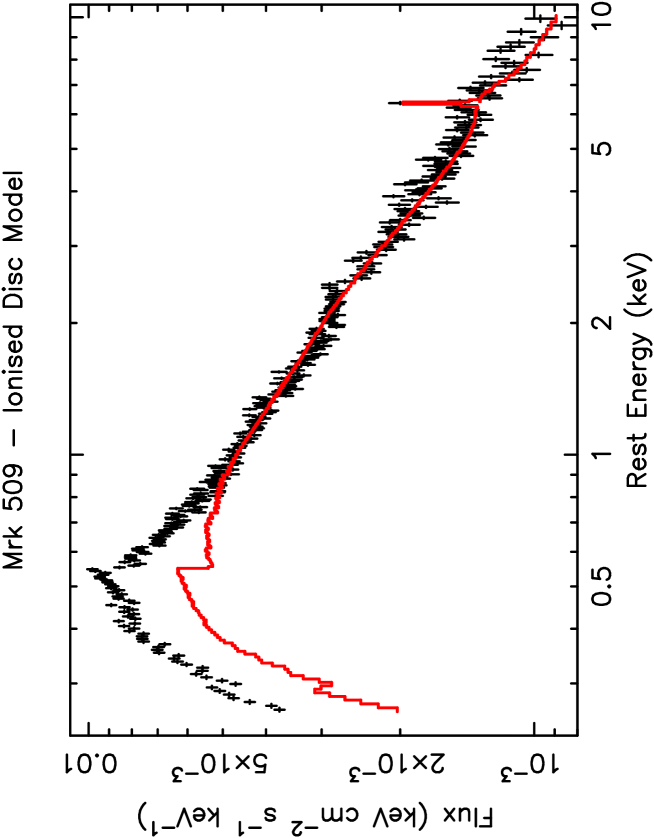
An important property of all ionised discs is that they reflect strongly at low X-ray energies where neutral discs absorb the internally scattered photons. To check the contribution of such enhanced reflection on the XMM-Newton spectrum, the best-fit ionised disc model at 2–10 keV (fit 4 in table 1) was extrapolated over the full data bandwidth. A ’soft excess’ is still strongly required, but now the hottest BB component is removed by the enhanced reflection of the ionised disc below 2 keV. This full-band fit is summarised in line 3 of table 2.
A by-product of the ionised disc fit is that the narrow 6.4 keV line EW falls to 50 eV, and is now completely unresolved by the EPIC detectors ( eV), but still remains statistically very significant.
5 Discussion
The first XMM-Newton observation of Mkn 509 found the source in a relatively faint state, with the 2–10 keV flux about half of its previously measured value. That may account for the mean power-law being somewhat flatter than in earlier measurements. However, our spectral fits clearly show the presence of a ‘soft excess’ which lies well above the power-law even when the latter is enhanced at low energies by reflection from a strongly ionised disc. Of particular interest is the appearance of two components in the Fe K band, and we note the similarity to the XMM-Newton observation of Mkn 205.
The most prominent feature, at 6.4 keV, we identify with the narrow line component now emerging as a common feature of Seyfert 1 spectra (e.g. Reeves et al. 2001, Yaqoob et al. 2001, Kaspi et al. 2001). Recognition of this separate component to the Fe K emission has two important consequences. First, fitting of the broader line profiles commonly seen in ASCA spectra of bright (generally lower luminosity) Seyferts should now allow for a separate contribution to the line core at 6.4 keV. Nandra et al. (1997a), in their survey of ASCA spectra of AGN, found no requirement for a narrow Fe K line, but with upper limits to the EW of order 100 eV. However, Lubinski & Zdziarski (2001) in their analysis of a larger sample of Seyfert 1s did suggest that the narrow emission line component may be important. Secondly, the detection of a strong, narrow iron emission line at 6.4 keV indicates that a substantial quantity of cool reprocessing material — lying outside of the line-of-sight since the X-ray spectrum shows no intrinsic absorption — is illuminated by the central X-ray source. The line strength (EW eV) implies that the cool matter subtends a solid angle of at least 1 steradian, assuming it is Thomson thick and has a solar abundance of iron (e.g. George & Fabian 1991). The most likely location of such material, within the framework of current AGN models, would appear to be the molecular torus (Antonucci 1993), with hard X-rays from the central engine being reflected off the inner surface of the torus and into the line-of-sight of the observer (Krolik, Madau & Zycki 1994, Ghisellini et al. 1994). We cannot, however, at present rule out other alternatives, given the EPIC CCD spectral resolution, including emission from BLR clouds (Leahy & Creighton 1993).
The detection of emission from strongly ionised Fe is of particular interest in relation to exploring the inner accretion disc. We note that high ionisation Fe K lines have previously been suggested by ASCA data of several radio-quiet quasars (Reeves & Turner 2000), while the so-called X-ray Baldwin effect has been invoked to describe the apparent tendency (in ASCA spectra) for the Fe K emission to be weaker for higher luminosity AGN (Nandra et al. 1997b). The XMM-Newton observations of Mkn 509 and Mkn 205 now confirm, for 2 high luminosity AGN, that the Fe-K emission is indeed relatively weak. A reduction in strength of the observed He-like Fe K line can be understood if the accretion disc develops an over-ionised hot skin produced by the strong hard X-ray illumination (Nayakshin et al. 2000, Ballantyne et al. 2001). Assuming the low value for the high energy spectral rollover as observed by BeppoSAX, we find that a large ratio of the ionising flux to the local disc thermal flux is required to keep the ‘skin’ hot enough. Given the observed ratio of X-ray luminosity to optical-UV luminosity , this then requires a flux concentration which is only plausible if the X-rays originate from localised sources, e.g. magnetic flares near the disc surface.
Aside from the Fe K line emission, the EPIC X-ray spectrum of Mkn 509 appears to be devoid of other discrete emission or absorption features. In particular the absence of strong recombination emission from Si, Mg, Ne and O constrains the disc reflection model to high values of the effective ionisation parameter. Thus we are apparently observing the bare nuclear continuum emission in Mkn 509, with the soft excess flux arising as thermal emission from the inner accretion disc.
Finally, we comment briefly on the RGS spectrum. The detection of an absorption trough at 16–17 Å, which we tentatively identify with absorption in Fe M ions, is interesting, particularly in comparison with the discovery of this feature in IRAS 13349+2438 from an earlier XMM-Newton observation (Sako et al. 2001). In the latter case the absorption was interpreted as arising in a cool gas component associated with the dust that causes strong reddening in the optical band (E(B-V)=0.3). In Mkn 509 the optical reddening is more than an order of magnitude less, implying that here the temperature of this ’cool’ material remains too high for dust grains to survive. A further implication of the Fe M absorption in Mkn 509, if confirmed, is that it raises a question about the common occurrence of OVII absorption edges, particularly in the analysis of ASCA data (e.g. Reynolds 1997, George et al. 1998). The narrow absorption line at 13.5 Å, and the emission from OVII require a zone of higher ionisation in the line-of-sight material, and the ratio of components in the OVII triplet suggest an origin in a photoionised gas with electron density greater than cm-3 and electron temperature less than K (Porquet and Dubau 2000).
6 Conclusions
Observations with XMM-Newton have revealed 2 apparently separate components to the Fe K line emission of the high luminosity Seyfert 1 galaxy, Mkn 509. Instead of a broad iron line component centred near 6.4 keV, with a strong ‘red’ wing, as found in lower luminosity Seyfert galaxies, and explained by reflection from “cold” matter in the inner accretion disc, we find a relatively weak line centred at 6.7–6.9 keV. We model this feature in terms of fluorescence from He-like iron in the highly ionised inner disc material. The energy, equivalent width and profile of this feature are all important in the model fitting, as is the high energy cutoff of the illuminating X-rays. If a cutoff as low as keV (Perola et al. 2000) is confirmed then our modelling suggests the illuminating X-ray flux in order that the He-like line is not much stronger than we observe. Our tentative conclusion is to suggest a geometry in which the hard X-ray emission arises in magnetic flares above the disc (Nayakshin & Kazanas 2001b).
The narrow line at 6.4 keV appears to be an increasingly common feature in the higher quality spectral data emerging from Chandra and XMM-Newton, and probably arises from Compton scattering off distant, cool matter. If this material is in the putative molecular torus, then — as with Mkn 205 — this provides important evidence that a substantial torus exists for AGN with bolometric luminosities as high as erg s-1. However, it appears that narrow 6.4 keV iron lines are weak or absent in higher luminosity QSOs. For example, upper limits of 10 eV have been set on narrow 6.4 keV lines in the high luminosity quasars PKS0558504 (O’Brien et al. 2001), S5 0836+710 and PKS 2149306 (Fang et al. 2001). Whatever the origin of the neutral gas, the observations imply a smaller covering factor for such gas in high-luminosity objects. If confirmed by observations of a larger sample of AGN, the apparent correlation of narrow 6.4 keV line strength with bolometric luminosity is consistent with torus models involving a dusty, disc-driven hydromagnetic wind (Konigl et al. 1994), which predict that the dust distribution will be ‘flattened’ due to radiation pressure in high luminosity AGN, hence reducing the solid angle subtended by the torus.
References
- (1)
- (2) Antonucci, R. 1993, ARA&A., 31, 473
- (3)
- (4) Ballantyne, D.R., Ross, R.R, Fabian, A.C. 2001, MNRAS, in press (astro-ph/0102040)
- (5)
- (6) Chenais-Popovics, C., et al. 2000, ApJS, 127, 278
- (7)
- (8) Cooke, B.A., et al. 1978, MNRAS, 182, 489
- (9)
- (10) Fabian, A.C., Rees, M.J., Stella, L., White, N.E. 1989, MNRAS, 238, 729
- (11)
- (12) Fang, T., Marshall,H.L., Bryan, G.L., Canizares, C.R. 2001, ApJ, in press, astro-ph/0102370
- (13)
- (14) George I.M., Turner T.J., Netzer H., Nandra K., Mushotzky R.F., Yaqoob T. 1998, ApJS, 114, 73
- (15)
- (16) George, I.M., Fabian, A.C. 1991, MNRAS, 249, 352
- (17)
- (18) Ghisellini G., Haardt F., Matt G. 1994, MNRAS, 267, 743
- (19)
- (20) Haardt, F., Maraschi, L., Ghisellini, G. 1994, ApJ, 432, L95
- (21)
- (22) Kapsi S., Brandt W.N., Netzer H., George I.M., Chartas G., Behar E., Sambruna R., Garmire G., Nousek J. 2001, ApJ, in press (astro-ph/0101540)
- (23)
- (24) Konigl, A., Kartje, J.F. 1994, ApJ, 434, 446
- (25)
- (26) Kriss, G.A., et al. 2000, ApJ, 538, L17
- (27)
- (28) Krolik, J.H., Madau, P., Zycki, P.T. 1994, ApJ, 420, L57
- (29)
- (30) Leahy, D.A., Creighton, J. 1993, MNRAS, 263, 314
- (31)
- (32) Lubinski P., Zdziarski A.A. 2001, MNRAS, submitted (astro-ph/0009017)
- (33)
- (34) Matt, G., Fabian, A.C., Ross, R. 1996, MNRAS, 280, 823
- (35)
- (36) Mushotzky R.F., Done C., Pounds K.A. 1993, ARA&A, 31, 717
- (37)
- (38) Murphy E.M., Lockman F.T., Laor A., Elvis M. 1996, ApJS, 105, 369
- (39)
- (40) Nandra, K., Pounds K. A. 1994, MNRAS, 268, 405
- (41)
- (42) Nandra, K., George, I.M., Mushotzky, R.F., Turner, T.J., Yaqoob, T. 1997a, ApJ, 477, 602
- (43)
- (44) Nandra, K., George, I.M., Mushotzky, R.F., Turner, T.J., Yaqoob, T. 1997b, ApJ, 488, L91
- (45)
- (46) Nayakshin, S., Kazanas, D., & Kallman, T.R. 2000, ApJ, 537, 833
- (47)
- (48) Nayakshin, S. 2000, ApJ, 540, L37
- (49)
- (50) Nayakshin, S., & Kazanas, D. 2001b, submitted ApJL (astro-ph 0101312)
- (51)
- (52) Nayakshin, S., & Kazanas, D. 2001a, to be submitted to ApJL
- (53)
- (54) O’Brien, P.T., et al. 2001, A&A, 365, L122
- (55)
- (56) Perola, G.C., et al. 2000, A&A, 358, 117
- (57)
- (58) Porquet, D., & Dubau, J. 2001, A&A, submitted
- (59)
- (60) Pounds, K.A., Nandra, K., Stewart, G.C., George, I.M., Fabian, A.C. 1990, Nature, 344, 132
- (61)
- (62) Pounds K.A., Nandra K., Fink H.H., Makino F. 1994, MNRAS, 267, 193
- (63)
- (64) Reeves, J.N., Turner, M.J.L. 2000, MNRAS, 316, 234
- (65)
- (66) Reeves, J.N., Turner M., Pounds K.A., O’Brien P.T., Boller Th., Ferrando P., Kendziorra E., Vercellone S. 2001, A&A, 365, L134
- (67)
- (68) Reynolds, C.S. 1997, MNRAS, 286, 513
- (69)
- (70) Sako, M., et al. 2001, A&A, 365, L168
- (71)
- (72) Singh K.P., Westergaard N.J., Schnopper H.W., Awaki H., Tawara Y. 1989, ESA SP-296, 1053
- (73)
- (74) Singh K.P., Westergaard N.J., Schnopper H.W., Awaki H., Tawara Y. 1990, ApJ, 363, 131
- (75)
- (76) Strüder, L., et al. 2001, A&A, 365, L18
- (77)
- (78) Tanaka, Y., et al. 1995, Nature, 275, 659
- (79)
- (80) Turner, M.J.L., et al. 2001, A&A, 365, L27
- (81)
- (82) Turner T.J., Weaver K.A., Mushotzky R.F., Holt S.S., Madejski G.M. 1991, ApJ, 381, 85
- (83)
- (84) Walter, R., Fink, H.H. 1993, A&A, 274, 105
- (85)
- (86) Yaqoob, T., Goerge, I.M., Nandra, K., Turner, T.J., Serlemitsos, P.J., Mushotzky, R.F. 2001, ApJ, 546, 759
- (87)
| Fit | 1st line | 2nd line | /dof | |||||
|---|---|---|---|---|---|---|---|---|
| EaaRest energy of line (keV). | bbIntrinsic (1 sigma) width of line (eV). | EWccEquivalent width of line (eV). | EaaRest energy of line (keV). | bbIntrinsic (1 sigma) width of line (eV). | EWccEquivalent width of line (eV). | |||
| 1. P-L only | 1.640.01 | 1490/1294 | ||||||
| 2. P-L + Gauss | 1.660.02 | 6.370.03 | 80 | 82 | 1403/1291 | |||
| 3. P-L + 2Gauss | 1.670.02 | 6.360.03 | 82 | 85 | 6.910.09 | 120 | 44 | 1386/1288 |
| 4. XionddXion - Ionised reflection model (Nayakshin et al. 2000) — see text. Model best-fit parameters are LX/L, accretion rate , inclination∘, and inner radius . + GausseeFit to PN data only. | 1.760.05 | 6.360.04 | 47 | 864.0/874 | ||||
| FitaaThe region near 0.5 keV, where the neutral oxygen absorption in the oxide layer of the EPIC detectors is not well modelled at present, is excluded from each fit. | bbTemperature (kT) of blackbody emission (units eV). | bbTemperature (kT) of blackbody emission (units eV). | bbTemperature (kT) of blackbody emission (units eV). | /dof | |
|---|---|---|---|---|---|
| 1. P-L only | 1.99 | 4964/1704 | |||
| 2. P-L + 3bbody | 1.620.02 | 185 | 1073 | 33212 | 1834/1698 |
| 3. XionccXion = Fit to ionised reflection model (Nayakshin et al. 2000) - see text for details. + bbodyddFit to PN data only. | 1.750.02 | 982 | 1226/1183 |