Spectropolarimetry of the Type II Supernovae 1997ds, 1998A, and 1999gi
Abstract
We present single-epoch spectropolarimetry of the Type II supernovae (SNe II) 1997ds, 1998A, and 1999gi. SN 1997ds and SN 1998A were both observed during the early photospheric phase, less than 50 days after explosion, while spectropolarimetry of SN 1999gi was obtained near the start of the transition to the nebular phase, about 110 days after explosion. Uncorrected for interstellar polarization (ISP), SN 1997ds is characterized by , SN 1998A has , and SN 1999gi is polarized at . SN 1997ds and SN 1999gi exhibit distinct polarization modulations (up to in SN 1997ds and in SN 1999gi) at the wavelengths of the strongest spectral line features. While no spectral polarization features could be observed in SN 1998A, the data are insensitive to polarization features at the levels confirmed in the other two objects.
The low continuum polarization inferred for SN 1997ds and SN 1998A and the amplitude of (or limits on) the polarization modulations are consistent with those measured at similar epochs for SN 1987A and the Type II-plateau SN 1999em, and supports the growing consensus that core-collapse events with hydrogen envelopes substantially intact at the time of explosion are not significantly aspherical during the early photospheric phase. The spectral shape of the high continuum polarization of SN 1999gi closely resembles a “Serkowski” ISP curve (characterized by Å), and is inconsistent with the wavelength-independent nature of electron scattering expected for an aspherical SN atmosphere. Since Galactic reddening is minimal along this line-of-sight, the majority of the observed polarization in SN 1999gi is believed to be due to ISP of the host galaxy, although significant (up to ) intrinsic polarization cannot be ruled out. The potential power of SN spectropolarimetry to study the properties of interstellar dust in external galaxies is described and applied to the SN 1999gi data, where it is shown that if the polarization is indeed predominantly interstellar in origin, then for the dust along this line-of-sight in NGC 3184.
1 INTRODUCTION
Polarimetry provides a powerful probe of early-time supernova (SN) geometry. The fundamental idea is that a hot young SN atmosphere is dominated by electron scattering, which by its nature is highly polarizing. If we could resolve such an atmosphere, we would measure changes in both the position angle and strength of the polarization as a function of position in the atmosphere (see Figure 1 of Leonard, Filippenko, & Matheson 2000b). For a spherical source that is unresolved, however, the directional components of the electric vectors cancel exactly, yielding zero net linear polarization. If the source is aspherical, incomplete cancellation occurs; the resulting degree of net linear polarization varies with the amount of asphericity, as well as with the viewing angle and the extension and density of the electron-scattering atmosphere. A polarization of about 1% is expected for an asymmetry of 30% (defined as [1.0 - (minor axis / major axis)] 100) for a typical viewing orientation ( to the major axis) when modeled in terms of an oblate spheroid (Höflich 1991).
From the Galactic distribution and high velocity of pulsars ( km s-1, with individual velocities as high as 1600 km s-1; see Cordes & Chernoff 1998; Strom et al. 1995), high-velocity “bullets” of matter in SN remnants (e.g., Taylor, Manchester, & Lyne 1993), the asymmetric morphology of young SN remnants (Manchester 1987; see, however, Gaensler 1998), the aspherical distribution of material inferred by direct speckle imaging of young SNe (e.g., SN 1987A, Papaliolios et al. 1989; see, however, Höflich 1990), the possible association of core-collapse SNe with some gamma-ray bursts (e.g., Bloom et al. 1999), and previous SN polarization studies (see Wheeler [2000] for a comprehensive list of polarimetric observations of SNe), a consensus is emerging that core-collapse SNe are intrinsically aspherical. An interesting recent speculation, however, is that the degree of asphericity is inversely correlated with the amount of envelope material intact at the time of explosion: SNe that have lost a significant amount of their hydrogen envelope prior to exploding are found to be highly polarized at early times whereas those that have their hydrogen envelopes substantially intact are polarized at a much lower level (Wheeler 2000; see also Wang et al. 2001). The observations by Leonard et al. (2001a, hereafter L01a) that the polarization of SN 1999em, a classic Type II event, slowly increased as the photosphere receded during the plateau phase also supports the finding that the deeper we peer into the heart of the explosion, the greater the evidence for asphericity becomes. The number of detailed spectropolarimetric studies, however, remains quite small, with SN 1993J (, Tran et al. 1997) and SN 1998S (, Leonard et al. 2000a222We note that the intense interaction of the SN ejecta with a dense circumstellar medium in the SN 1998S system makes the ultimate source of the inferred asymmetry (i.e., thermal photosphere or ejecta-circumstellar medium interaction) unclear.) serving as the prime examples of SNe whose progenitors had shed a substantial fraction of their hydrogen envelopes prior to explosion and SN 1987A (, Jeffery 1991a and references therein) and SN 1999em (, L01a) as the standard bearers for those with substantially intact hydrogen envelopes.
We present single-epoch spectropolarimetry of SNe 1997ds, 1998A, and 1999gi, all Type II events observed during the photospheric phase. The spectra are dominated by hydrogen Balmer lines with classic P-Cygni line profiles, and there is no evidence for substantial circumstellar interaction or progenitor mass-loss in any of the objects, suggesting the existence of hydrogen envelopes largely intact at the times of the explosion. We describe the observations and reduction techniques in § 2.1, the procedure used to set bounds on the interstellar polarization (ISP) and upper detection limits for spectral and spectropolarimetric features in § 2.2, and the method used to quantify the strength of polarization modulations in § 2.3. We present and discuss the spectropolarimetry of the three SNe II in § 3, and give an overview of the potential power of using spectropolarimetry of SNe as probes of interstellar dust in external galaxies in § 3.4. Our conclusions are summarized in § 4.
2 ANALYSIS TECHNIQUES
2.1 Data Reduction
All of the data presented in this study were obtained using the Low Resolution Imaging Spectrometer (Oke et al. 1995) in polarimetry mode (Cohen 1996) at the Cassegrain focus of the W. M. Keck-I and Keck-II 10-m telescopes, and reduced according to the methods detailed by L01a. All observations were made with a 600 grooves/mm grating, blazed at 5000 Å, which delivers a resolution of Å, with about 1.25 Å pixel-1. A journal of the spectropolarimetric observations is given in Table 1. Measured values for SNe 1997ds, 1998A, and 1999gi are listed in Table 2.
The displayed polarization is the “rotated Stokes parameter” (RSP), calculated by rotating the normalized Stokes parameters and by a smoothed fit to the polarization angle () so that all of the polarization (in principle) falls in a single Stokes parameter (here, rotated ). To construct the fit to the polarization angle curve we first applied a median filter to with a running boxcar of width 100 Å, which helped to eliminate extreme deviations in occurring over only one or two pixels (as may result from cosmic-ray events, for example). We then further smoothed the resulting curve by replacing the value at each wavelength with the mean of a 100 Å boxcar centered on the wavelength. Although smoothing to construct the RSP in this way helps to preserve a Gaussian distribution of polarization values about the true polarization level when is a slowly varying function of wavelength (i.e., varies on wavelength scales longer than the boxcar widths used to smooth it), sharp polarization angle rotations will cause the computed RSP to underestimate the true polarization level. Since such sharp polarization angle rotations are often seen in SN spectropolarimetry across line features, it becomes necessary to examine both RSP and URSP (the polarization measured in the rotated parameter) to determine the true polarization of some line features.
2.2 Setting Limits on Interstellar Polarization
A problem that plagues interpretation of all SN polarization measurements is proper removal of the ISP: aspherical dust grains preferentially aligned with the magnetic field of either the host galaxy or Milky Way (MW) can contribute a polarization signal that dwarfs that of the SN. For the three SNe II studied here, the most persuasive constraints that will be placed on the ISP come from reddening estimates and the empirically derived relation
| (1) |
where is the maximum ISP found for a given reddening from observations of Galactic stars (Serkowski, Mathewson, & Ford 1975; see also Whittet [1992, p. 83] for theoretical support for this relation). We estimate Galactic reddening from the dust maps of Schlegel, Finkbeiner, & Davis (1998). To help characterize the ISP due to the MW (ISPMW), we also consider the polarization of MW stars near the line-of-sight (l-o-s) to a SN contained in the catalog by Heiles (2000). We adopt the criterion of Tran (1995) that a MW star should be more than 150 pc above (or below) the Galactic plane to fully sample the MW dust. Although such “probe” stars will not, in general, yield the exact magnitude and direction of the ISPMW along the true l-o-s (especially when the stars are more than away), they should give a general indication of the polarization in that region of the sky.
To estimate the reddening due to host-galaxy dust, we cautiously make use of the rough correlation between the equivalent width () of the Na I D interstellar lines and reddening found by Barbon et al. (1990),
| (2) |
where is the total equivalent width (in Å) of the interstellar Na I D lines at . We treat this relation with a healthy degree of skepticism since sodium is known to be only a fair tracer of the hydrogen gas column (especially in dense environments, where sodium may be heavily depleted; e.g., Cohen 1973; cf., Phillips, Pettini, & Gondhalekar 1984; Ferlet, Vidal-Madjar, & Gry 1985) which may then be used to estimate the dust column. The dust-to-gas ratio also varies among galaxies (e.g., Issa, MacLaren, & Wolfendale 1990). Perhaps the most important cause of uncertainty in assigning a reddening value through this equation, though, is that our low-resolution spectra do not resolve the individual absorption systems that contribute to the line, making it impossible to estimate the effect of line saturation (i.e., the point at which the curve-of-growth relating line width to number of gas atoms begins to depart from a linear relation). From analysis of echelle spectra of 32 O and early B stars suffering reddenings between mag, Munari & Zwitter (1997) find that saturation effects begin to appear when Å for a single absorption system. When the line becomes saturated, a measured equivalent width may greatly underpredict the dust column and, hence, the reddening. For this reason, converting to an inferred reddening value is considered to be most robust for low values of .
Barring high dust-to-gas ratios or unusually high depletion of Na gas along the l-o-s, however, the lack of any Na I D interstellar absorption should, in principle, indicate little dust. Since this may help place constraints on the ISP, it is important to quantify the upper detection limit of Na I D absorption when no feature is apparent in a spectrum. For this, we adopt the relation of Hobbs (1984):
| (3) |
where is the upper limit of the equivalent width of a feature (in Å), when is the width of a resolution element (in Å) and is the 1 root-mean-square fluctuation of the flux around a normalized continuum level. This equation is technically only correct for unresolved lines in a spectrum in which the natural binning scale delivered by the spectrograph and CCD (i.e., the “original binning”) provides 1 bin per resolution element. A more general equation, valid for both resolved and unresolved line features, is
| (4) |
where is the width of the line feature (in Å) and is the number of bins per resolution element in a spectrum with the original binning. For the data presented in this study, we take , and Å for the width of Na I D interstellar absorption.
In a similar way, we shall also be interested in placing detection limits on the strength of spectropolarimetric features in the normalized Stokes parameters, . This is more difficult to quantify than since we do not, in general, know the intrinsic width of the expected features. Indeed, some polarization features in previous studies are only seen in one or two (10 Å bin-1) pixels, while others stretch across a much wider range (e.g., Leonard et al. 2000a; L01a). For any individual pixel, the upper limit to detection is simply 3 times the uncertainty in the normalized Stokes parameter for that pixel. If an estimate is made of the likely width of the feature, we shall derive an approximate upper detection limit by dividing the upper limit for a single pixel by the number of pixels examined.
2.3 Quantifying Polarization Modulations
Since the ISP is not precisely known for the objects in this study, we introduce a new definition to characterize the total polarization change seen across a line profile that is independent of the ISP value:
| (5) |
where are the individual changes in the normalized Stokes parameters compared with the nearby continuum value (i.e., ). Note that does not measure the change in total observed polarization, , but is rather the square root of the quadrature sum of the individual changes in the normalized Stokes parameters. That is, a polarization change in which the polarization vector only changes direction in the - plane will produce a measured polarization change of , but a non-zero, positive value for . In other words, is a measured quantity independent of the (generally unknown) ISP, whereas is not. Rather, represents the maximum magnitude change in the polarization, and makes no distinction between polarization increases, decreases, or directional change. Of course, since we do not know the exact value of the ISP, interpretations dependent on whether the change is treated as a polarization increase, decrease, or directional change necessarily do not represent unique solutions.
When analyzing the polarization change across a specific line feature, we bin the polarization spectrum to 10 Å bin-1 before determining the polarization of a line feature in order to improve the signal-to-noise (S/N) ratio. However, since features may be quite sharp, it often happens that the polarization change is detectable in only a few (rebinned) pixels. In such cases, we carefully examine the polarization properties of the original spectrum (always binned 2 Å bin-1) to see if the polarization feature is seen consistently across many pixels or is due to a single deviant pixel, before concluding that a true polarization change exists.
In the spectropolarimetric study of SN 1999em by L01a, polarization increases were found at the location of the P-Cygni line troughs of H, Fe II , and Na I D ), and a sharp polarization decrease was observed across the H emission profile during the photospheric phase. These features were interpreted within the basic ansatz first proposed by McCall (1984) and later extended by Jeffery (1991b), that polarization peaks are naturally associated with absorption minima due to selective blocking of forward-scattered (and hence less polarized) light in P-Cygni absorption troughs and polarization minima are associated with emission peaks due to the dilution of polarized continuum light with unpolarized line emission. The lack of a polarization increase in the H trough of SN 1999em was attributed to the increased contribution of unpolarized photons by resonance scattering of continuum light along with the fact that the optically thick H line provides a screen that effectively covers more of the SN atmosphere than the metal lines, thereby blocking relatively more polarized photons from the limb regions (see discussion by L01a).
With this simple model in mind, it is possible to solve for a lower bound on the true continuum polarization level () in the limit of blockage of only unpolarized light (or light with electric vectors that exactly cancel) in a line trough and addition of completely unpolarized light in a line peak:
| (6) |
where equals the interpolated value of the continuum flux at the location of the line feature and is the total flux at the line’s flux minimum. Equation (6) will allow us to set plausible bounds on the continuum polarization intrinsic to a SN, and not produced by ISP. To estimate the continuum flux level at the location of an absorption feature, we fit a smooth spline over the absorption feature, guided by the continuum levels shown for the synthetic spectra of SNe II presented by Jeffery & Branch (1990).
L01a presents a detailed spectropolarimetric study of SN 1999em, an extremely well-observed classic Type-II plateau (SN II-P) event, and Leonard et al. (2001b, hereafter L01b) present and discuss its spectral and photometric behavior. Since the total flux spectra of SNe 1997ds, 1998A, and 1999gi are all broadly similar to SN 1999em at similar epochs, direct comparisons between these three events and SN 1999em will frequently be made.
![[Uncaptioned image]](/html/astro-ph/0105295/assets/x1.png)
![[Uncaptioned image]](/html/astro-ph/0105295/assets/x2.png)
3 Results and Discussion
3.1 SN 1997ds
SN 1997ds was discovered by Qiu et al. (1997) on 1997 November 17.47 at unfiltered magnitude mag in the SBd galaxy MCG -01-57-007. Patat, Boehnhard, & Delfosse (1997) obtained a spectrum 3 days later and identified it as a Type II event, with well-developed H and H P-Cygni profiles. Since a CCD image of the same field taken 13 days earlier did not detect the SN (Qiu et al. 1997), it was likely discovered quite soon after explosion. The Galactic foreground extinction is small, mag (Schlegel et al. 1998), and the lack of appreciable interstellar Na I D absorption ( Å, from equation [4]) suggests minimal host-galaxy reddening as well.

We obtained spectropolarimetry of SN 1997ds on 1997 December 20 at the Keck-II 10-m telescope (Table 1); some preliminary results from this observation were presented by Leonard et al. (2000b). From the constraints set by the discovery and prediscovery images, the observation occurred sometime between and days after the explosion, during the early photospheric epoch. The data are presented in Figure 1 and tabulated in Table 2. The total flux spectrum shows the usual features for a SN II during the photospheric phase: prominent hydrogen Balmer and Fe II P-Cygni features superposed on a fairly smooth continuum. Although no photometric information is available for SN 1997ds, we note that the total flux spectrum closely resembles SN 1999em at a similar age (Figure 2), which might suggest that SN 1997ds belongs to the Type II-P classification as well. However, the lack of sufficient spectroscopic data for Type II linear (II-L) SNe in general precludes definitive classification based on spectroscopy alone (Patat et al. 1994; cf., Schlegel 1996).

The spectropolarimetry data displayed in Figure 1(b,c) indicate a low, flat polarization at with a fairly constant polarization angle near . From the foreground reddening, we infer a maximum ISP due to MW dust of (equation [1]), and an unknown, though probably minimal contribution from the host galaxy (, if we apply equation [2] to the detection limit of the Na I D interstellar lines). Further support for a small Galactic ISP comes from the polarization of stars near the l-o-s to SN 1997ds. The cataloged values (Heiles 2000) for the polarization of 8 stars within of SN 1997ds are quite small, ranging from for HD 213998 to for HD 212571. The polarization angles given for these 8 stars are essentially random, although only 2 (HD 212571 and HD 211099 []) lie sufficiently far away (i.e., more than 203 pc for the l-o-s to SN 1997ds, which has a Galactic latitude of ) to fully probe the material in the Galactic plane. Given the range of values found for the foreground stars, it is possible that a significant portion of the observed polarization of SN 1997ds is due to Galactic dust. Lacking temporal coverage or a clear physical motivation from which to deduce the ISP value, however, we cannot be certain. We do note that if the maximum allowed host ISP value is used, then an upper limit to the total ISP (i.e., ISPMW + ISPhost) of ISP results. This then restricts the allowable polarization intrinsic to SN 1997ds to the range .
A clear line feature in the polarization data is visible at H (Figure 1); Figure 3 shows more detail of this region, rebinned to 10 Å bin-1 to improve the S/N ratio. A change of and is measured in the deepest part of the P-Cygni trough, resulting in a total polarization change of (equation [5]) for the line. (We note that the single-pixel, upper limit for polarization changes at the H trough is , and at Fe II is .) Since we do not know the ISP, it is impossible to state with certainty whether the intrinsic polarization increases, decreases, or changes direction in this feature. In the spectropolarimetry of SN 1999em, a sharp polarization drop occurs across H from just redward of the absorption minimum through the emission profile (L01a). For SN 1997ds, the polarization modulation seen at H is distinctly different from that seen in SN 1999em: independent of the ISP value, the strongest part of the modulation is clearly associated with the absorption trough itself, with little modulation evident across the emission profile. Further, if the ISP contribution is less than 0.81% as expected, then the polarization in the trough cannot represent a polarization decrease. An H trough polarization increase is actually quite similar to what is observed in the Fe II and Na I D lines of SN 1999em (L01a), suggesting that the gas forming the H absorption line in SN 1997ds screens relatively fewer polarized photons than it does in SN 1999em. The different characteristics of the H-line polarization between SN 1997ds and SN 1999em may signal a different density structure of the electron-scattering atmospheres of the two events.
Lacking a firm value for the ISP, however, it is difficult to proceed with further interpretation of the H polarization feature. The basic result is that at the time of our observation, between 33 and 46 days after the explosion, SN 1997ds had a rather low intrinsic polarization, most likely in the range . A distinct polarization modulation of occurs in the H absorption trough, and polarization modulations greater than in other absorption features are not seen.

3.2 SN 1998A
SN 1998A was discovered by Williams et al. (1998) on 1998 January 6.77 at an -band magnitude of mag in the Sc galaxy IC 2627. Since the SN is not visible on a CCD image of the same field taken 20 days earlier (Williams et al. 1998), it was likely discovered shortly after the explosion. Filippenko & Moran (1998) identified it as a Type II event with well-developed P-Cygni hydrogen Balmer lines from a spectrum taken on 1998 January 17 (and presented here). The foreground reddening to SN 1998A is minimal, mag (Schlegel et al. 1998), and the lack of appreciable interstellar Na I D absorption ( Å ) suggests small host galaxy reddening as well, with mag from equation (2). This implies mag and . The polarization catalog by Heiles (2000) includes measurements for 8 MW stars within of SN 1998A, seven of which have , with one (HD 94473) having . Several of these stars are far enough away (i.e., more than 255 pc since SN 1998A has a Galactic latitude of ) to fully probe the material in the Galactic plane. All 8 of the MW stars have a similar polarization angle (), which suggests fairly ordered but patchy dust in this direction (see Ryu et al. 2000 for a detailed study of the patchy extinction in this region).
A photometric study of SN 1998A during the first 170 days after discovery is presented by Woodings et al. (1998). The light curves show a slow rise to a broad ( days) peak approximately 70 days after discovery, followed by a more rapid decline. This light curve behavior is quite similar to that of SN 1987A, leading Woodings et al. (1998) to propose that the progenitor of SN 1998A may also have been a blue supergiant (Woosley et al. 1987). If this comparison is valid, then we might expect SN 1998A to share some of the spectral properties that were seen in SN 1987A as well, the most prominent of which was the very rapid strengthening of the metal lines (in particular lines resulting from Ba II; see, e.g., Jeffery & Branch 1990) during the early photospheric phase, an effect believed to result from the compact nature of its progenitor (Branch 1987).
We obtained spectropolarimetry of SN 1998A on 1998 January 17 at the Keck-II 10-m telescope under cloudy conditions (Table 1). From the constraints set by the discovery and prediscovery images our observation likely took place between and days after the explosion, when the SN was in its early photospheric stage of development. The data are presented in Figure 4 and tabulated in Table 2. The total flux spectrum (Figure 4a) is characterized by prominent hydrogen Balmer and P-Cygni features due to metal lines, typical for SNe II during the recombination phase. The spectrum of SN 1999em that most closely matches the line strengths of SN 1998A is from 45 days after explosion (Figure 5); note that the strength of the metal lines in the spectrum of SN 1999em from day 35 (Figure 2) are considerably weaker than those seen in the spectrum of SN 1998A from an even earlier epoch. The more rapid spectral development of SN 1998A compared with SN 1999em is consistent with what was seen in SN 1987A. We also note that the depth of the absorption feature near Å (generally attributed to a blend of Ba II along with several Fe II features [L01b]) relative to the other metal lines is somewhat stronger in SN 1998A than in SN 1999em. It is tempting to speculate that this may be another spectral similarity between SN 1998A and SN 1987A, since the spectrum of SN 1987A also exhibited abnormally strong Ba II features. However, the contrast between the depths of the Ba II absorption and the other metal lines was much greater in SN 1987A at a similar epoch than what is seen here in SN 1998A. Nevertheless, the available evidence does suggest that spectral similarities between the two events do exist.


The optical polarimetry data shown in Figure 4(b,c) are quite noisy, and we are unable to positively confirm the presence of any significant line features, even at H (Figure 6). If we assume that the width of a polarization feature at H would be the same as that found in SN 1997ds ( Å), then from the uncertainty in and we derive upper limits of and , so that , a detection limit somewhat larger than the changes actually seen in SN 1997ds. We therefore cannot place very tight constraints on the degree of polarization change across line features in SN 1998A. The broadband continuum polarization, however, is quite well defined, and found to be very low, at . This polarization angle is inconsistent with the polarization angles found for Galactic stars near the l-o-s, and suggests at least some intrinsic SN polarization or host galaxy ISP contribution. Since , we conclude that for SN 1998A, and note that we cannot detect line features below . The low level of polarization is similar to that observed in SN 1987A, which exhibited at early times followed by an increase to after about 40 days, and then a slow decline through day 100 (see Jeffery 1991a and references therein).
3.3 SN 1999gi
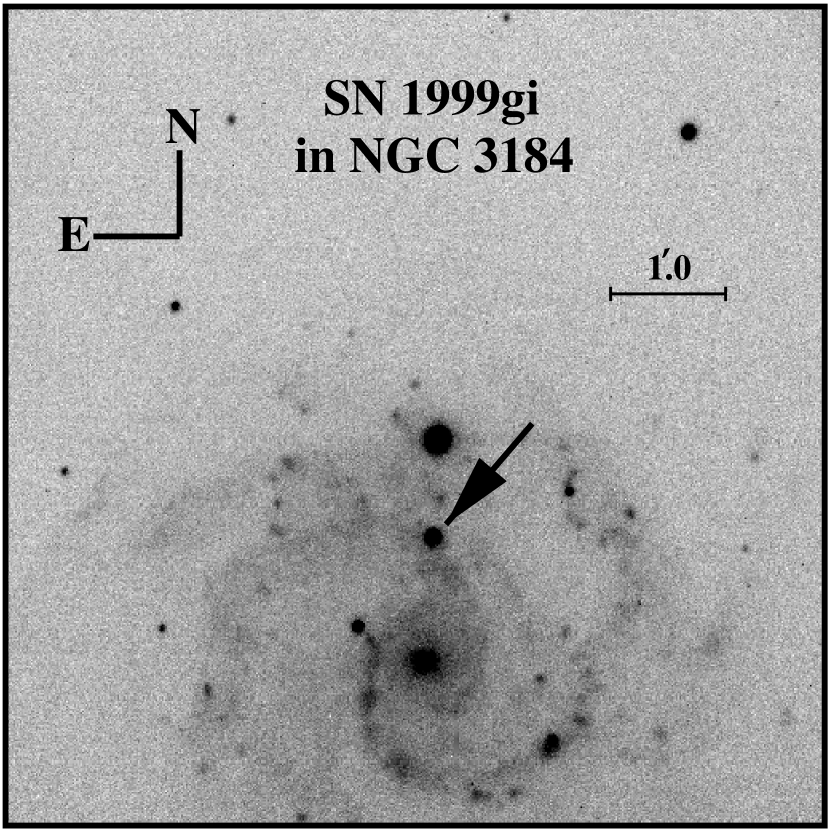
SN 1999gi was discovered by Nakano et al. (1999) on 1999 December 9.82 at an unfiltered magnitude of mag in the nearly face-on (, from LEDA333http://www-obs.univ-lyon1.fr/leda/home_leda.html) SBc galaxy NGC 3184 (Figure 7). Since the SN is not visible on a CCD image of the same field taken 7 days earlier444An additional prediscovery image obtained 6 days prior to discovery also shows no SN (Trondal et al. 1999), but it does not go as deep as the one taken the day before. (Nakano et al. 1999), it was likely discovered shortly after explosion. A spectrum taken within a day of discovery showed it to be a Type II event at an early epoch, with a blue continuum and a broad H P-Cygni profile with a hint of He I absorption (Nakano et al. 1999). Photometric data spanning the first 111 days after discovery clearly establish SN 1999gi as a Type II-P event, since its unfiltered magnitude fell by only mag during this period (Kiss, Sarneczky, & Sziladi 2000; Yoshida & Kadota 2000; Sarneczky et al. 2000).
The foreground reddening to SN 1999gi is minimal, mag (Schlegel et al. 1998). However, there is significant Na I D absorption ( Å; Nakano et al. 1999) at the redshift of NGC 3184, which suggests the possibility of substantial extinction by dust in the host galaxy. Applying equations (2) and (1) yields , but we caution that Å is well into the saturation regime if few absorption systems contribute to the line, so that the derived ISPmax may underestimate the true ISP contribution. A polarization measurement to only one foreground MW star within of SN 1999gi is recorded in the catalog by Heiles (2000), and it (HD 89021) has a very small value, , but is only 30 pc away and therefore does not nearly probe all of the material in the Galactic plane (a star would need to be more than 183 pc away since SN 1999gi has a Galactic latitude of ). Nonetheless, from the small Galactic reddening we expect a small ISPMW.


We obtained high-quality spectropolarimetry of SN 1999gi on 2000 March 25 (107 days after discovery) at the Keck-I 10-m telescope (Table 1). From the constraints set by the discovery and prediscovery images our observation likely took place between and days after the explosion. A photometric observation by Sarneczky et al. (2000) 4 days after our observation showed SN 1999gi to be at unfiltered magnitude mag; since SN 1999gi reportedly dropped an additional 0.3 mag over the next 11 days (Sarneczky et al. 2000), it is likely that SN 1999gi was right at the end of the plateau phase when our observation took place. The observed spectropolarimetry data are shown in Figure 8, with detail of the H region displayed in Figure 9.
Figure 10 illustrates the striking similarity between the total flux spectrum of SN 1999gi and a spectrum of SN 1999em taken at a similar epoch ( days after explosion). Of particular interest is the remarkable correspondence of all of the absorption features that complicate the H absorption profile. Since rapid changes in the H profile of SN 1999em coincided with its fall off the plateau (L01b), this strengthens the argument that SN 1999gi was observed at a similar evolutionary stage in its development. A detailed discussion of the spectral development of SNe II-P, with a particular focus on the H profile, is given by L01b. For this study, we note that the existing spectroscopic and photometric evidence suggests that SN 1999gi and SN 1999em may have been quite similar events and that our spectropolarimetric observation of SN 1999gi likely caught the evolutionary phase when the recombination front was just reaching the HHe boundary and the SN was beginning the transition to the nebular stage.

SN 1999gi exhibits an extremely high overall polarization level, (Table 2), with polarization modulations evident across several P-Cygni features. It is unfortunate that no other spectropolarimetry (or broadband polarimetry) exists for SN 1999gi, since a temporal change in the overall level would help distinguish between polarization intrinsic to the SN and that contributed by ISP. The main question, then, is what fraction of the observed polarization is due to ISP, and how much is intrinsic to SN 1999gi. With only a single epoch of spectropolarimetry, it is impossible to know for sure. However, there is one characteristic of its continuum polarization that sets it apart from all other Type II objects studied thus far: it is not flat with wavelength. Rather, it has a broad, asymmetric peak at about Å that gently decreases on either side. This is unlike the wavelength-independent nature of electron scattering expected for a SN atmosphere, but is reminiscent of the polarization seen in spectropolarimetry of Galactic stars whose light is polarized by foreground dust. In fact, Figure 11 demonstrates that a Serkowski ISP curve (Serkowski 1973) as modified by Wilking, Lebofsky, & Rieke (1982) and updated by Whittet et al. (1992), convincingly fits the continuum polarization exhibited by SN 1999gi. When arbitrary amounts of wavelength-independent polarization are removed from the observed polarization (to simulate polarization intrinsic to SN 1999gi), the fit of the best-fitting Serkowski ISP curve becomes less convincing (Figure 12). Since the fit of a Serkowski ISP curve to the resulting ISP becomes quite poor for intrinsic SN polarization values greater than , this implies that the polarization intrinsic to SN 1999gi is somewhat less than , and that ISPhost is likely greater than . This suggests (but does not prove) that much of the polarization seen is, in fact, interstellar in nature. We shall return to a discussion of the potential power of SN spectropolarimetry for the study of the properties of dust in external galaxies in § 3.4. For now, we note that the shape, strength, and peak wavelength of the polarization seen in SN 1999gi is quite consistent with heavily reddened lines of sight to Galactic stars, which would imply similar properties for the dust in NGC 3184 and the MW.


Along these same lines, the constancy of the polarization angle with wavelength across the optical spectrum (Figure 8c) also favors a large ISPhost. If large intrinsic SN polarization exists, then unless (an unlikely chance occurrence), significant variation in the polarization angle with wavelength would be observed. For the same reason, this also favors the idea that ISPhost comes predominantly from a single source, perhaps a thick dust cloud along the l-o-s, in which much of the gas has been depleted onto dust grains. This scenario would also explain how ISPhost could be so much greater than the ISPmax predicted by equation (1).
A final argument in favor of a large ISPhost contribution comes from the low contrast of the polarization modulations seen across the P-Cygni lines. The two strongest polarization features, near (Ba II ) and (Na I D), have and , respectively. This level of polarization change is quite similar to that observed in the line troughs of SN 1997ds and SN 1999em. If the line-trough polarization mechanism in SN 1999gi is the same as that proposed for SN 1999em and SN 1997ds (§ 2.3), much stronger features should exist in SN 1999gi if it has a more highly polarized continuum. In fact, since the Ba II blend has and the Na I D line has , this sets lower bounds on the continuum polarization of only and , respectively (equation [6]), for SN 1999gi. A further similarity between SN 1999gi and SN 1999em is the polarization modulation seen across the H profile, especially the changes in the red emission wing of the profile (see L01a, Figs. 14, 15, and 16). Purely to highlight the possible similarity between SN 1999gi and SN 1999em, we show in Figure 13 the “intrinsic” SN polarization that results for SN 1999gi after removing an arbitrary (large) ISP compared with the observed polarization of SN 1999em (which is though to suffer minimal ISP) from a later epoch. While this comparison does not prove an intrinsic similarity between the polarization of SN 1999gi and SN 1999em since the ISP is not known (and different ISP values can even make polarization maxima become minima and vice versa), it does show that ISP values exist that do make the spectropolarimetry of SN 1999gi resemble that observed in SN 1999em. Regardless of the ISP, though, the strength of the line features in SN 1999gi is not significantly different from that observed in either SN 1999em or SN 1997ds.
Although the evidence for large ISPhost is compelling, we must consider arguments for significant intrinsic polarization for SN 1999gi as well. In fact, there are both theoretical and observational reasons supporting a large intrinsic SN polarization. We first present a theoretical argument. The low polarization observed in SN 1999em at early times coupled with the relatively low polarization constraints set for SN 1998A and SN 1997ds leads to the tentative conclusion that SNe II with significant hydrogen envelopes intact at the time of explosion are substantially spherical at early times. However, there is mounting evidence supporting the idea of strongly asymmetric explosions, including the temporal increase in polarization observed in SN 1999em. The observations of SN 1999em, coming on days 12, 45, 54, and 166 after explosion, as well as the observation of SN 1997ds days after explosion and SN 1998A days after explosion, all missed the crucial evolutionary phase at the end of the plateau, when the hydrogen envelope has nearly completely recombined, but before the SN begins the transition to the nebular phase. At this critical juncture the photosphere has receded through nearly the entire hydrogen envelope, yet a thermal photosphere with a large electron-scattering optical depth still exists. This creates an ideal situation for explosion asymmetry to be revealed by spectropolarimetry: if any epoch is to reveal the effects of great explosion asymmetry, this would seem to be it. At much earlier times the photosphere is located in the extended hydrogen envelope, and at much later times (i.e., the day 166 observation of SN 1999em), the electron-scattering optical depth may be quite small. Therefore, the timing of the observation of SN 1999gi is unique among the objects thus far studied, and it may not be fair to favor low intrinsic polarization based on comparisons with other SNe II observed at substantially earlier or later epochs.
A simple observational argument favoring significant intrinsic SN polarization follows from the few optical imaging polarimetric studies that have been done of nearly face-on spiral galaxies (e.g., Scarrott, Rolph, & Semple 1990; Scarrott et al. 1991). These studies generally find polarization vectors aligned parallel to the spiral arms (i.e., perpendicular to the line connecting a point with the galaxy’s center). From Figure 7, we see that SN 1999gi is nearly due north of the center of NGC 3184, which would predict , quite different from the measured value of . However, since the number of galaxies studied is very small and, unlike the l-o-s to a SN, optical imaging polarimetry does not probe very deeply into dusty regions (see, e.g., Jones 1997), the inconsistency between the observed polarization angle and that predicted may not be too significant. Also, the lack of appreciable spectral polarization angle variation (Figure 8) argues for a single, dominant, polarization source.

Given the preceding arguments and lacking additional polarimetric epochs or independent estimates of the ISP, it is quite difficult to assign a value to ISPhost with absolute confidence. On the whole, the low contrast of the line features, the excellent agreement between a Serkowski ISP curve and the observed continuum polarization shape, and the near constancy of the polarization angle with wavelength lead us to favor the interpretation that at least a majority of the observed polarization is due to ISPhost. We allow for the possibility, however, that SN 1999gi may still have significantly more intrinsic polarization than the other SNe II studied. From the limits prescribed by the strength of the line features and the goodness of the Serkowski ISP curve fit, our preferred interpretation of the data is that SN 1999gi is intrinsically polarized at . Low-contrast modulations (up to ) in the troughs of the strongest P-Cygni lines and across the entire H emission profile are also observed.
3.4 SN Spectropolarimetry as a Probe of Interstellar Dust in External Galaxies
Quantifying the reddening properties of interstellar dust in all but the closest external galaxies is difficult (see, e.g., Fitzpatrik 1998). The good agreement between the polarization of SN 1999gi and a Serkowski ISP curve (Figure 11) highlights a potentially powerful byproduct of SN spectropolarimetry: SNe can serve as probes of the interstellar medium of external galaxies, providing information about the alignment and size distribution of the galaxy’s dust grains, its reddening law, and its magnetic field strength and direction (see, e.g., Spitzer 1978).
Polarimetric studies of reddened Galactic stars whose light is intrinsically unpolarized have established a convincing correlation between the wavelength of maximum polarization () and the ratio of total to selective extinction (Whittet & van Breda 1978):
| (7) |
where . Values of generally fall in the range Å, with a mean value of Å providing the canonical (e.g., Savage & Mathis 1979). If we assume that most of the polarization of SN 1999gi is due to ISPhost, then our measured Å yields for the dust along this l-o-s in NGC 3184555We note that due to the vector nature of polarization, intrinsic SN polarization, even if independent of wavelength, could conspire with the ISP to produce a different from that produced by the ISP alone. Given the constancy of its polarization angle (§ 3.3; Figure 8c), however, this seems unlikely for SN 1999gi. . If the reddening to SN 1999gi could be determined, then the level of ISPhost relative to would give a measure of the efficiency of grain alignment and hence the strength of the magnetic field in NGC 3184 (e.g., Johnson 1982).
The value of is thought to be related to the average size of the polarizing dust grains through the relation (Whittet 1992)
| (8) |
where is the mean characteristic size of the dust grains and is the index of refraction, with being typical for silicates. A of Å therefore suggests dust grains in NGC 3184 along the l-o-s to SN 1999gi that have an average size of , similar to the inferred size of typical dust grains in the MW.
We conclude that the interstellar dust polarizing the light of SN 1999gi has a similar size distribution and reddening characteristics as average MW dust. This result is consistent with the results of the study by Riess, Press, & Kirshner (1996), in which the average value in galaxies hosting SNe Ia is shown to be consistent with a typical Galactic extinction law.
Spectropolarimetry of SNe can therefore be a powerful diagnostic tool in the study of the ISM of external galaxies. Of course, the possibility of intrinsic SN polarization complicates their use as probes. As more individual SNe continue to be studied with spectropolarimetry, however, the intrinsic polarization characterizing each SN class should become better defined. The best probes will be the types of SNe found to have consistently low intrinsic polarization. Although too few events have been studied to warrant firm generalizations, existing evidence suggests that SNe Ia (e.g., Hough et al. 1987; Wang, Wheeler, & Höflich 1997), and perhaps SNe II-P at early stages, may be the most promising candidates.
4 Conclusions
We present single-epoch optical spectropolarimetry of three SNe II during the photospheric phase. None of the objects shows evidence for significant circumstellar interaction, and all probably had most of their hydrogen envelope intact at the time of explosion. Our main results are as follows.
-
1.
SN 1997ds is a Type II event that bears spectral similarities to the Type II-P SN 1999em at a similar observational epoch. Lacking photometric data, however, we cannot assign it a definitive subclassification (i.e., II-P or II-L). Our spectropolarimetric observation of SN 1997ds took place between 33 and 46 days after the explosion, and we measure , with a distinct polarization modulation of in the H absorption trough. Modulations greater than in other absorption features are not seen. From reddening considerations we conclude that SN 1997ds is intrinsically polarized by .
-
2.
SN 1998A is a Type II event, sharing some photometric and spectroscopic properties with the unusual core-collapse event, SN 1987A. Our spectropolarimetry data were obtained between 11 and 30 days after the explosion, and we measure . From the low estimated degree of reddening, we conclude that the intrinsic polarization of SN 1998A is . Although we find no evidence for polarization modulations across strong line features, we note that our data are only sensitive enough to detect sharp features above .
-
3.
SN 1999gi is a Type II-P event, with a plateau that lasted at least until our spectropolarimetric observation took place, between 107 and 114 days after the explosion. The total flux spectrum of SN 1999gi is nearly identical to a spectrum of SN 1999em obtained at a similar epoch. SN 1999gi has a very high observed polarization, , with distinct changes of up to seen in the troughs of the strongest P-Cygni lines. A strong polarization change across the entire H profile is also seen. Since the spectral shape of the continuum polarization closely resembles a Serkowski ISP curve and is inconsistent with the wavelength-independent nature of electron scattering, we believe the majority of the observed polarization to be due to ISP from dust in the host galaxy, NGC 3184. Significant intrinsic SN polarization cannot be ruled out, however. Our preferred interpretation is that SN 1999gi is intrinsically polarized between and .
Although different in detail, SNe 1997ds, 1998A, and 1999gi all share common spectropolarimetric properties with SN 1999em. Most importantly, neither SN 1997ds nor SN 1998A show compelling evidence for large intrinsic polarization at the early phases studied. This furthers the argument that the electron-scattering atmospheres of SNe II with significant hydrogen envelopes may in general suffer from only modest asphericity during the early recombination phase. This is in contrast with what has been observed core-collapse events involving progenitors that have lost significant amounts of their envelopes prior to exploding (e.g., Tran et al. 1997; Wang et al. 2001), or are interacting with a dense CSM (Leonard et al. 2000a).
The number of core-collapse events studied in detail with spectropolarimetry is still quite small. However, the basic result that evidence for asphericity increases the deeper one probes into the heart of the explosion is consistent with this study. The possibility that SN 1999gi may have possessed a larger intrinsic polarization near the end of the plateau phase than the other events studied at earlier phases would also support this trend. These results therefore support the hypothesis advanced by L01a that distances derived to SNe II-P through the expanding photosphere method at early photospheric epochs do not suffer large uncertainties resulting from asphericity.
We thank Aaron Barth, Edward Moran, and Maryam Modjaz for assistance with the observations, and Tom Matheson and Weidong Li for useful discussions. Most of the data presented herein were obtained at the W. M. Keck Observatory, which is operated as a scientific partnership among the California Institute of Technology, the University of California, and the National Aeronautics and Space Administration. The Observatory was made possible by the generous financial support of the W. M. Keck Foundation. We are grateful to the Keck staff for their support of the telescopes. This research has made use of the NASA/IPAC Extragalactic Database (NED), which is operated by the Jet Propulsion Laboratory, California Institute of Technology, under contract with NASA. We have made use of the LEDA database (http://leda.univ-lyon1.fr). Our work was funded by NASA grants GO-7821, GO-8243, and GO-8648 from the Space Telescope Science Institute, which is operated by AURA, Inc., under NASA contract NAS 5-26555. Additional funding was provided to A. V. F. by NASA/Chandra grant GO-0-1009C, by NSF grants AST-9417213 and AST-9987438, by the Sylvia and Jim Katzman Foundation, and by the Guggenheim Foundation.
References
- (1)
- (2) Barbon, R., Benetti, S., Cappellaro, E., Rosino, L., & Turatto, M. 1990, A&A, 237, 79
- (3) Bloom, J. S., et al. 1999, Nature, 401, 453
- (4) Branch, D. 1987, ApJ, 320, L121
- (5) Cohen, J. G. 1973, ApJ, 186, 149
- (6) Cohen, M. H. 1996, The LRIS Polarimeter (Keck Observatory instrument manual), available at http://www2.keck.hawaii.edu:3636/
- (7) Cordes, J. M., & Chernoff, D. F. 1998, ApJ, 505, 315
- (8) Ferlet, R., Vidal-Madjar, A., & Gry, C. 1985, ApJ, 298, 838
- (9) Filippenko, A. V. 1982, PASP, 94, 715
- (10) Filippenko, A. V., & Moran, E. C. 1998, IAU Circ. No. 6809
- (11) Filippenko, A. V., et al. 2001, in preparation
- (12) Fitzpatrick, E. L. 1998, in Ultraviolet Astrophysics, Beyond the IUE Final Archive, ed. R. Gonzalez-Riestra, W. Wamsteker, & R. Harris (ESA SP-413) (Noordwijk: ESA), 461
- (13) Gaensler, B. M. 1998, ApJ, 493, 781
- (14) Heiles, C. 2000, AJ, 119, 923
- (15) Hobbs, L. M. 1984, ApJ, 280, 132
- (16) Höflich, P. 1990, A&A, 229, 191
- (17) Höflich, P. 1991, A&A, 246, 481 (H91)
- (18) Hough, J. H., Bailey, J. A., Rouse, M. F., & Whittet, D. C. B. 1987, MNRAS, 227, 1
- (19) Issa, M. R., MacLaren, I., & Wolfendale, A. W. 1990, A&A, 236, 237
- (20) Jeffery, D. J. 1991a, ApJS, 77, 405
- (21) Jeffery, D. J. 1991b, ApJ, 375, 264
- (22) Jeffery, D., & Branch, D. 1990, in Supernovae, eds. J. C. Wheeler, T. Piran, & S. Weinberg (Singapore: World Scientific), 149
- (23) Johnson, P. E. 1982, Nature, 295, 371
- (24) Jones, T. J. 1997, AJ, 114, 1393
- (25) Kiss, L., Sarneczky, K., & Sziladi, K. 2000, IAU Circ. No. 7344
- (26) Leonard, D. C., Filippenko, A. V., Barth, A. J., & Matheson, T. 2000a, ApJ, 536, 239
- (27) Leonard, D. C., Filippenko, A. V., & Matheson, T. 2000b, in Cosmic Explosions, ed. S. S. Holt & W. W. Zhang (New York: AIP), 165
- (28) Leonard, D. C., Filippenko, A. V., Ardila, D. R., & Brotherton, M. S. 2001a, ApJ, in press (L01a)
- (29) Leonard, D. C., et al. 2001b, PASP, submitted
- (30) Manchester, R. N. 1987, A&A, 171, 205
- (31) McCall, M. L. 1984, MNRAS, 210, 829
- (32) Munari, U., & Zwitter, T. 1997, A&A, 318, 269
- (33) Nakano, S., et al. 1999, IAU Circ. No. 7329
- (34) Oke, J. B., et al. 1995, PASP, 107, 375
- (35) Papaliolios, C., Darovska, M., Koechlin, L., Nisenson, P., Standley, C., & Heathcote, S. 1989, Nature, 338, 565
- (36) Patat, F., Barbon, R., Cappellaro, R., & Turatto, M. 1994, A&A, 282, 731
- (37) Patat, F., Boehnhard, H., & Delfosse, X. 1997, IAU Circ. No. 6774
- (38) Phillips, A. P., Pettini, M., & Gondhalekar, P. M. 1984, MNRAS, 206, 337
- (39) Qiu, Y. L., Qiao, Q. Y., Li, W. D., Hu, J. Y., & Esamdin, A. 1997, IAU Circ. No. 6773
- (40) Riess, A. G., Press., W. H., & Kirshner, R. P. 1996, ApJ, 473, 58 8
- (41) Ryu, K. S., Dixon, W., Hurwitz, M. Seon, K. I., Min, K. W., Edelstein, J. 2000, 529, 251
- (42) Sarneczky, K., Sziladi, K., Kiss, L., & Hornoch, K. 2000, IAU Circ. No. 7398
- (43) Savage, B. D., & Mathis, J. S. 1979, ARA&A, 17, 73
- (44) Scarrott, S. M., Rolph, C. D., & Semple, D. P. 1990, in Galactic an d Intergalactic Magnetic Fields, ed. R. Beck, P. P. Kronberg, & R. Wielebinski (Dordrecht: Kluwer), 245
- (45) Scarrott, S. M., Rolph, C. D., Wolstencroft, R. W., & Tadhunter, C. N. 1991, MNRAS, 249, 16
- (46) Schlegel, D. J., Finkbeiner, D. P., & Davis, M. 1998, ApJ, 500, 52 5
- (47) Schlegel, E. M. 1996, AJ, 111, 1660
- (48) Serkowski, K. 1973, in Interstellar Dust and Related Topics, ed. J. M. Greenberg and H. C. van de Hulst (Dordrecht: Reidel), 115
- (49) Serkowski, K., Mathewson, D. S., & Ford, V. L. 1975, ApJ, 196, 261
- (50) Spitzer, L., Jr. 1978, Physical Processes in the Interstellar Medium (New York: John Wiley & Sons)
- (51) Strom, R., Johnston, H. M., Verbunt, F., & Aschenbach, B. 1995, Nature, 373, 587
- (52) Taylor, J. H., Manchester, R. N., & Lyne, A. G. 1993, ApJS, 88, 5 29
- (53) Tran, H. D. 1995, ApJ, 440, 565
- (54) Tran, H. D., Filippenko, A. V., Schmidt, G. D., Bjorkman, K. S., Jannuzi, B. T., & Smith, P. S. 1997, PASP, 109, 489
- (55) Treffers, R. R., Peng, C. Y., Filippenko, A. V., Richmond, M. W., Barth, A. J., & Gilbert, A. M. 1997, IAU Circ. No. 6627
- (56) Trondal, O., Granslo, B. H., Kushida, R., Nakano, S., Yoshida, S., & Kadota, K. 1999, IAU Circ. No. 7334
- (57) Wang, L., Howell, D. A., Höflich, P., & Wheeler, J. C. 2001, ApJ, in press (astro-ph/9912033)
- (58) Wang, L., & Wheeler, J. C., & Höflich, P. 1997, ApJ, 476, L27
- (59) Wheeler, J. C. 2000, in Cosmic Explosions, ed. S. S. Holt & W. W. Zhang (New York: AIP), 445
- (60) Whittet, D. C. B. 1992, Dust in the Galactic Environment (Philadelphia: Institute of Physics Publishing, Inc.)
- (61) Whittet, D. C. B., Martin, P. G., Hough, J. H., Rouse, M. F., Bailey, J. A., & Axon, D. J. 1992, ApJ, 386, 562
- (62) Whittet, D. C. B., & van Breda, I. G. 1978, A&A, 66, 57
- (63) Wilking, B. A., Lebofsky, M. J., & Rieke, G. H. 1982, AJ, 87, 695
- (64) Williams, A., Woodings, S., Verveer, A., & Biggs, J. 1998, IAU Circ. No. 6805
- (65) Woodings, S. J., Williams, A. J., Martin, R., Burman, R. R., & Blair, D. G. 1998, MNRAS, 301, L5
- (66) Woosley, S. E., Pinto, P. A., Martin, P. G., & Weaver, T. A. 1987, ApJ, 318, 664
- (67) Yoshida, S., & Kadota, K. 2000, IAU Circ. No. 7375