X-Ray Absorption Associated with High-Velocity UV Absorbers
Abstract
We present Chandra observations of two radio-quiet QSOs, PG 2302+029 and PG 1254+047. PG2302+029 has an ultra high-velocity UV absorption system ( km s-1), while PG 1254+047 is a Broad Absorption Line (BAL) QSO with detached troughs. Both objects are X-ray weak, consistent with the known correlation between and the strength of the UV absorption lines. The data suggest that there is evidence that both objects are intrinsically weak X-ray sources, in addition to being heavily X-ray absorbed. The X-ray absorption column densities are cm-2 for neutral gas and the intrinsic emission spectra have . The data are fit best by including ionized (rather than neutral) absorbers, with column densities cm-2 and cm-2. The degrees of ionization are consistent with the UV lines, as are the total column densities if the strongest lines are saturated.
Dept. of Astronomy, University of Florida, Gainesville, FL 32611
Dept. of Physics & Astronomy, Ohio University, Athens, OH 45701
LHEA, NASA/GSFC, GreenBelt, MD 20771
NOAO, 950 North Cherry Ave., Tuscon, AZ 85719
1. Introduction
Almost all quasi-stellar objects (QSOs) are X-ray sources. The reprocessing of X-rays by matter along the line of sight to the QSO imprints informative features on the resulting spectrum. We are examining the X-ray properties of QSOs with intrinsic UV absorption lines. In this proceeding we discuss Chandra observations of the QSOs PG 2302+029 and PG 1254+047. The BAL QSO PG 1254+047 displays detached broad absorption lines ( km s-1 centered at -20,000 km s-1) in the UV (Hamann 1998). PG 2302+029 is peculiar for its ultra-high velocity ( km s-1) UV absorption lines with km s-1 (Jannuzi et al. 1996). The intrinsic nature of the absorber in PG 2302+029 was confirmed recently by line variability (Jannuzi et al. 2001). Both objects are characterized by being faint X-ray sources. Our aim is to determine the properties of the X-ray spectrum, search for any signs of absorption, and define the relationship between the UV/X-ray absorbers. If the X-ray and UV absorbers are the same, then the -56,000 km s-1 velocity shift of the UV absorption lines in PG 2302+029 is potentially resolvable with ACIS, given sharp features and adequate signal-to-noise ratio.
The absorption from this type of objects originates in an outflow of matter from the central engine of the QSO. Determining the relation between the gases producing the X-ray and UV absorption has profound implications on the physics of wind formation and acceleration (e.g. Mathur et al. 1995; Murray et al. 1995). Standard analysis, which uses the absorption line troughs to derive the optical depths and column densities, typically implies that the total column densities are about 2 orders of magnitude lower than the X-ray absorbing columns. However, the discrepancy could be alleviated if the UV lines are more optically thick than they appear, e.g. partial coverage fills the line troughs and thus hides larger column densities (Hamann et al. 1998).
2. Observations
PG 2302+029 and PG 1254+047 were observed by Chandra using the Advanced Imaging Spectrometer (ACIS) on 7 January 2000 and 29 May 2000, respectively. The most recent (2 November 2000 and 29 February 2001 for PG 2302+029 and PG 1254+047, respectively) re-processed data released by the CXC were used. No filtering for high background or bad aspect times was done since we found that the data were relatively free from such problems. Data extraction and calibration was performed using version 1.4 of CIAO. XSPEC was used for rebinning and spectral analysis. We created the response matrix and ancillary response files by relying on calibration data provided when the chip temperature during observations was .
We extracted the source counts from circular regions with radii of 5′′. Background regions were annuli with radii of 10′′ to 20′′. We obtained a total of counts for PG 2302+029 and counts for PG 1254+047. Table 1 gives a list of pertinent information about the two objects. The specta were binned to have at least 30 counts/bin (10 counts/bin for PG 1254+047). The spectral analysis discussed in this contribution includes energy bins below 0.5 keV. It has come to our attention that these bins may suffer from calibration problems. See Sabra & Hamann (2001) and Sabra et al. (2001) for a treatment where energy bins only above 0.5 keV are included.
| Object | Obs. Date | Exp. (ksec) | 1N (cm-2) | 2zem | zabs | B (mag) |
|---|---|---|---|---|---|---|
| PG 2302 | 2000-01-07 | 48 | 1.044 | 0.695 | 16.30 | |
| PG 1254 | 2000-05-29 | 36 | 1.024 | 0.870 | 16.15 |
1 Lockmann & Savage (1994). 2 NED.
3. Data Analysis and Results
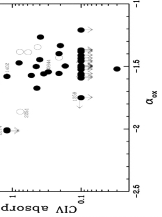
Our procedure for spectral fitting is the following. We start by fitting a power law continuum () absorbed only by the appropriate Galactic column density (Lockman & Savage 1994). Both the normalization of this continuum and its X-ray photon index, , are left as free parameters. The results are shown in Figure 1. The slopes are rather flat for QSOs, where usually (e.g. Laor et a. 1997; Reeves et al. 1997). The X-ray fluxes are low, leading to the steep for PG 2302+029 and PG 1254+047, respectively. These values are consistent with the correlation between and the equivalent width of C iv shown in Figure 2, which was adapted from Brandt et al. (2000). The correlation is indicative of intrinsic absorption: a large equivalent width results from an absorber that, in turn, is accompanied by an X-ray absorber thus steepening .


To test for absorption, we adopt a “normal” QSO continuum, specified by and (Laor et al. 1997), attenuated through a neutral absorber. The choice of determines the normalization of the powerlaw at 2 keV, , which we derive in the following way. We first calculate the rest-frame from the B-magnitude, including the appropriate Galactic dereddening and the k-correction (see Green 1996). The rest-frame and are related by . Therefore, , for . We experimented by adding neutral absorbers at the redshift of the QSO and at the redshift of the UV absorption lines. For PG 2302+029, the fits did not favour any particular redshift. The redshifts of the absorber and the QSO are too close to be resolved in PG 1254+047. In both cases, however, the X-ray absorption at the systemic velocity of the QSO leads to higher column densities (by a factor of less than 2). We hereafter fix the redshifts of the X-ray absorbers at those of the emission lines of the QSOs. The results are shown in Figure 3 below. The normalizations, based on higher energy channels where absorption has little effect, hint at intrinsic X-ray weakness, while the poor fits, especially at lower energies, hint at intrinsic absorption. The bad overall fit indicates that the observed X-ray weakness cannot be explained by absorption alone.
To study the possibility of both intrinsic X-ray weakness and absorption, we remove the constraint that and hence allow the normalization of the power law to vary. The fits improve drastically, though not to the extent of giving an acceptable fit (). The intrinsic power law flux density at 1 keV with these improved fits decreased by about an order of magnitude. We show the results in Figure 4.
The results from the above spectral fitting do not strongly support neutral absorption due to the large discrepancy between the data and the models at soft energies. Also, we know that there is not a neutral absorber with the above quoted column densities because the UV spectra do not contain low-ionization metal lines. To improve the fits, we experimented with absorption by ionized gas, and neutral and ionized partial coverage. We fix the ionization parameter U, the ratio of ionizing (above 13.6 eV) flux density to hydrogen density. Experiments showed that is consistent with UV data (Hamann 1998) and leads to . The partial covering fraction, , was fixed at 0.8 for PG 1254+047 because we found that it improved the quality of the fits. These values are consistent with absorption studies for such objects (e.g., Hamann 1998). Figure 5 displays the outcome.
The models in Figure 5 allow us to place limits on the column
densities of the absorbers. We find that for
PG 2302+029, , while for
PG 1254+047, , both at the
90% confidence level.


4. Conclusions
We have presented Chandra observations of PG 2302+029, a QSO that
shows ultra high-velocity UV absorption, and PG 1254+029, a BAL QSO. The
following points can be made:
1- The data suggest that there is evidence the both objects are intrinsically
X-ray weak, though the X-ray slope is normal.
The evidence is somewhat
stronger for PG 2302+029 given the higher number of counts.
No amount of absorbing column density was able to suppress the X-ray
flux down to the observed values while at the same time reproduce the overall
X-ray spectral shape. The intrinsic ’s are steep:
,
.
2- There is intrinsic X-ray absorption, most probably ionized with
and
cm-2,
cm-2 for 80%
partial coverage. The derived column densities are consistent with results
from the UV data, if the UV lines are very saturated.
3- We were not able to determine the redshift of the X-ray absorber
in PG 2302+029.


Acknowledgments.
FH and BMS wish to acknowledge support through Chandra grants GO 0-1123X and GO 0-1157X.
References
Brandt, W. N., Laor, A., & Wills, B. J. 2000, ApJ, 528, 637
Hamann, F. 1998, ApJ, 500, 798
Jannuzi, B. T., et al. 1996, ApJ, 470, L11
Jannuzi, B. T., et al. 2001, in preparation
Laor, A., et al. 1997, ApJ, 477, 93
Mathur, S., Elvis, M., & Singh, K. 1995, ApJ, 455, L9
Murray, N., Chiang, J., Grossman, J. A., & Voit, G. M. 1995, ApJ, 451, 498
Sabra, B. M., & Hamann, F. 2001, ApJ Letters, to be submitted
Sabra, B. M., et al. 2001, ApJ Letters, to be submitted
Reeves, J. N., et al. 1997, MNRAS, 292, 468