Spatially-Resolved O II Recombination Line Observations of the Ring Nebula, NGC 6720
Abstract
We present new long-slit CCD spectra of O II permitted lines and [O III] forbidden lines in the Ring Nebula NGC 6720. These observations provide spatially-resolved information on both O II and [O III] over the 70 diameter of the main shell. We find significant differences in the spatial distribution of the O II lines and [O III] 4959. The [O III] emission follows the H emission measure, peaking slightly radially inward from the H peak. The O II emission peaks inside the [O III] emission. This suggests that radiative recombination may not be the primary mechanism for producing the O II lines. O+2 abundances derived from O II lines are 5-10 times larger, than those derived from [O III] in the region within 20 of the central star. Outside of this region, however, the O II and [O III] derived abundances agree to within 0.2-0.3 dex. The electron temperature derived from [O III] lines rises smoothly from about 10,000 K in the outer shell to about 12,000 K in the center; we see no evidence for a temperature jump that would be associated with a shock. If temperature fluctuations are responsible for the discrepancy in O+2 abundances, the average temperature would have to be approximately 6,500 K in the He+2 zone and about 9,000 K in the outer shell in order to force the [O III]-derived abundance to equal that derived from O II. This would conflict with ionization models for PNe which predict that the temperature is higher in the He+2 region close to the ionizing star. We therefore argue that temperature fluctuations can not explain the abundance discrepancy. A comparison of the spatial distribution of O II emission with the location of dusty knots shows that the O II recombination lines do not peak where the dense knots are located, creating difficulties for models which explain the recombination line/forbidden line discrepancy by density fluctuations. We examine the possibility high-temperature dielectronic recombination in a central hot bubble enhances the recombination line strengths in the central part of the nebula. However, comparison of recombination rates with collisional excitation rates shows that the increase in recombination emission due to dielectronic recombination at 105 K is not sufficient to overcome the increase in collisonally-excited emission. We are unable to find a completely satisfactory model to explain the discrepancy between recombination line and forbidden line abundances.
1 The O II Recombination Line Problem in Ionized Nebulae
For approximately the past three decades, analysis of collisionally-excited forbidden lines in the optical/UV wavelength region has been the primary means of determining the physical conditions and element abundances in H II regions and planetary nebulae (PNe). Studies of these emission lines have been a fundamental source of data for the study of the chemical evolution of galaxies other than the Milky Way and for comparison with models of stellar nucleosynthesis. For almost as long a time, however, there has been the nagging question of the reliablity of such abundance measurements. The crux of the problem is that collisionally-excited lines in the optical/UV part of the spectrum have large excitation energies (1-10 eV), and thus the excitation rates are acutely sensitive to electron temperature. Peimbert (1967) pointed out that if significant fluctuations about an average temperature are present, the collisionally-excited line emission will be weighted toward hotter regions because of the exponential dependence on , while the Balmer recombination lines will be preferentially produced in cooler regions because of the inverse dependence on . In this case, ion abundances derived from the forbidden lines could be systematically underestimated by a large amount. It has not yet been demonstrated definitively that significant deviations from a smoothly-varying temperature structure exist in photoionized nebulae, other than the gradients expected from ionization/thermal equilibrium models. Determining whether such temperature fluctuations exist and their magnitude is challenging observationally, and it is strongly debated whether temperature fluctuations have a significant effect on abundance determinations based on collisionally-excited lines (see Mathis 1995 for a balanced discussion).
It is often suggested that observations of recombination lines from the heavy elements would provide more reliable measures of element abundances than the commonly observed collisionally-excited lines. This is because recombination lines have very similar dependences on electron temperature, so the ratio of a given recombination line to, say, H is nearly independent of . Thus, heavy element abundances could be calculated from recombination lines with virtually no systematic uncertainties, in principle. The main drawback is that recombination lines from elements heavier than He are intrinsically faint, typically less than 1% of H, because of the direct scaling of the emissivities with ion abundance. As a result, few measurements of heavy element recombination lines have been published.
Nevertheless, improved spectrographs and detectors have enabled high quality measurements of heavy element recombination lines, particularly O II, to be made in recent years (Liu et al., 1995; Esteban et al., 1998; Liu et al., 2000). At the same time, improved computations of effective recombination coefficients for transitions of heavy element recombination lines (e.g., Storey 1994) have made the analysis more reliable. For the Orion Nebula, Esteban et al. (1998) found that O II recombination lines gave somewhat higher O+2/H+ than the [O III] collisionally-excited lines, and interpreted this in terms of modest temperature fluctuations. On the other hand, Liu et al. (1995, 2000) have found that O II and [O III] yield spectacularly discrepant O+2 abundances in the planetary nebulae (PNe) NGC 7009 and NGC 6153 – with the O II lines giving abundances 5-6 times larger than those derived from [O III]. These differences are so large that they can not be accounted for in the context of the Peimbert (1967) small temperature fluctuation formulation.
We have been obtaining new measurements of O II recombination lines in PNe to further understand the cause of the O II - [O III] discrepancy. In Dinerstein, Lafon, & Garnett (2001) (hereafter Paper II), we will present measurements of integrated O II lines and derived abundances for a sample of ten PNe, and compared these abundances with published results based on [O III]. The main results from Paper II are summarized in Dinerstein, Lafon, & Garnett (2000) and Garnett & Dinerstein (2001). In particular, we find: (1) a wide range of values for the difference between O II- and [O III]- derived abundances (log O+2/H+ anywhere between 0.0 and 0.8 dex); (2) an inverse correlation between log O+2/H+ and nebular diameter; and (3) that O II lines arising from levels populated mainly by dielectronic recombination are especially enhanced. In a companion program, we have obtained deep long-slit observations of some PNe to study and compare the spatial distribution of both O II and [O III] emission, in the hope that this would provide new clues toward understanding the source of the abundance discrepancies. In this paper we describe the results for the largest object in our sample, the Ring Nebula NGC 6720.
2 Long-slit Spectroscopy of O II Lines in the Ring Nebula
We have observed several Galactic planetary nebulae in long-slit mode in order to study the spatial distribution of emission from both the O II recombination lines and [O III] forbidden lines. These observations were obtained on the clear nights 6-7 June 1999 with the 2.3m Bok reflector at Steward Observatory, using the Boller & Chivens spectrograph. The spectrograph has a 1200800 Loral CCD with 15m pixels, corresponding to 083 per pixel at the detector. The four-arcminute long slit thus covers about 285 rows on the detector. We used an 832 line/mm grating in second order to cover the spectral range 4150-5000 Å. With a 25 slit, the spectral resolution was in the range 2.1-2.3 Å, with the best resolution set at approximately 4650 Å. In our Ring Nebula observations, the spatial profiles of stars along the slit had a FWHM of approximately 25. We centered the long slit on the NGC 6720 central star, with the slit at a position angle of 91∘, where the PA is measured from N through E. We made four 15-minute exposures at this position.
The two-dimensional data were processed by standard methods. The wavelength solution for the spectra was determined from the positions of He-Ar lines from calibration lamp observations taken through the same spectrograph setup. The root-mean-square residuals from a fourth-order polynomial solution were approximately 0.1 Å. The object frames were divided by a normalized flat-field constructed by combining observations of the illuminated dome and the twilight sky. The spectra were corrected for atmospheric extinction using standard Kitt Peak National Observatory extinction coefficients; and finally, the spectra were placed on a relative photometric scale using a spectrometer sensitivity function derived from observations of standard stars from the list of Massey et al. (1988). Note that because of the narrow slit, absolute spectrophotometry was not possible; however, the relative end-to-end photometric calibration is good to about 3%; the flat-field uncertainty adds another 1% to the errors.
After calibration, the four individual frames were combined to form a single image, and the sky background was subtracted. At this time we also extracted a section of the frame 131 pixels (109″) wide containing only the bright emission from the nebula (along the east-west direction), and rectified the image to align the centroid of the central star with the rows of the image, to ensure that features in each emission line lined up spatially. We saw no variation in the background between the four separate observations, so we averaged the frames before subtracting the background to improve the signal/noise for the sky determination. The sky level along each column was determined by a linear fit to the background in regions along each column outside the bright part of the nebula. Note that the Ring Nebula has an extended halo outside the bright inner nebula (Chu, Jacoby, & Arendt, 1987). The faint emission from this halo is seen in the brightest lines in our spectrum, H, H, and [O III] 4959 Å. The halo emission extends across the entire slit; however, this emission has a surface brightness of less than 1% of the surface brightness in the bright shell. Therefore, subtraction of the halo component will have little effect on the line ratios we derive in the inner nebula.
The final processing of the data involved extracting spatial cuts of various emission lines from the image. The extraction method was similar to that used for extracting one-dimensional stellar spectra, except that we did the extraction along lines of constant wavelength. As part of the extraction we subtracted the nebular and stellar continuum by fitting to line-free regions of continuum near the wavelengths of each extracted emission line. The result was an array of pure emission line flux vs. spatial position for each extracted line. Note that continuum subtraction by this method does not take into account absorption lines in the central star spectrum, or in starlight scattered by dust within the nebula, that may coincide with an emission line. The effect of stellar absorption will manifest itself as peculiar emission line ratios at the position of the central star, and in general we will exclude the regions including the central star from the discussion; the effects of scatterd starlight will be much smaller, and in any case would mean that the permitted lines are systematically even stronger than observed. Figure 1 shows examples of extracted spatial profiles for a few emission lines. Figure 2 shows an expanded view of the spectral region around 4661 Å for two different positions along the slit. Figure 2 shows that, although [Fe III] 4658 is significantly stronger than O II 4661 in the inner part of the Ring Nebula, the two lines are readily distinguished and can be deconvolved accurately.
3 Analysis of Emission Line Profiles
3.1 Interstellar Reddening
We can estimate the interstellar reddening along the slit from the H/H intensity ratio. This ratio depends slightly on the nebular electron temperature . For NGC 6720 is between 10,000 K and 12,000 K (Guerrero, Manchado & Chu, 1997); in this range of , the H/H ratio is 0.47 (Hummer & Storey, 1995). The relation between observed and reddened line ratios is given by
| (1) |
where Iobs and Iint are the observed and intrinsic line intensities, and f() f(H) = 0.13 for = H, from the average interstellar reddening curve of Savage & Mathis (1979). The coefficient (or, more commonly, (H)) is then the logarithmic ‘extinction’ at H – more accurately, a combination of absorption and scattering.
Figure 3(a) shows the spatial variation of (H) we derive along the slit for NGC 6720. Generally, we see values for ranging between 0.1 and 0.2 along the slit, with possibly a slow increase from east to west along the slit. The reddening values we derive are consistent with the values obtained by Barker (1987) and Guerrero, Manchado & Chu (1997). Note the spike at the position of the central star, where the line ratio is very likely affected by stellar absorption. Note also the steep upturn at the E end and the downturn at the W end. We suspect these steep changes are not real, but artifacts resulting from small misalignment of the H and H extractions, combined with a small variation of the focus, at positions where the nebular surface brightness profile is declining rapidly (see Figure 1).
Nevertheless, the correction for reddening relative to H is small for all lines in our observed spectral region along most of the slit, less than 10% over the region 38″ from the central star. This is illustrated in Figure 3(b), where we show the ratio of I(H)/0.47 I(H). If there were no reddening, this ratio would be close to unity; Figure 3(b) shows that this ratio is within 10% of unity over the region where the emission is bright. If we ratio lines in the blue half of the spectrum to H and those in the redward half to H, the error accrued is less than 5% over the regions of interest in the nebula. In the end, we chose this method to correct the line intensities. The regions of the nebula beyond 40″ from the central stars have too low S/N for the faint lines to contribute to our analysis, so we will exclude them from the following discussion.
3.2 Electron Density and Electron Temperature
Our spectrum includes the [Ar IV] 4711, 4713 Å doublet; the ratio of these two lines is sensitive to the electron density , similar to the [S II] 6717, 6731 Å pair. There is one complication in using the [Ar IV] ratio: the 4711 Å line is blended with the He I 4713 Å line at low resolution. This is apparent in our spectrum by a larger line width for the 4711 Å line, as well as a shift in wavelength from the inner nebula, where [Ar IV] is strong and He I weak, to the outer ring where He I predominates.
We can correct for the He I 4713 Å contamination by subtracting a scaled version of the He I 4471 Å line profile. Guerrero, Manchado & Chu (1997) estimated from [S II] line ratios in the Ring, obtaining values of 200-600 cm-3. At these densities, collisional excitation has a small effect on the 4713/4471 line ratio, so we choose to neglect it. For 10,000 K, the 4713/4471 intensity ratio is 0.11, based on the emissivities computed by Benjamin, Skillman, & Smits (1999). Assuming a constant temperature in the He I zone, we multiply the 4471 Å fluxes by 0.11, then subtract the result from the 4711 Å line fluxes. The correction to the 4711 Å fluxes are small for the inner nebula, where He I emission is faint, and greatest in the outermost parts of the nebula.
We estimated from two regions on either side of the central star, using the atomic code described by Shaw & Dufour (1995), assuming an electron temperature = 11,000 K. East of the central star, the mean [Ar IV] ratio was 1.330.03 (where the error is the rms scatter about the mean), which corresponds to = 740250 cm-3, while west of the central star, the [Ar IV] ratio was 1.340.06, which yields = 660500 cm-3. These values are consistent with the densities obtained by Lame & Pogge (1994), Liu & Barlow (1997) and Guerrero, Manchado & Chu (1997). Barker (1987) derived densities approximately twice as large as ours; however, this is the result of using atomic data for [S II] that are now out of date. We have re-computed using Barker’s data and the Shaw & Dufour program, and obtain densities similar to the ones we obtain from [Ar IV].
Since we observe both [O III] 4363 Å and [O III] 4959 Å we can estimate the electron temperature across the nebula. Figure 4(a) plots the variation of derived from the [O III] ratio, showing a smooth increase in from the shell to the interior of the nebula, from about 10,000 K in the shell to about 12,000 K in the center. This behavior is in good agreement with that derived by Guerrero, Manchado & Chu (1997).
For comparison, we plot in Figure 4(b) the [O III] 4959/H line ratio across the slit. We note several features in the plot. First, the line ratio shows only a slow variation across most of the nebula, with a shallow minimum in the center. Second, we see a steep decline in [O III]/H at about 36″ from the central star in both directions. This most likely corresponds to the transition from O+2 to O+ near the edge of the bright shell. Third, [O III]/H increases again outside the bright shell, corresponding to the inner halo region, which evidently has rather high excitation and/or high ionization along these sightlines.
Note that the minima in do not correspond to the minima in [O III]/H, but rather lie just interior to the low-excitation zones. then appears to increase a bit in the region of low [O III]/H; this increase may be a result of radiation hardening combined with inefficient cooling in the low-ionization zone of the nebula. The signal/noise in our 4363 Å line observation is too low to determine in the halo region.
3.3 Determination of Ion Abundances Across the Nebula
Now that we have established the variation of across NGC 6720, we can proceed to determine abundances for the ions of interest. For this study, we will derive abundances relative to H+ for O+2 (from both [O III] 4959 Å and O II 4661 Å), C+2 (from C II 4267 Å), He+, and He+2, as a function of position along our slit. Since the electron densities across the nebula are relatively small, we can assume the low-density limit and compute the ion abundances analytically.
The abundance of any ion relative to H+ derived from the ratio of the intensity of a transition to the intensity of H is given by
| (2) |
where represents the volume emission coefficient for a given emission line . For collisionally-excited lines in the low-density limit, the analysis in section 5.9 of Osterbrock (1989) applies.
The volume emission coefficient for a collisionally-excited line is given by
| (3) |
where is the collision strength for the transitions observed, is the statistical weight of the lower level, and is the excitation energy of the upper level. For [O III] we use the collision strengths from Lennon & Burke (1994), interpolated to a temperature of 11,000 K; the collision strength for the 4959, 5007 Å lines varies by only 8% between 10,000 K and 15,000 K, so the assumption of a constant introduces only a small error.
For recombination lines, the emission coefficient is given by
| (4) |
where () is the effective recombination coefficient for the recombination line . For the O II 4661 Å line, we use the effective recombination coefficient derived by Storey (1994) for LS-coupling in Case B. For H and He II we used the recombination coefficients from Hummer & Storey (1995), while for He I we used the emissivities computed by Benjamin, Skillman, & Smits (1999). We employ a value (O II 4661)/(H) = 1.29 for = 10,000 K; this ratio varies by only 4% between 10,000 K and 15,000 K. Similarly, (He II 4686) = 11.9(H) for = 11,000 K, varying by only 9% between 10,000 K and 20,000 K, and (He I 4471) = 0.501(H) at = 10,000 K and = 100 cm-3; collisional excitation increases (4471) by only 5% at = 104 cm-3 (Benjamin, Skillman, & Smits, 1999). Given the relatively low densities we derive for the Ring, and the small variation across the nebula, we can neglect collisional excitation of He I. Finally, we computed C+2 abundances from the C II 4267 Å line using the Case B effective recombination coefficient from Davey, Storey, & Kiselius (2000) and Liu et al. (2000). At = 10,000 K, (C II 4267)/(H) 9.1.
4 Results
Figure 5 shows a comparison of the spatial distribution of the [O III] 4959 Å emission and the O II 4661 Å emission in the Ring. It is readily apparent that the [O III] and O II lines have distinctly different spatial distributions. The [O III] emission essentially follows the H emission, peaking slightly interior to the H peak, consistent with the ring-like morphology of the nebula. In contrast, the O II emission peaks the [O III]-emitting region. This behavior is remarkable - if the O II 4661 emission arises mainly from radiative recombination of O+2 to O+, then one would predict that the O II emission would peak from the central star than the [O III] emission, where the ionization decreases. Clearly, the O II and [O III] emission lines arise under dissimilar conditions.
In Figure 6 we show the computed O+2 abundances as derived from the forbidden lines and the recombination lines, using the electron temperatures shown in Figure 4(a). Again, we see that O+2 as derived from [O III] peaks in the shell while O+2 derived from the recombination line is more concentrated toward the center of the nebula. To demonstrate that the results are not a result of low signal/noise in the 4661 Å line, we also plot in Figure 6 the abundances we obtain from binned (summed over 8-12″) spectra extracted at several intervals along the slit. The agreement between the binned spectra and the point-by-point measurements is excellent.
Another thing that is apparent upon inspection of Figure 6 is that the discrepancy between the [O III] and O II abundance results is not constant; the discrepancy is much larger for the central regions of the nebula, where O+2(O II) is as much as ten times larger than O+2([O III]), than in the bright shell, where the difference is not more than a factor of two. Similar behavior has also been seen by Liu et al. (2000) in the planetary nebula NGC 6153, another shell-like nebula. This suggests a common origin for the forbidden-line/recombination-line abundance discrepancy.
The helium abundance derived from our observations is shown in Figure 7, with the total He/H plotted as the solid line and the He+2 contribution as the dashed lines. The plot shows that the helium abundance remains rather constant across the Ring Nebula, apart from possibly a small upturn at the edges of the shell. This increase is seen in He+, and may be due to the assumption of a constant electron density across the shell; however, the effect is not large. The average helium abundance we derive, He/H 0.12, is about 10% smaller than that derived by Guerrero, Manchado & Chu (1997), He/H 0.135. The reason for the discrepancy is not clear. We do agree, however, that the helium abundance is essentially constant across the Ring.
Finally, in Figure 8 we display the C+2 abundances derived from our measurements of C II 4267, compared with the O+2 derived from O II. The C+2 abundance shows an increase toward the nebula center similar to that of O+2, although the increase is not as strong. We find that C+2/O+2 1 in the bright shell, decreasing to 0.5 (approximately the solar value) in the center. This variation could be due to ionization effects (increasing importance of C+3 in the interior), a real C/O abundance variation across the nebula, or a variation in the emission mechanism. Note that the C+2 abundance in the shell is similar to that derived for NGC 6720 (C/H 610-4) from the C III] 1908 Å feature by Kwitter & Henry (1998).
Barker (1987) derived C+2 abundances in the Ring Nebula from measurements of C II 4267 and from measurements of C III] 1908. He found that the abundances derived from these two lines differed by a large factor in the central part of the Ring Nebula, but that the difference decreased radially outward and essentially disappeared in the bright shell. This behavior is very similar to what we see for abundances derived from O II and [O III]. This suggests a common mechanism affecting emission lines from both O+2 and C+2.
5 Discussion
Our long-slit observations of the Ring Nebula demonstrate that the O II and [O III] lines have very different spatial distributions. The big surprise is that the peak recombination line emission occurs in the region interior to the [O III] zone, in contrast to the expectations if the O II emission is the result of radiative recombination of O+2. Either the O II lines are enhanced in the inner nebula or the electron temperature derived from [O III] is greatly overestimated in the nebular interior.
In Paper II, we identify other surprising results. We find that the size of the O II-[O III] abundance discrepancy, log(O+2/H+), is anticorrelated with PN diameter and mean emission measure. We also see that O II lines that arise from levels populated mostly by dielectronic recombination are more discrepant than other O II lines when compared with the forbidden lines. These results, together with our new observations of the Ring Nebula, must be giving us important clues regarding the origin of the discrepancy between the recombination lines and the forbidden lines. Here we discuss some of the possible mechanisms for producing the abundance discrepancies; other possibilities will be examined in Paper II.
5.1 Temperature Fluctuations
Temperature fluctuations have been invoked to explain why collisionally-excited lines give lower abundances than the recombination lines (Peimbert, Storey, & Torres-Peimbert, 1993). Nevertheless, the abundance discrepancies observed in NGC 7009 (Liu et al., 1995), NGC 6153 (Liu et al., 2000), and the Ring Nebula (this paper) are so large that they are are no longer in the regime where Peimbert’s formalism of small temperature fluctuations applies. For example, in the Ring Nebula we find that the O II lines yield abundances as much as ten times larger than the [O III] lines in the center of the nebula. If we assume that the O II lines give the correct abundances, we can estimate the magnitude of temperature fluctuations needed to obtain the same abundances from the [O III] lines. Forcing the [O III] lines to give the same abundances requires an average temperature 6,500 K in the center of the nebula, and 9,000 K in the shell, whereas we derived [O III] 12,000 K in the center and [O III] 10,000 K in the shell. Using the formalism of Peimbert (1967), these temperature differences imply 0.03 in the shell and 0.16 in the center of the nebula! = 0.16 corresponds to rms temperature variations of 40%. It is difficult to imagine how such wild temperature variations could go unobserved [see Fig. 4(a)].
Still, we saw in Figure 4(a) that there is a radial gradient in T[O III] within the Ring Nebula. This variation could give rise to a noticeable term if the temperature measured from the summed spectrum differs significantly from the emission-measure-weighted average temperature. We compare the [O III] temperature derived from the Ring Nebula spectrum summed along the entire slit with the average [O III] temperature weighted by the [O III] 4959 intensity along the slit. The temperature derived from the full-slit spectrum is 10,950 K, while the emission-weighted average temperature is 10,860 K. Using equation (4) of Garnett (1992), the measured difference in T[O III] corresponds to = 0.003. This is too small to have a significant impact on abundances. Nevertheless, such gradients in are likely to be common in H II regions and PNe, and should be taken into account whenever possible.
Liu et al. (2000) have also argued that temperature fluctuations are unable to account for the large discrepancy between forbidden-line and recombination-line abundances in NGC 6153. They derived from both the [O III] lines and from the Balmer jump/line ratio in NGC 6153; the Balmer jump temperature was determined to be 3000 K smaller than the [O III] temperature. Nevertheless, Liu et al. (2000) found that this difference in could account for only one-third of the factor of nine difference in the derived O+2 abundances in NGC 6153. Furthermore, they found that abundances derived from measurements of collisionally-excited [O III], [Ne III], and [S III] IR fine-structure lines agree very well with the results from corresponding optical forbidden lines. Since the IR fine-structure lines have a very weak temperature dependence compared to the optical forbidden lines, it is difficult to reconcile the good agreement in IR and optical abundances with the idea of significant temperature fluctuations. These results and ours are evidence that temperature fluctuations can not account entirely for the large differences between recombination lines and forbidden lines in PNe.
5.2 Shocks
Shocks can provide a source of additional heating for a photoionized gas, and have been proposed as a mechanism to account for temperature fluctuations (Peimbert, Sarmiento, & Fierro, 1991). Shocks can heat a photoionized plasma by transforming the kinetic energy of a flow (e.g., a stellar wind) into random thermal energy, and strong shocks heat the ambient medium to very high temperatures. High-excitation lines such as [O III] 4363 Å would be preferentially enhanced behind shocks in photoionized nebulae. Peimbert, Sarmiento, & Fierro (1991) showed that an interstellar shock superposed on the spectrum of an H II region could lead to a spuriously high measured electron temperature, and thus to underestimated abundances from collisionally-excited lines in the optical spectrum.
In a PN, a shock front is expected to be formed at the interface between a fast stellar wind from the central star and the slowly-expanding circumstellar envelope. The fast stellar wind would carve out a hot bubble in the interior of the nebula which would emit primarily in X-rays. Clear evidence for such hot bubbles has been found recently for a small number of PNe from X-ray imaging (Kastner et al., 2000; Kastner, Vrtilek, & Soker, 2001; Chu et al., 2001).
Evidence that shocks enhance temperatures in photoionized gas in an observable way is generally lacking, however. Physically, a shock is an extremely thin structure, only a few particle mean free paths thick; the high-temperature recombination zone downstream from the shock is generally only a few times 1015 cm deep in interstellar shock models (Shull & McKee, 1979; Raymond, 1979; Binette, Dopita, & Tuohy, 1985). Therefore, one might expect the shock front to be manifested by a sharp, narrow spike in the spatial profile of . Examination of Figure 4 shows that we observe no sharp jumps in across the Ring, only a smooth increase from the shell to the center. The rms deviations from this smooth profile are less than 200 K. One must consider that the spatial resolution of our data, 25 21016 cm at a distance of 600 pc, is larger than the expected width of the shock cooling zone, and that we are observing a temperature averaged along a chord through the nebula.
Another problem that must be considered is the structure of the PN and its effect on the propagation of the shock. Frank (1994) has simulated the radiation-gas dynamical evolution of a PN in the context of the interacting-winds model (Kwok, Purton, & Fitzgerald, 1978; Kwok, 1994). These models begin with a slowly-expanding red giant wind. The PN expansion is initiated by the onset of a slow, high-density “superwind” which lasts a few thousand years, creating a dense shell of gas around the central star. Following the end of the superwind, a high-velocity, low-density “fast wind” ensues, clearing out a central cavity and exposing the hot stellar core. Frank followed the gas dynamics and ionization/thermal evolution of the nebula simultaneously.
In the model, the fast wind drives a shock into the superwind, creating a hot central bubble. The low density in the bubble allows radiation from the hot stellar remnant to penetrate and ionize the dense shell. The high pressure in the hot bubble drives a forward shock into the dense shell. Figure 2 of Frank (1994) shows a snapshot of the dynamical, thermal, and ionization properties of the nebula at a point which is comparable to the current state of the Ring Nebula. At this stage, the nebula is fully ionized, and the temperature profile in the dense shell is determined by radiative cooling and heating. At this point, the forward shock is nearly isothermal and does not produce a noticeable temperature jump. This behavior is consistent with the lack of a temperature discontinuity in our observations of the Ring Nebula. However, a sharp jump in is seen at the contact discontinuity between the hot bubble and the dense shell in Frank’s models. One might then expect to see sharp jump in observed at this point in a PN. We do not observe such a jump in the Ring, but this may be due to insufficient spatial resolution.
Considering the results of our observations and Frank’s models leads us to conclude that shocks can not explain the large discrepancy between forbidden-line and recombination-line abundances, although shocks should be present. Spectroscopic observations with better spatial resolution should show whether shocks produce any significant effect on temperature profiles in PNe.
5.3 Abundance Inhomogeneities
Torres-Peimbert, Peimbert, & Peña (1990) and Peimbert (1993) suggested that abundance inhomogeneities could produce anomalously strong recombination lines from heavy elements in PNe. If the central region of the PN contains hydrogen-depleted material, the metal-rich interior would be expected to have a low electron temperature due to strong cooling by IR fine-structure line emission. Thus, optical forbidden lines would be weakened in this region while the recombination lines are enhanced. The optical forbidden lines would be produced mainly in the H-rich shell and would reflect the conditions and abundances there.
A number of observable consequences result from this model. First, it might be expected that the central nebula would be enriched in helium as well, if the C and O enhancements result from incomplete mixing of He-burning products. Figure 7, however, shows that this is not the case for the Ring Nebula – He/H is essentially constant across the nebula. Alternatively, one might hypothesize that the central region is enhanced in C and O by a wind from a H- and He- depleted central star. However, the central star of the Ring Nebula is classified as H-rich (Napiwotski & Schönberner, 1995; Napiwotski, 1999).
Second, one would expect the observed to decrease toward the center of the nebula. From Figure 4, however, we see that toward the center. One could get around this by arguing that the derived temperature toward the center does not reflect the conditions in the interior, but rather in the shell projected along the line of sight. 111Another possible argument is that the higher temperature in the central nebula is the result of shocks located preferentially along those lines of sight. The kinematics discussed in Guerrero, Manchado & Chu (1997) appear to rule out such a situation. Such a condition could occur if the nebula were shaped like a lozenge or an ellipsoid with the minor axis along the line of sight to the central star. In this configuration, gas near the minor axis would be closer to the central star and be subject to a stronger ionizing radiation field (i.e., a higher ionization parameter), and thus would have a higher . This configuration conflicts with the model for the Ring presented by Guerrero, Manchado & Chu (1997). Based on the measured velocity field in the nebula, they argue that the Ring is a prolate ellipsoid with the major axis pointing at a small angle to the line of sight, a configuration roughly orthogonal to the one discussed above.
Finally, IR fine-structure line measurements do not show much evidence for the large abundance enhancements needed to explain the observed recombination line emission (Dinerstein et al., 1995; Liu et al., 2000). (See also the discussion in section 5.1.) From the above discussion, we conclude that the strong recombination line emission in the central region of the Ring does not reflect an H-poor, metal-enriched interior.
Liu et al. (2000) have also considered the question of abundance inhomogeneities. They first determined that simple density inhomogeneities in a nebula with homogenous abundances could not account consistently for the strengths of forbidden lines, recombination lines, and the Balmer line ratios in NGC 6153. They next considered super-metal-rich (SMR) condensations, and found that they could account for the emission line strengths in NGC 6153 with a model having dense, H-depleted inclusions that occupy a very small fraction of the volume. In this model, the heavy element recombination lines arise predominantly in the cool, dense condensations, while the forbidden lines are emitted primarily in the hotter, low-density component. Liu et al. (2000) were able to produce models of this kind that were able to reproduce the strengths of the recombination lines as well as the optical, UV, and IR collisionally-excited lines.
Chemical inhomogeneities might be expected in a PN, since C, N, and He are produced in different regions of the progenitor star. Convective mixing during the red giant phase could homogenize the PN envelope, but such mixing might never be complete, especially in very late stages prior to envelope ejection. Hydrodynamic instabilities would promote clumping in the gas, and a clumpy stellar wind may eject chemically inhomogeneous knots of gas. Evidence for knots of H-depleted material is seen in several PNe, for example Abell 30 (Jacoby, 1979).
On the other hand, there are a number of difficulties with this model as an explanation for the apparent abundance discrepancies. Liu et al. (2000) noted the difficulty of maintaining the postulated dense knots in pressure equilibrium with the surrounding nebula. Another difficulty is the roughly equal enhancements of C, N, O, and Ne in the recombination line emission. This is inconsistent with the nucleosynthesis predicted for PN progenitors, which generally synthesize C, N, and He, but not O or Ne.
In Paper II, we show that the difference between forbidden-line and recombination-line abundances in PNe is inversely correlated with the nebular emission measure and diameter: in compact, high-surface-brightness PNe the forbidden lines and recombination lines give essentially identical abundances, while large, low-surface-brightness PNe show large abundance discrepancies. This result suggests that the discrepancy between forbidden lines and recombination lines is apparent only when a PN is large and evolved. It is difficult to imagine why hydrogen-depleted knots would condense out of the PN only at late times. If hydrogen-depleted clumps were present in the ejected envelope one would expect them to be present at early times as well. Evaporation of grains from dense globules can not produce the SMR clumps required – enhanced recombination lines are seen not only for O and C, but also for N and Ne, which largely do not condense onto grains. One possibility is a clumpy stellar wind from an H-poor central star, and indeed, the central star of NGC 6153 shows O VI emission indicating an H-depleted wind. However, as noted above, the Ring Nebula central star is H-rich. Obviously, a better understanding of the ejection and clumping of material in the nebula is needed to determine if this model can successfully account for PN emission.
An obvious consequence of the SMR knot model is that one might expect to see strong O II recombination lines associated with the presence of dense knots. Numerous small cometary knots have been observed in the Helix Nebula NGC 7293 (Vorontsov-Velyaminov, 1968), and have been identified as elongated, dense, dusty globules with a surface photoilluminated by the central star (O’Dell & Handron, 1996). Their origin has not been determined yet, and spectroscopic data on physical conditions and metallicities are not yet available. However, they (or the shadow regions behind them) are logical places to look for emission anomalies, such as enhanced recombination line emission.
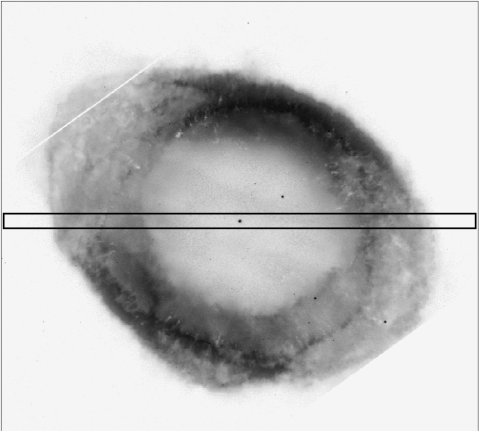
Imaging with the Hubble Space Telescope has revealed the presence of dusty, possibly cometary, knots in the Ring Nebula as well. We have extracted WFPC-2 images of the Ring Nebula from the HST archive (taken under program GO-7632). We obtained images in F502N ([O III]5007), F658N ([N II] 6584), and F469N (He II 4686). The three individual exposures in each filter were combined and mosaiced after removing cosmic rays and image defects. We combined the final filter images to highlight the dusty globules. (The STScI Office of Public Outreach web site oposite.stsci.edu has a nice color image of the Ring Nebula which clearly shows the dusty knots.) We rotated the image so that the E-W direction was aligned with the horizontal axis, and overlaid our spectrograph slit on the image. The upper panel of Figure 9 shows a negative composite image of NGC 6720 in the F469N, F502N, and F658N filters, with our slit outlined. Numerous dusty knots are seen in this image, beginning about 20 from the central star. High-resolution IR imaging of NGC 6720 shows that bright H2 S(1) emission follows the rings of dusty knots (Kastner et al., 1994), indicating the presence of neutral and molecular material as well.
The lower panel in Figure 9 shows the distribution of O+2/H+ across this section of the Ring. Comparison with the upper panel shows that the peak of the recombination line emission does not coincide with the region of dusty knots, but rather lies interior to the rings of knots. The discrepancy between the abundance derived from O II and that derived from [O III] is largest in the innermost regions and is declining in the regions where the dusty knots are seen. Although the spatial resolution of our spectrum is poor compared to the HST imaging, we conclude that the knots observed in the Ring are not the primary source for the enhanced recombination emission. Any metal-rich knots of the kind proposed by Liu et al. (2000) must be largely invisible at HST resolution.
5.4 Enhanced Dielectronic Recombination
We show in Paper II (also Dinerstein, Lafon & Garnett 2000 and Garnett & Dinerstein 2001) that some O II lines yield much larger O+2 abundances than other lines. In particular, the 4590, 4596 Å lines from multiplet 15 are especially strong. The levels that these lines arise from are populated mainly by dielectronic recombination (DR). The large abundances obtained from these lines, even after taking into account the low-temperature dielectronic recombination rates (Nussbaumer & Storey, 1984), indicate that low-temperature dielectronic recombination at nebular temperatures does not account for the great strength of the lines. We therefore investigate the possibility that the dielectronic recombination rates in the affected PNe could be severely underestimated. This could be the case if the rate coefficients to upper levels are grossly underestimated (which does not seem very likely for all of the ions involved), or if there is a component of dielectronic recombination that is not accounted for in standard PN emission models. We hypothesize that this could be high-temperature dielectronic recombination in a hot central bubble; dielectronic recombination rates are enhanced by as much as a factor of ten at 105 K compared to the rates at nebular temperatures of 104 K (Nahar & Pradhan, 1997; Nahar, 1999).
The spatial distribution of O II emission in our long-slit observations the Ring Nebula would appear to be consistent with this hypothesis. The O II lines are strongest just interior to the main shell, in the region where the interface between a hot bubble and the denser ionized shell would be expected. The spatial profile of the O II emission peak is fairly broad, perhaps broader than might be expected from such a transition layer; however, we have not accounted for the relatively low spatial resolution of the spectra nor for the effects of nebular geometry. Unfortunately, no X-ray images of the Ring Nebula exist, so we have no information on the presence or absence of hot gas.
At what temperature would the recombination coefficient be large enough to account for the increased emission? Let us assume that the O II emission in the main shell represents the intrinsic O+2 abundance of (71)10-4, at a temperature of 10,000 K. The maximum derived O+2 abundance is (242)10-4, or about 3.5 times the abundance in the shell. Equality of abundance would then imply that the recombination coefficient in the inner nebula is higher by the same factor. Based on the theoretical recombination coefficients tabulated by Nahar (1999), this is true if the material producing the excess O II emission is at 65,000 K. Similarly, the C+2 abundance in the inner nebula is about twice as large as that in the shell. The recombination rate for C III C II is a factor two larger at 35,000 K than the rate at 10,000 K. On the other hand, Savin (2000) points out that the high- DR rate from these LS-coupling calculations may be underestimated by perhaps a factor of 1.5-2 because of missing autoionizing levels, which would act in favor of our model.
One difficulty that arises is that any O+2 ions recombining in this hot zone would be expected to emit very strongly in [O III] and a large increase in and in the forbidden line strengths might be observed. This problem could be mitigated if the density in the hot zone is very small; the contribution to [O III] emission from the hot zone would then be overwhelmed by the strong emission from the main shell. We can check this by comparing the collisional excitation rates for [O III] with the recombination rates as a function of temperature. For the enhanced DR model to work, two conditions must be satisfied: first, there must be a temperature regime in which the recombination rate increases faster with increasing than the collisional excitation rate , at temperatures where DR dominates; and second, there must be a temperature regime in which / exceeds the value of this ratio at 10,000 K, the electron temperature we measure in the shell of the ring.
Figure 10 shows the results of a comparison of recombination rates to collisonal excitation rates for O+2, where we plot vs temperature for both [O III] 4959,5007 and 4363. Here we have computed the total recombination rate and assumed that the effective recombination rates to individual levels scale identically. We used the radiative recombination rates formulated by Pequignot, Petitjean, & Boisson (1991), together with the dielectronic recombination rates from Nussbaumer & Storey (1983) and Badnell & Pindzola (1989) to estimate . The collisional rates were computed using the averaged temperature-dependent collision strengths of Baluja, Burke, & Kingston (1981), Aggarwal (1983), and Lennon & Burke (1994). Figure 10 shows that while the first condition listed above is met, the second is not. The plot shows that does increase faster than in the range 4.4 log 5.5. On the other hand, while we do see that /(4959,5007) for log = 5.1-5.7 exceeds the ratio at 104 K, the largest difference is only about 0.1 dex. This is not nearly enough to explain the large difference between recombination line abundances and forbidden line abundances in NGC 6720. Furthermore, Figure 10 shows us that for log 4.5 /(4363) never exceeds the value at 104 K. In order for this model to work, the theoretical DR rates would have to be increased by a large factor, which appears to be outside the estimated uncertainties in current DR rate calculations. We are thus forced at the present time to conclude that the recombination/collisonal excitation ratio can not be increased sufficiently by the presence of hot gas, for any combination of gas temperatures, to account for the observations, at least with conventional physics.
6 Summary and Conclusions
We have demonstrated in this paper that the O II and [O III] lines in the Ring Nebula have distinctly different spatial distributions in the nebula; similar results have been found by Liu et al. (2000) for NGC 6153. The permitted line emission peaks closer to the central star than the forbidden line emission. This spatial distribution appears to be inconsistent with a model in which the permitted lines arise mainly from radiative recombination of O+2 in the transition zone to O+ in the bright shell. In order to force the abundances from the [O III] lines to agree with those derived from O II would require such large temperature fluctuations that it would be difficult to hide them. Furthermore, it is difficult to reconcile large temperature fluctuations with the good agreement between optical and far-IR measurements of forbidden lines in NGC 6153. Thus, it appears clear that temperature fluctuations can not account for most of the discrepancy between forbidden-line and recombination-line abundances in planetary nebulae.
Nor do we find that C+2 and O+2 derived from the optical recombination lines have similar overabundances relative to those obtained from the collisionally-excited lines in the Ring Nebula. Comparing our C+2 abundance with that obtained by Kwitter & Henry (1998) from the UV C III] lines, we find that the RL abundance for C+2 is about a factor of two higher, while for O+2 the RLs give an abundance that is a factor of four higher than that derived from [O III]. Thus it appears that the cause of the abundance discrepancy need not apply equally to all of the species.
Based on the enhanced strengths of O II multiplet 15, the correlation of the abundance discrepancy with nebular size (Paper II, Garnett & Dinerstein 2001), and the spatial distribution of the O II emission, we proposed that dielectronic recombination in a hot gas bubble might greatly enhance the emission rates of the permitted lines above the rates at nebular temperatures. A comparison of recombination rates versus collisional excitation rates for O+2 showed, however, that the increase in recombination rates due to dielectronic recombination at 105 K is not enough to overcome the increase in collisionally-excited emission. Unless the theoretical DR rates are greatly underestimated, this does not appear to be a viable explanation for the recombination line - forbidden line discrepancy. In any case, our results suggest that we need to understand better the effects of DR on recombination line strengths in general.
A model in which the recombination emission arises mainly in cold, H-depleted clumps (Liu et al., 2000) could explain the enhanced recombination line emission in PNe, although we are unable to find a close correlation between enhanced O II emission and the locations of dusty globules in the Ring Nebula. Furthermore, we would also need to understand why such clumps are only seen in the larger, more evolved PNe. Perhaps this is a selection effect related to the surface brightness. Spectroscopy and imaging with high spatial resolution of other PNe should provide more clues to the nature of the relation between recombination line enhancement and nebular diameter.
Unfortunately, we are not able to convincingly reconcile any of the proposed models to explain the RL enhancements with all of the observations of NGC 6720 and NGC 6153. We present our results here in the hope that it will inspire new thinking on the physics behind emission processes in photoionized nebulae.
What are the consequences for abundance measurements from forbidden lines? The results are a bit mixed at the present time. The agreement in abundances derived from optical/UV forbidden lines and IR lines measured by for NGC 6153 (Liu et al., 2000) offers strong evidence that temperature fluctuations do not have sufficient magnitude to significantly affect forbidden-line abundances. On the other hand, there is a significant discrepancy between the Balmer discontinuity temperature and the [O III] temperature in NGC 6153. It is possible that this discrepancy merely reflects variations in temperature across the nebula. As we have seen, the [O III] temperature is not constant across the Ring Nebula, and such a variation is expected based on ionization models. A detailed observational study of the spatial profile of various temperature indicators across nebulae would provide a clearer picture of the temperature variation within planetary nebulae.
References
- Aggarwal (1983) Aggarwal, K. M. 1983, ApJS, 52, 387
- Badnell & Pindzola (1989) Badnell, N. R. & Pindzola, M. S. 1989, PhRvA, 39, 1690
- Baluja, Burke, & Kingston (1981) Baluja, K. L., Burke, P. G. & Kingston, A. E. 1981, JPhB, 14, 119
- Barker (1987) Barker, T. 1987, ApJ, 322, 922
- Benjamin, Skillman, & Smits (1999) Benjamin, B. A., Skillman, E. D., & Smits, D. P. 1999, ApJ, 514, 307
- Binette, Dopita, & Tuohy (1985) Binette, L., Dopita, M. A., & Tuohy, I. R. 1985, ApJ, 297, 476
- Chu et al. (2001) Chu, Y.-H., Guerrero, M. A., Gruendl, R. A., Williams, R. M., & Kaler, J. B. 2001, ApJL, in press (astro-ph/0101444)
- Chu, Jacoby, & Arendt (1987) Chu, Y.-H., Jacoby, G., & Arendt, J. A. 1987, ApJS, 64, 529
- Davey, Storey, & Kiselius (2000) Davey, A. R., Storey, P. J., & Kiselius, R. 2000, A&AS, 142, 85
- Dinerstein et al. (1995) Dinerstein, H. L., Haas, M. R., Erickson, E. F., & Werner, M. W. 1995, ASP Conf. Ser. 73: From Gas to Stars to Dust, p. 387
- Dinerstein, Lafon, & Garnett (2000) Dinerstein, H. L., Lafon, C. P., & Garnett, D. R. 2001, in Asymmetrical Planetary Nebulae II: From Origins to Microstructures, eds. J. Kastner, N. Soker, and S. Rappaport (ASP Conf. Ser. 199), p. 301
- Dinerstein, Lafon, & Garnett (2001) Dinerstein, H. L., Lafon, C. P., & Garnett, D. R. 2001, ApJ, in preparation (Paper II)
- Esteban et al. (1998) Esteban, C., Peimbert, T., Torres-Peimbert, S., & Escalante, V. 1998, MNRAS, 295, 401
- Frank (1994) Frank, A. 1994, AJ, 107, 261
- Garnett (1992) Garnett, D. R. 1992, AJ, 103, 1330
- Garnett & Dinerstein (2001) Garnett, D. R. & Dinerstein, H. L. 2001, RMxAASC, in press (astro-ph/0104145).
- Guerrero, Manchado & Chu (1997) Guerrero, M. A., Manchado, A., & Chu, Y.-H. 1997, ApJ, 487, 328
- Hummer & Storey (1995) Hummer, D. G., & Storey, P. J. 1995, MNRAS, 297, 1073
- Jacoby (1979) Jacoby, G. H., 1979, PASP, 91, 574
- Kastner et al. (1994) Kastner, J. H., Gatley, I., Merrill, K. M., Probst, R., & Weintraub, D. A. 1994, ApJ, 421, 600
- Kastner et al. (2000) Kastner, J. H., Soker, N., Vrtilek, S. D., & Dgani, R. 2000, ApJ, 545, L57
- Kastner, Vrtilek, & Soker (2001) Kastner, J. H., Vrtilek, S. D., & Soker, N. 2001, ApJ, 550, L189
- Kwitter & Henry (1998) Kwitter, K. B., & Henry, R. B. C. 1998, ApJ, 493, 247
- Kwok (1994) Kwok, S. 1994, PASP, 106, 344
- Kwok, Purton, & Fitzgerald (1978) Kwok, S., Purton, C.R., & Fitzgerald, P.M. 1978, ApJ, 219, L125
- Lame & Pogge (1994) Lame, N.J., & Pogge, R.W. 1994, AJ, 108, 1860
- Lennon & Burke (1994) Lennon, D. J., & Burke, V. M. 1994, A&AS, 103, 273
- Liu & Barlow (1997) Liu, X.-W., & Barlow, M. J. 1996, MNRAS, 279, 511
- Liu et al. (1995) Liu, X.-W., Storey, P. J., Barlow, M. J., & Clegg, R. E. S. 1995, MNRAS, 272, 369
- Liu et al. (2000) Liu, X.-W., Storey, P. J., Barlow, M. J., Danziger, I. J., Cohen, M., & Bryce, M. 2000, MNRAS, 312, 585
- Massey et al. (1988) Massey, P., Strobel, K., Barnes, J. V., & Anderson, E. 1988, ApJ, 328, 315
- Mathis (1995) Mathis, J. S. 1995, RMxAASC, 3, 207
- Nahar (1999) Nahar, S. 1999, ApJS, 120, 131
- Nahar & Pradhan (1997) Nahar, S., & Pradhan, A. K. 1997, ApJS, 111, 339
- Napiwotski (1999) Napiwotski, R. 1999, A&A, 350, 101
- Napiwotski & Schönberner (1995) Napiwotski, R., & Schönberner, D. 1995, A&A, 301, 545
- Nussbaumer & Storey (1983) Nussbaumer, H., & Storey, P. J. 1983, A&A, 126, 75
- Nussbaumer & Storey (1984) Nussbaumer, H., & Storey, P. J. 1984, A&AS, 56, 293
- O’Dell & Handron (1996) O’Dell, C. R., & Handron, K. D. 1996, AJ, 111, 1630
- Osterbrock (1989) Osterbrock, D. E., 1989, Astrophysics of Ionized Gaseous Nebulae and Active Galactic Nuclei (Mill Valley: University Science Books)
- Peimbert (1967) Peimbert, M. 1967, ApJ, 150, 825
- Peimbert (1993) Peimbert, M. 1993, RMxAA, 27, 9
- Peimbert, Sarmiento, & Fierro (1991) Peimbert, M., Sarmiento, A., & Fierro, J. 1991, PASP, 103, 815
- Peimbert, Storey, & Torres-Peimbert (1993) Peimbert, M., Storey, P. J., & Torres-Peimbert, S. 1993, ApJ, 414, 626
- Pequignot, Petitjean, & Boisson (1991) Pequignot, D., Petitjean, P., & Boisson, C. 1991, A&A, 251, 680
- Raymond (1979) Raymond, J. C. 1979, ApJS, 39, 1
- Savage & Mathis (1979) Savage, B. D., & Mathis, J. S. 1979, ARAA, 17, 73
- Savin (2000) Savin, D. W., 2000, RMxAASC, 9, 115
- Shaw & Dufour (1995) Shaw, R. A., & Dufour, R. J. 1995, PASP, 107, 896
- Shull & McKee (1979) Shull, J. M., & McKee, C. F. 1979, ApJ, 227, 131
- Storey (1994) Storey, P. J. 1994, A&A, 282, 999
- Torres-Peimbert, Peimbert, & Peña (1990) Torres-Peimbert, S., Peimbert, M., & Peña, M. 1990, A&A, 233, 540
- Vorontsov-Velyaminov (1968) Vorontsov-Velyaminov, B. A. 1968, in Planetary Nebulae, IAU Symposium 34, edited by D. E. Osterbrock and C. R. O’Dell (Reidel, Dordrecht), p. 256