IRAS 11590–6452 in BHR 71 – a binary protostellar system?
Abstract
New AAT near-infrared and SEST 12CO observations are combined with existing ISO mid-infrared and ATCA cm radio continuum observations to examine the protostellar content of the Bok globule BHR 71. Together with observations of Herbig-Haro objects, these data show: (1) Two protostellar sources, IRS1 and IRS2, with a separation of 17″ (3400 AU) are located within BHR 71. (2) Each protostar is driving its own molecular outflow. The outflow from IRS1 is much larger in extent, is more massive, and dominates the CO emission. (3) Both protostars are associated with Herbig-Haro objects and shock excited 2.122 µm H2 =1-0S(1) emission, which coincide spatially with their CO outflows. (4) IRS1 is associated with cm continuum emission, with a flat or rising spectrum which is consistent with free-free emission, a signpost of protostellar origin.
1 Introduction
BHR 71 (Bourke et al. 1995a,b) is a well isolated Bok globule located at 200 pc, which harbors a highly collimated bipolar outflow (Bourke et al. 1997 – hereafter B97). The outflow is driven by a very young Class 0 protostar with a luminosity of 9 .
This paper brings together new observations with existing observations to show that BHR 71 contains two embedded protostars with a separation of 3400 AU. Each protostar is driving a molecular outflow seen in CO, but only one appears to be associated with a substantial amount of circumstellar material. The observations suggest that BHR 71 may contain an embedded binary protostellar system.
2 Observations
Near-infrared observations were undertaken with the 128128 HgCdTe array camera IRIS on the Anglo-Australian Telescope (AAT). Mounted at the f/36 Cassegrain focus IRIS provided a field of view of approximately 100″ with a resolution of 079 pixel-1. A 44 mosiac at K′ (2.11 µm) with 90″ offsets between frames was obtained on 1992 February 15, with an integration time of 200s/frame. A 33 mosaic in the H2 =1-0S(1) transition at 2.12 µm (1% bandpass) with 80″ offsets was obtained on 1993 January 11, with an integration time of 60s/frame. Standard data reduction was performed with the Starlink FIGARO data reduction package.
Observations of the 12CO transition at 230537.99 MHz were obtained with the 15-m Swedish ESO Submillimetre Telescope (SEST) during 2000 May. The backend used was an acousto-optical spectrometer providing a channel separation of 43 kHz (0.055 km s-1) over 2000 channels. The observations were performed in dual beam-switching mode with a beam separation of 11′47″ in azimuth. Systems temperatures of 220 K were recorded during the observations. A small 13 point map with 30″ offsets about the position of the embedded source BHR 71-mm (B97) was made, with an integration time of 60s/point. The beamsize at this frequency is 23″.
BHR 71 was observed by the Infrared Space Observatory (ISO) on 1996 August 19 as part of program DMARDONE. Observations in the LW2 (5.0–8.5 µm) and LW3 (12.0–18.0 µm) bands were obtained with a field of view of 90″. Full details of the observations can be found in van den Ancker, Mardones & Myers (2001; see also Myers & Mardones 1998).
The Australia Telescope Compact Array (ATCA)111 The ATCA is part of the Australia Telescope which is funded by the Commonwealth of Australia for operation as a National Facility managed by CSIRO. was used to obtain images of BHR 71 at 3 and 6 cm (8.64 and 4.80 GHz respectively) as part of program C368 (Wilner et al. 2001). Observations were made on 1994 November 12 with the 6D configuration, observing both frequencies simultaneously with 128 MHz bandpasses. The data was reduced with MIRIAD and imaged using natural weighting, resulting in beamsizes of 2″ at 3 cm and 4″ at 6 cm. Full details can be found in Wilner et al. 2001.
3 Results
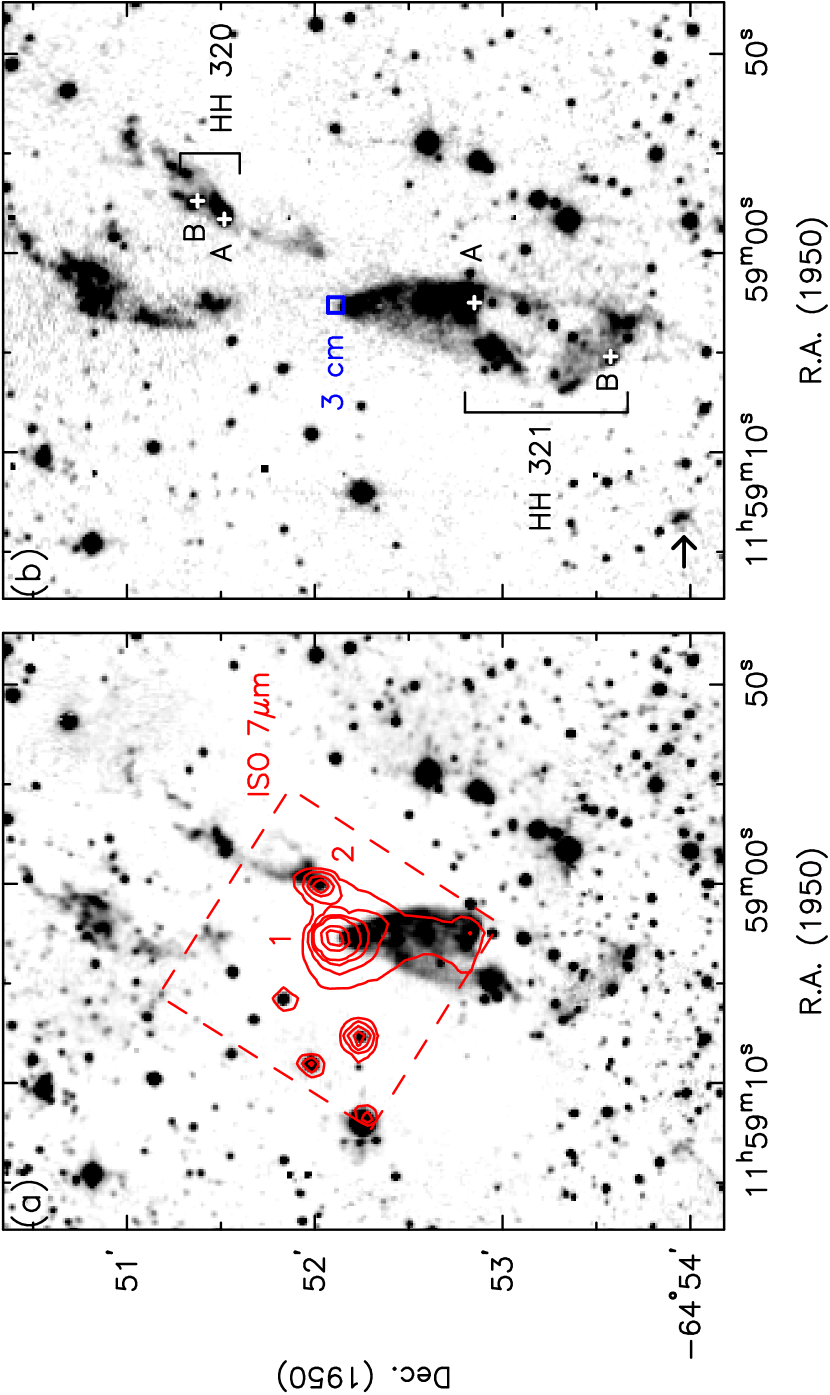
The near-infrared (NIR) images are shown in Figure 5. The K′ image is shown in (a), and the narrowband 2.12 µm image in (b). No continuum subtraction has been performed on the narrowband image. It is immediately evident by comparison of the two images that most of the non-stellar emission is due to the emission in the H2 =1-0S(1) line. This is most likely due to shocks in the outflowing gas (Eislöffel 1997). In BHR 71 the large scale CO outflow lies at a PA of 165° (B97) and so is well aligned with the near-infrared emission.
Mid-infrared (MIR) emission in the ISO LW2 band is overlayed on the K′ image in Fig. 5(a), labelled as “ISO 7µm”. Two of the 7 µm sources appear to be located at the apexes of NIR emission, strongly suggesting that they are associated with the emission. Source “1” (hereafter IRS1) lies at the apex of the reflection nebulosity seen also in the I band image presented by B97, which is associated with the large blue-shifted CO outflow lobe. IRS1 is also co-incident with the position of the mm source BHR 71-mm, also known as IRAS 11590-6452 (B97). No such counterpart exists for source “2” (hereafter IRS2), which is the weaker of the two sources at 7 µm. The fluxes for IRS1 and IRS2 in the ISO LW2 (7 µm) and LW3 (15 µm) bands are listed in Table 1. IRS2 is not seen directly at 2 µm. The NIR feature coincident with IRS2 in Fig. 5(a) is non-stellar, by comparison of its PSF with stars in the same image.
One centimeter continuum source was detected toward BHR 71, at both 3 and 6 cm (Wilner et al. 2001). The position of the source at 3 cm is indicated in Fig. 5(b) and is listed in the notes to Table 1. The free-free emission coincides with the position of IRS1 and has a spectral index at centimeter wavelengths that is consistent with a flat or rising spectrum due to free-free emission, a signpost of protostellar origin (Rodríguez 1994).
Corporon & Reipurth (1997) discovered two Herbig-Haro associations in BHR 71 – HH 320 and HH 321. Their locations are shown on Fig. 5(b). The positions of the HH objects as listed in Corporon & Reipurth (1997) are incorrect (P. Corporon, private communication). As discussed below, the plate solutions for their S II image have been redetermined and the positions of HH 320 and HH 321 remeasured. The correct positions, accurate to 1″, are given in Table 1. From Fig. 5(b) it can be seen that HH 320 is coincident with the NIR emission associated with IRS2, while HH 321 is coincident with the NIR emission associated with IRS1.
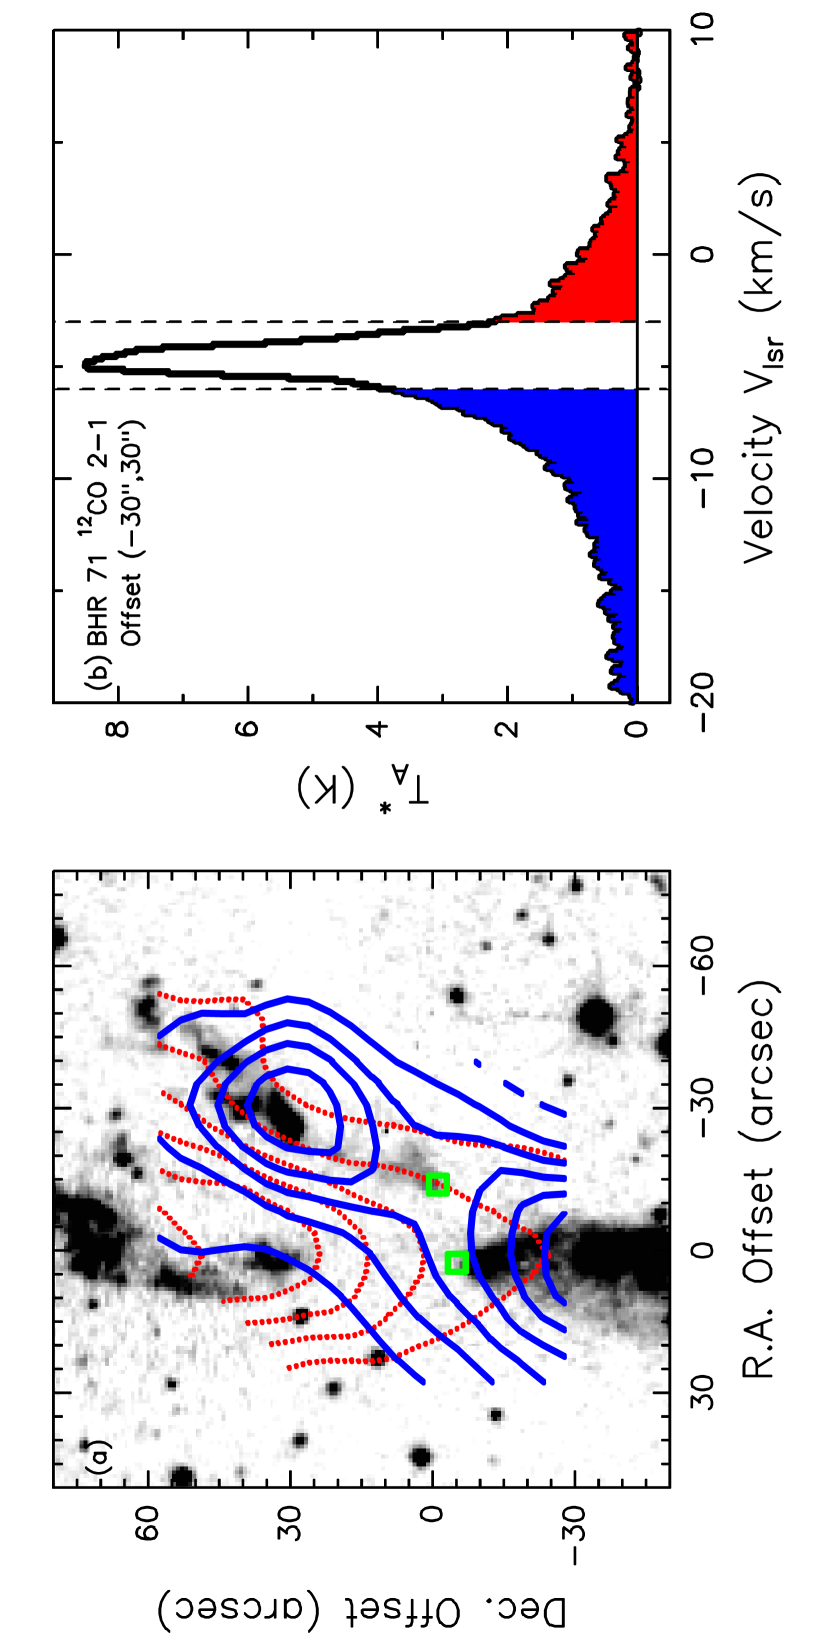
In Figure 5(a) is shown an enlarged view of the central part of the 2.12 µm image presented in Fig. 5(b). Indicated on this figure are the locations of the ISO sources IRS1 and IRS2 (unfilled squares). Overlayed on the figure are contours of integrated 12CO emission, with solid contours representing emission that is blue-shifted ( km s-1) with-respect-to the cloud systemic velocity ( km s-1; B97), and dotted contours representing red-shifted emission ( km s-1). The large scale CO outflow mapped by B97 is evident as open blue- and red-shifted contours, orientated approximately north-south with IRS1 lying between them. On scales larger than is mapped in the present CO observations this outflow has a position angle of 165°. Closed contours of blue-shifted emission peak at the position of HH 320.
In Figure 5(b) is shown the CO spectrum at the (″,30″) offset position (HH 320). The high velocity outflow wing emission at this position due to IRS1 (red-shifted) and IRS2 (blue-shifted) is clearly seen.
In order to determine accurately the ISO positions and the relative positions of the centimeter source and HH objects it was necessary to register the images to the same spatial system. First, a plate solution for a 40′ FOV Digital Sky Survey (DSS) image centered on BHR 71 was determined by comparison with 25 stars from the HST Guide Star Catalog (GSC). Using both the corrected DSS image and the GSC, plate solutions for the I band image and the S II image (Corporon & Reipurth 1997 – kindly provided in digital form by P. Corporon) were determined, using 14 stars common to all three bands. The uncertainty in positions measured from these frames is believed to be 1″, by comparison with the GSC and with each other.
The plate solution for the NIR images was determined using stars common with the I band image, 20 for the K′ image and 10 for the narrowband 2.12 µm image, respectively. Finally, the ISO 7 µm plate solution was determined using the three ISO sources visible in Fig. 5(a) and not associated with NIR nebulosity. The positions of the HH objects were measured directly from the corrected S II image, using the peak positions due to their non-symmetric shape. All positions quoted here are believed to be accurate to 1″.
4 Discussion
4.1 Two protostars – two outflows
The data presented here clearly indicates that two protostellar sources are present in BHR 71, each driving its own molecular outflow. IRS1 and its large-scale outflow has been discussed in detail by B97. The spectacular shock chemistry in the outflow has been studied by Garay et al. (1998). B97 discovered extended 1.3 mm emission associated with IRS1 and suggested that this is due to a massive circumstellar disk.
IRS2 has been noted previously (Myers & Mardones 1998). The data presented here shows that it is driving a compact CO outflow and is associated with near-infrared molecular hydrogen emission (Fig. 5(a)), which is coincident with HH 320 and most likely shock excited (Eislöffel 1997). Earlier evidence for the blue-lobe can be seen in the channel maps of the IRS1 outflow presented in B97. Their Figure 6 shows the emission from the CO transition, and the outflow associated with IRS2 can be seen in the velocity range km s-1.
Comparison of the I band image and the IRS1 outflow suggests that its blue lobe has broken through the near side of the globule (B97). The presence of HH objects in the blue lobe of the IRS2 outflow suggests that this outflow is also penetrating the near side of the globule. The relative mass of the blue and red outflow lobes of IRS1 suggests that the red lobe of the IRS1 outflow has not penetrated the far side of the globule (B97). It is likely that IRS1 and IRS2 are located at a similar depth within the globule from the near side, and that their angular separation of 17″ is a good indication of their physical separation, which is therefore 3400 AU for the assumed distance of 200 pc.
The limited CO observations do not reveal a red-shifted lobe to the IRS2 outflow. Due to the large inclination of the IRS1 outflow to the line-of-sight, both blue- and red-shifted outflow emission is seen in the SE part of the IRS1 outflow (B97), which probably masks any emission from the red-shifted lobe of the IRS2 outflow. However, the NIR image shows a knot of H2 line emission, arrowed in Fig. 5(b), which is a possible counterflow to the IRS2 blue-shifted outflow lobe. A line drawn from this knot through and extending past IRS2 bisects the limb-brightened conical reflection nebulosity (connecting IRS2 and HH 320) at the base of the blue-outflow lobe of IRS2. Taking this to define the outflow axis, the IRS2 outflow has a P.A. of °.
Combining the IRS2 CO data with the CO data of B97 for IRS2 allows for an estimation of the CO excitation temperature , though the signal-to-noise of the latter data set is poorer, and the sampling grids are different. As no isotopic data are available, optically thin conditions are assumed, which implies 10 K. The mass of the blue-shifted emission in the IRS2 outflow is 0.004 , significantly less than the 0.06 in the blue-shifted gas of the SE lobe of the IRS1 outflow (B97 - using CO data and assuming optically thin conditions). The IRS1 outflow is moderately optically thick (; B97), so the optical depth of the IRS2 outflow would have to be significantly greater to modify this comparison. Although significantly less massive than the IRS1 outflow, the IRS2 outflow is still able to produce shock-excited H2 emission and HH objects.
Previous observations by B97 show that IRS1 is a Class 0 protostar. Compared to IRS1, IRS2 is much weaker at 7 µm and drives a much less massive outflow, and is not detected at 1.3 mm (§ 4.2). This suggests that IRS2 is more evolved than IRS1 and is most likely a Class I protostar.
4.2 A binary protostellar system?
The presence of two sources in BHR 71 with a separation of 3400 AU, neither detected at wavelengths 7 µm, and both driving molecular outflows, suggests that a binary protostellar system has formed within the globule. Observations by B97 show that strong 1.3 mm continuum emission is associated with the protostellar pair, but the emission is highly peaked on IRS1, and no obvious extension including IRS2 is seen (their Figs. 9 & 13). The lack of mm emission and the weakness of the 7 µm emission compared to IRS1 suggests that IRS2 is not surrounded by a significant amount of circumstellar dust. This situation is similar to that observed in Bok globule CB230 (Launhardt 2001). High-angular resolution observations (2″) of CB230 show compact mm emission associated with only one component of a NIR protostellar pair separated by 10″, suggesting that like BHR 71 only this component has a substantial circumstellar disk, though both protostars in CB230 drive CO outflows. Another wide binary protostellar pair, SVS 13 (Bachiller et al. 1998; separation 4300 AU), shows mm emission from both protostars.
Kinematic information indicating a common center of gravity is required to show that a stellar pair is a binary. Launhardt (2001) has also observed N2H+ 10 emission (93.7 GHz) from CB230 with a resolution of 10″ and found two cores with a separation of 10″ (4500 AU), each spatially coincident with a NIR source, and which rotate about the axis perpendicular to the axis joining the cores. This implies that CB230 contains a true binary protostellar system. Molecular line observations to date of BHR 71 (B97) do not have sufficient angular resolution to determine if IRS1 and IRS2 are each associated with their own molecular core. Though there are a similarities between BHR 71 and CB230 – both contain 2 protostellar sources in a Bok globule, each driving a CO outflow, and large scale mm emission is centered on only one of the sources – BHR 71 can only be considered as a candidate binary protostellar system until high-angular resolution molecular line observations become available.
5 Conclusions
New near-infrared and 12CO observations have been combined with existing ISO mid-infrared and ATCA cm radio continuum observations to examine the protostellar content of the Bok globule BHR 71. Together with observations of Herbig-Haro objects, these data show:
(1) Two protostellar sources, IRS1 and IRS2, with a separation of 17″ (3400 AU) are located within BHR 71, as revealed by ISO mid-infrared observations. IRS1 is the brighter of the two by about a factor 10.
(2) Each protostar is driving its own molecular outflow, as revealed by the 12CO observations. The outflow from IRS1 is much larger in extent, is more massive, and dominates the CO emission.
(3) Both protostars are associated with Herbig-Haro objects and shock excited 2.122 µm H2 =1-0S(1) emission, which coincide spatially with their CO outflows.
(4) IRS1 is associated with cm continuum emission, with a flat or rising spectrum which is consistent with free-free emission, a signpost of protostellar origin.
The observations suggest that a binary protostellar system has formed within BHR 71. IRS1 is a Class 0 protostar, while IRS2, associated with much less circumstellar dust and driving a much weaker CO outflow, is probably a more evolved Class I protostar. High angular resolution mm molecular line observations are required to determine if IRS1 and IRS2 are a physically bound binary.
References
- (1) Bachiller, R., Guilloteau, S., Tafalla, M., Dutrey, A., Codella, C., & Castets, A., 1998, A&A, 339, L49
- (2) Bourke, T. L., Garay, G., Lehtinen, K. K., Köhnenkamp, I., Launhardt, R., Nyman, L-Å, May, J., Robinson, G., & Hyland, A. R. 1997, ApJ, 476, 781 (B97)
- (3) Bourke, T. L., Hyland, A. R., & Robinson, G. 1995a, MNRAS, 276, 1052
- (4) Bourke, T. L., Hyland, A. R., Robinson, G., James, S. D., & Wright, C. M. 1995b, MNRAS, 276, 1067
- (5) Corporon, P., & Reipurth, B. 1997, in Poster Proceedings of IAU Symp. 82, Low Mass Star Formation - from Infall to Outflow, ed. F. Malbert & A. Castets, (Grenoble: Observatoire de Grenoble), 85
- (6) Eislöffel, J., 1997, in IAU Symp. 182, Herbig-Haro Flows and the Birth of Low Mass Stars, ed. B. Reipurth & C. Bertout (Dordrecht: Reidel), 93
- (7) Garay, G., Köhnenkamp, I., Bourke, T. L., Rodríguez, L. F., & Lehtinen, K. K., 1998, ApJ, 509, 768
- (8) Launhardt, R., 2001, in IAU Symp. 200, The Formation of Binary Stars, ed. H. Zinnecker & R. D. Mathieu, (San Fransisco: ASP), in press (astro-ph/0008371)
- (9) Myers, P. C., & Mardones, D. 1998, in ASP Conf. Ser. 132, Star Formation with the Infrared Space Observatory, ed. J. L. Yun & R. Liseau, (San Fransisco: ASP), 173
- (10) Rodríguez, L. F., 1994, Rev. Mex. Astron. Astrofis., 29, 69
- (11) van den Ancker, M. E., Mardones, D., & Myers, P. C., 2001, in prep
- (12) Wilner D. J., Lindsey, B., Curiel, S., & Rodríguez, L. F. 2001, in prep
| Position (B1950) | ||||
|---|---|---|---|---|
| R.A. | Dec. | 7 µm | 15 µm | |
| Name | ° ′ ″ | (mJy) | (mJy) | |
| ISO sources | ||||
| IRS1(a)(a)The 3 cm position of IRS1 is R.A. (B1950) = and Dec. (B1950) = . | 11 59 02.7 | 64 52 06 | 346 | 230 |
| IRS2 | 11 59 00.1 | 64 52 02 | 39 | 18 |
| Herbig-Haro objects(b)(b)Positions are different to those given in Corporon & Reipurth (1997) – see text. | ||||
| HH 320 A | 11 58 58.3 | 64 51 31 | ||
| B | 11 58 57.4 | 64 51 23 | ||
| HH 321 A | 11 59 02.5 | 64 52 51 | ||
| B | 11 59 05.2 | 64 53 35 | ||
(a) – K′ image of BHR 71 (greyscale) overlayed with ISO LW2 contours (5.0–8.5 µm). The approximate region observed by ISO is indicated by the dashed box, and the embedded protostars IRS1 (“1”) and IRS2 (“2”) are labeled. (b) – Narrowband 2.12 µm + continuum image (greyscale). The positions of HH 320 and HH 321 (Corporon & Reipurth 1997) are marked with crosses, and the position of the 3 cm continuum source is marked with an unfilled box.
(a) – Narrowband 2.12 µm + continuum image (greyscale) overlayed with contours of CO emission. The blue (red) contours represent emission integrated over the velocity range km s-1 ( km s-1), which is blueshifted (redshifted) with-respect-to the cloud systemic velocity. The positions of IRS1 and IRS2 are marked with unfilled boxes. Offsets are relative to R.A. (B1950) = and Dec. (B1950) = . (b) – CO spectrum at the (″,30″) offset position. The dashed lines represent the limits of the ambient cloud emission ( km s-1). High velocity blue (red) shifted line wings are present at velocities km s-1 ( km s-1).