Temporal and Spectral Characteristics of Short Bursts from the Soft Gamma Repeaters 1806-20 and 1900+14
Abstract
We study the temporal and coarse spectral properties of 268 bursts from SGR 180620 and 679 bursts from SGR 1900+14, all observed with the Rossi X-Ray Timing Explorer/Proportional Counter Array. Hardness ratios and temporal parameters, such as T90 durations and 90 emission times are determined for these bursts. We find a lognormal distribution of burst durations, ranging over more than two orders of magnitude: T90 10-2 to 1 s, with a peak at 0.1 s. The burst light curves tend to be asymmetrical, with more than half of all events showing rise times tr 0.3 T90. We find that there exists a correlation between the duration and fluence of bursts from both sources. We also find a significant anti-correlation between hardness ratio and fluence for SGR 180620 bursts and a marginal anti-correlation for SGR 1900+14 events. Finally, we discuss possible physical implications of these results within the framework of the magnetar model.
1 Introduction
Soft gamma repeaters (SGRs) are a small class of objects that are characterized by brief and very intense bursts of soft gamma-rays and hard X-rays. They are distinguished from classical gamma-ray bursts (GRBs) by their repeated periods intense activity, during which dozens of bursts with energies approaching 1041 ergs are recorded. SGR bursts have significantly softer spectra than classical GRBs; the former are being well fit by an optically-thin thermal bremsstrahlung model with temperatures keV. Two SGRs (0526-66 and 1900+14) have emitted one giant flare each: events that are much more energetic ( erg) and contain a very hard spectral component within the first 1 s (Mazets et al. 1979; Cline et al. 1981; Hurley et al. 1999; Mazets et al. 1999; Feroci et al. 1999). For a review of the burst and persistent emission properties of SGRs, see Hurley (2000).
In 1992, it was suggested that SGRs are strongly magnetized ( G) neutron stars, or magnetars (Duncan & Thompson 1992, see also Pacz̀ynski 1992). This model suggests crustquakes as a plausible trigger for the short SGR bursts (as well as the giant flares): a sudden fracture of the rigid neutron star crust, driven by the build-up of crustal stresses as the strong magnetic field gradually diffuses through the dense stellar matter (Thompson & Duncan 1995 [hereafter TD95]; 1996). The motion of the crust shears and twists the external magnetic field, and in the process releases both elastic and magnetic energy.
Cheng et al. (1996) studied a set of 111 SGR 180620 bursts (detected with the International Cometary Explorer, ICE) and determined that some of their properties, such as size and cumulative waiting-time distributions are similar to those of earthquakes. Recently, Göğüş et al. (2000) confirmed these similarities for SGR 180620 using a larger sample of 401 bursts (111 detected with the Burst and Transient Source Experiment, BATSE, aboard the Compton Gamma Ray Observatory, CGRO; 290 with the the Proportional Counter Array, PCA, on the Rossi X-ray Timing Explorer, RXTE). The same similarities were found for SGR 1900+14 when we analyzed a sample of 1024 bursts (187 observed with CGRO/BATSE; 837 with the RXTE/PCA) (Göğüş et al. 1999). Furthermore, we reported evidence for a correlation between duration and fluence for the SGR 1900+14 bursts, similar to the correlation seen between the duration of strong ground motion at short distances from an earthquake region and the seismic moment ( energy) of an earthquake (Lay & Wallace 1995). This similarity strongly suggests that SGR bursts, like earthquakes, may be manifestations of self-organized critical systems (Bak, Tang & Wiesenfeld 1988), lending support to the hypothesis that SGR bursts involve the release of some form of stored potential energy.
Statistical studies such as the above provide important clues not only about the mechanism by which energy is injected during an SGR burst, but also the mechanism by which it is radiated. For example, in the magnetar model the stored potential energy may be predominantly magnetic, and the electrical currents induced by crustal fractures may be strongly localized over small patches of the star’s surface, somewhat as they are in solar flares. In such a situation, the energy density in the non-potential magnetic field is high enough that excitation of high frequency Alfvén motions leads to rapid damping and the creation of a trapped fireball (through a cascade to high wavenumber: Thompson & Blaes 1998). By contrast, if energy is injected more globally, then an approximate balance between injection and radiation will occur in the bursts of luminosity less than erg s-1 (Thompson et al. 2000).
Here, we investigate detailed temporal characteristics of a large subset of SGR 180620 and SGR 1900+14 bursts observed with the RXTE/PCA during their burst active periods in 1996 and 1998, respectively. We apply to the SGR bursts some temporal analysis methods that were originally developed for the study of GRBs. We also study the spectral variations of the bursts as a function of the burst fluence and duration. In § 2, we briefly review the RXTE/PCA observations. Section 3 describes the data analysis techniques and our results are discussed in § 4.
2 Observations
The PCA instrument (Jahoda et al. 1996) consists of five Xe proportional counter units (PCUs) sensitive to energies between 260 keV with 18% energy resolution at 6 keV. The PCA has a total effective area of 6700 cm2.
SGR 180620 : The RXTE/PCA observations of SGR 180620 were performed during a burst active period of the source in 1996 (between November 5 and 18) for a total effective exposure time of 136.8 ks. Using the burst search procedure described in Göğüş et al. (2000), we have identified 290 bursts from the source. The number of integrated counts (260 keV) for these bursts range between 22 and 34550. Using the count-to-energy conversion factor given in Göğüş et al. (2000) this corresponds to burst fluences between and ergs cm-2 (E 25 keV). Assuming isotropic burst emission, the corresponding energy range is – ergs, for a distance to SGR 180620 of 14.5 kpc (Corbel et al. 1997). To facilitate our analysis, we chose events that were clustered together during two very active epochs of the source, resulting in 268 events recorded on 5 (MJD 50392) and 18 (MJD 50405) November 1996.
SGR 1900+14 : RXTE observations of SGR 1900+14 took place between 1998 June 2 and December 21, for a total effective exposure time of 224.1 ks. Using the same burst search algorithm as before, we identified a total of 837 bursts from the source with integrated counts ranging between 22 and 60550. The fluences of these bursts range from to ergs cm-2 (E 25 keV) corresponding to an energy range of – ergs (assuming isotropic emission at 7 kpc [Vasisht et al. 1994]). Similarly, we selected 679 events which occurred during a very active period of the source between 1998 August 29 (MJD 51054) and September 2 (MJD 51058).
3 Data Analysis and Results
3.1 Duration (T90) estimates
Originally defined for cosmic GRBs, the T90 duration of a burst is the time during which 90% of the total (background-subtracted) burst counts have been accumulated since the burst trigger (Kouveliotou et al. 1993). We calculated the T90 duration of SGR bursts using event-mode PCA data (2-60 keV) with 1/1024 s time resolution. For each burst we collected the cumulative counts for an 8 s continuous stretch of data starting 4 s before its peak, tp. We then fit the cumulative count distribution between two user-selected background intervals 666Approximately equal background intervals were selected before and after the burst, except in cases where separation between bursts was too small; there we chose smaller, but significant, post/pre burst intervals. with a first order polynomial plus a step function (for the burst) and subtracted the background counts. By using a first order polynomial to fit the cumulative counts, we assume the PCA background remains flat over each 8 s segment. The resulting height of the step function gives the total burst counts. Figure 1 depicts the steps of the T90 estimate procedure for one of the SGR 1900+14 bursts.
As the selected bursts occurred during extremely active periods (for both sources), there were quite a number of cases where bursts were clustered very close together. During these active episodes, many crustal sites on the neutron star may be active, releasing stored potential energy in the form of bursts with a large variety of time profiles. Hence, it is important to distinguish single pulse events from events with multiple peaks (which may involve multiple fracture sites). To do this, we applied arbritrary but consistent criteria to our data. We classified an event as multi-peaked if the count rate at any local minimum (in 7 ms time bins) is less than half the maximum value attained subsequently in the burst (see Figure 2, middle plots). Otherwise the event was classified as single-peaked (Figure 2, top plots). When the count rate dropped to the noise level between peaks, the event was classified as a single, multi-peaked burst if and only if the time between peaks was less than a quarter of the neutron star rotation period ( 1.3 s for SGR 1900+14, 1.9 s for SGR 1806-20; see Figure 2, bottom plots). We found that 262 of the 679 bursts from SGR 1900+14, and 113 of the 268 SGR 1806-20 bursts were multi-peaked by these criteria. Note that the total counts per burst (or ”count fluences”) were found to span nearly the same range in the two classes of bursts, in both sources. This suggests that the light curve peak structure does not correlate strongly with total energy.
In the context of cosmic GRBs, the value of T90 can be systematically underestimated in faint events due to low signal-to-noise (Koshut et al. 1996). We investigated this effect in our SGR analysis using extensive numerical simulations. We created three time profiles based upon the observed time profiles; a single two-sided Gaussian (with right-width twice the left width), two two-sided Gaussians whose peaks are separated by 0.5 s and the peak rate of the second pulse is 0.6 of the first one, and two two-sided Gaussians with peak separation of 1 s. For each profile, we varied the peak rates (eight values between 2600 counts s-1 and 55000 counts s-1) and the width of the Gaussians (eight values from 12 ms to 120 ms). We determined the T90 duration for each combination before adding noise. Then for each combination, we generated 800 realizations including Poisson noise and determined the respective T90 values for these simulations. We found that the fractional difference, FD = 1 (T90,s / T90,a) between the actual value, T90,a, (in the absence of noise) and the simulated one, T90,s, has a strong dependence on the peak rate (i.e. signal-to-noise ratio), such that FD can be as high as 0.22 at count rates of 2600 counts s-1. It is, however, less than 0.05 for count rates greater than 4800 counts s-1. The variation of FD with respect to the pulse profile is insignificant. Using the results of our simulations we obtained a T90 correction as a function of peak rate. We estimated the peak rate of each burst using a box-car averaging technique with a box width of 1/512 s. We then corrected T90 values for the S/N effect using our correction function and these peak rates.
Our final data set thus comprises 455 SGR 1900+14 bursts with corrected durations between 9 ms and 2.36 ms (Figure 3, solid histogram). We were unable to determine statistically significant durations for 187 SGR 1900+14 bursts because there were less than counts per event. The solid curve in Figure 3 is a best fit log-Gaussian function to all T90 values which peaks at 93.9 0.2 ms ( = 0.35 0.01; where is the width of the distribution in decades). The dashed histogram in Figure 3 is the distribution of T90 values of single pulse bursts whose log-Gaussian mean is 46.7 0.1 ms ( = 0.21 0.01). Also in Figure 3, the dash-dot histogram displays the T90 distribution of multi-peaked bursts and it peaks at 148.9 0.2 ms ( = 0.26 0.02). For SGR 180620 bursts, we determined corrected T90 values of 190 bursts which range between 16 ms and 1.82 s (49 bursts were too weak to determine their T90 values). The distribution of all T90 values is shown in Figure 4 (solid histogram). A log-Gaussian fit to this distribution yields a peak at 161.8 0.2 ms ( = 0.34 0.02). Similarly, a log-Gaussian fit to the T90 distribution of the single pulse bursts (dashed lines in Figure 4) peaks at 88.1 0.1 ms ( = 0.19 0.03) and a fit to the multi-peaked bursts (dash-dot lines in Figure 4) yields a peak at 229.9 0.3 ms ( = 0.32 0.03).
In order to quantify the time profile symmetry of SGR bursts we determined the ratio of their rise times (tr, i.e. the interval between T90 start time and peak time tp) to T90 durations of the single pulse events. In Figure 5, we plot the distributions of these ratios for bursts with single pulse (solid histogram) and milti-peaks (dashed histogram) from SGR 1900+14 (left) and those from SGR 180620 (right). The majority of single pulse events from both sources have tr / T90 values less than 0.3, showing that SGR bursts decay slower than they rise, or in other words that SGR pulse profiles are asymmetric. We find that the average values os the tr / T90 ratios are 0.29 and 0.27 for SGR 1900+14 and SGR 180620, respectively. Remarkably coincident average values, along with very similar distributions of tr / T90 ratios of both sources suggest a similarity of the asymmetry in the temporal profiles of SGR bursts.
3.2 Emission time (90) estimates
Emission time, N, was introduced for cosmic GRBs as a complimentary temporal parameter to T90 (Mitrofanov et al. 1999). Emission time is the time over which a fixed percentage, N%, of the total burst emission was recorded, starting from the peak of the event and moving downward in flux. For each burst, we determined the average background level from the background intervals used in the T90 estimating procedure. The background-subtracted count bins within the burst interval (i.e. from the end of pre-burst background range to the beginning of post-burst background range) were then ordered by decreasing count rate. Starting with the highest count rate bin (i.e. the peak), we added the counts of each successively weaker bin until 90% of the total burst counts were accumulated. The 90 emission time of the burst is then the total time spanned by the accumulated bins.
As with the T90 parameter, when the S/N ratio of the burst is low, the measured emission time can be systematically smaller than the actual value (Mitrofanov et al. 1999). In order to correct for this systematic error, we constructed numerous simulated profiles identical to those described in the previous section. We found that, similar to T90 estimates, the FD between the actual and simulated 90 emission times is strongly dependent on the peak rate. FD is 0.26 at count rates of 2600 counts s-1 and less than 0.06 for count rates greater than 4800 counts s-1. Similar to the T90 measurement, this effect is only weakly dependent on the temporal profile of the burst. Using our 90 correction function and the peak rates, we obtained the corrected 90 emission times. The corrected values range between 4.6 and 412.8 ms for SGR 1900+14 bursts, and between 4.8 and 559.2 ms for SGR 180620 bursts. In Figure 6, we show the distributions of 90 emission times for SGR 1900+14 (left) and SGR 180620 (right). The dashed lines in both plots are the best fit log-Gaussian curves which peak at 49.6 0.1 ms ( = 0.28 0.01) for SGR 1900+14 events, and at 82.3 0.1 ms ( = 0.32 0.02) for SGR 180620 events. The 90 emission times of bursts from both sources are on average shorter than T90 durations. Note that the log-Gaussian mean values of T90 distributions of single pulse bursts from both SGRs are quite similar to those of the 90 distributions.
3.3 Duty cycles (90)
As shown in the previous section, the 90 values of bursts are in general smaller than their T90 values. The reason is that 90 is not a measure of the actual duration of the burst when the morphology of the burst is complex (e.g. multiple peaks). Mitrofanov et al. (1999) suggested that the ratio 90/T90 can then be used to describe a duty cycle, 90. We, therefore, determined the 90 parameters for all bursts of both sources (Figure 7, left for SGR 1900+14 bursts, right for SGR 180620 bursts). Both distributions peak at about 90 0.45 and their overall shapes are very similar, indicating a strong similarity of the type of burst emission in the two sources, although their overall duration distribution differ.
3.4 Duration – Fluence – Hardness correlations
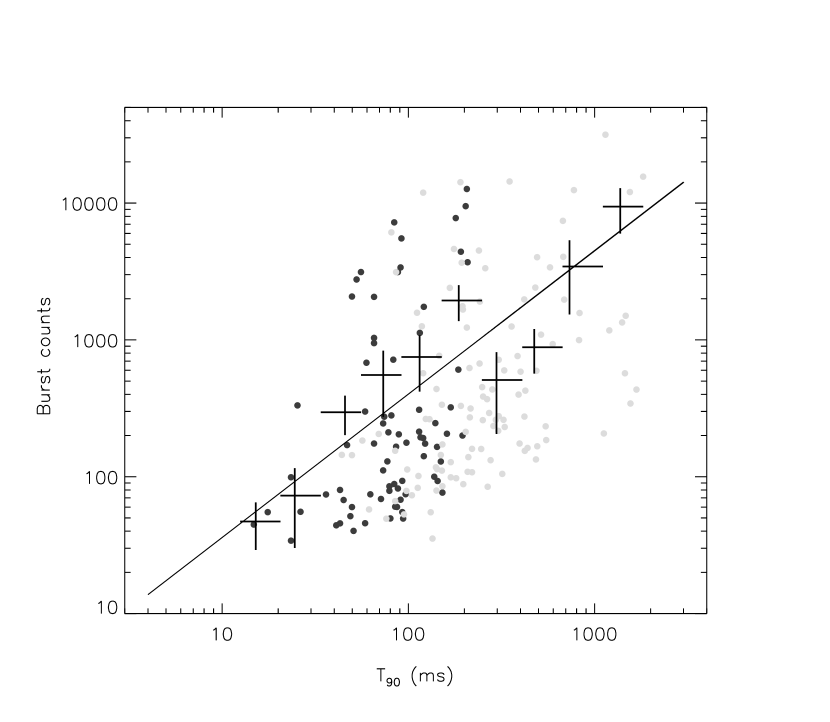
Gutenberg and Richter (1956) showed that there exists a power law relation between the magnitude (which is related to the total energy involved) of earthquakes and the durations of strong ground-shaking at short distances from an earthquake epicenter. We investigated whether a similar correlation exists in SGR events using their total burst counts and their T90 durations (as estimated in §3.1), for both SGR 180620 and SGR 1900+14. For each set of bursts, we grouped the T90 values into logarithmically spaced bins and determined the weighted mean value of total burst counts and T90 durations for each bin. In Figure 8, we show the plot of integral counts vs T90 durations of SGR 180620 bursts. The crosses in this figure are the weighted means of each parameter; the errors on the mean-T90 values denote the range of each bin while the errors on the mean counts are due to sample variance. The dark points are the individual measurements of the burst counts and T90 values of single pulse events and the gray circles are those of multi-peaked bursts. Figure 8 shows that the integral counts and durations of SGR 180620 bursts are well correlated. To quantify this correlation, we determined the Spearman’s rank order correlation coefficient, = 0.91, and the probability of getting this value from a random data set, P=3.4 10-4. We further fit a power law model to the mean values (crosses) of the data using the least squares technique, which yields a power law index of 1.05 0.16.
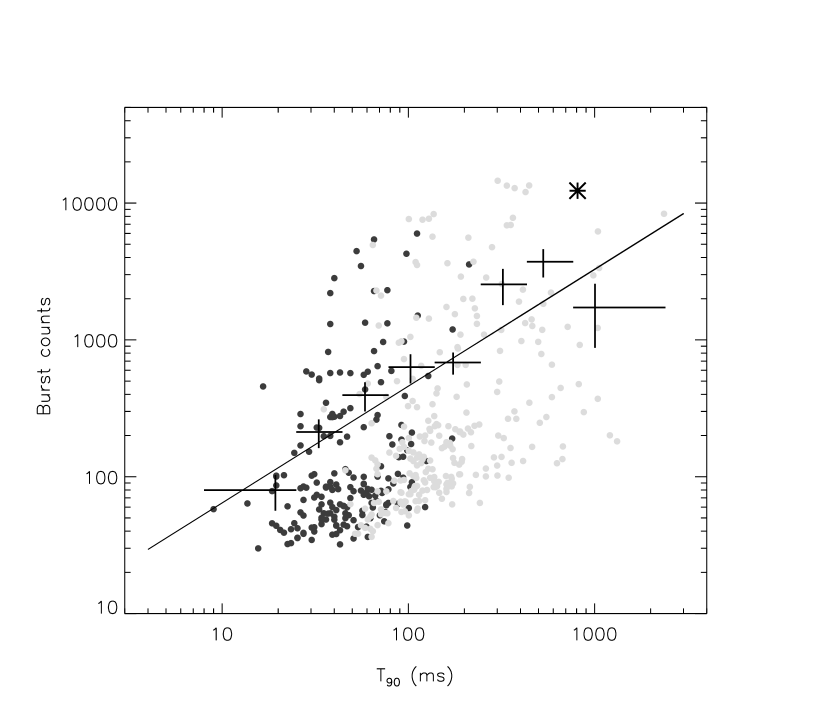
Similarly, Figure 9 shows that the integral counts and T90 durations of SGR 1900+14 bursts are also correlated, having = 0.89 and P = 8.6 10-4. A power law fit to the mean values of the data yields an index of 0.91 0.07. The asterisk shown in the upper right portion of Figure 9 indicates where the precursor of the August 29 burst falls. This event was exceptionally long, bright and resembled the August 27 giant flare in various ways (Ibrahim et al. 2000). A spectral line at 6.4 keV was reported during the precursor of event of August 29 burst with 4 significance (Strohmayer & Ibrahim 2000). If spectral lines are event intensity dependent, there are very few events in Figure 9 during which we would expect to see any lines. The detailed spectral analysis of all SGR bursts is underway.
In conclusion we find a good correlation between the duration and total counts (energy) of SGR bursts, quite similar to the one established for earthquakes. It is noteworthy that the burst count fluences of single pulse events (from both systems) span a range almost as wide as that of fluences of multi-peaked bursts.
In order to investigate burst spectral variations versus fluence, we calculated an event hardness ratio defined as the ratio of the total burst counts observed between 1060 keV to those between 2 10 keV. Bursts with total counts less than 50 yielded statistically insignificant hardness ratios ( 3 ), and therefore, were excluded from our analysis. For SGR 180620 bursts, we have 159 events with hardness ratios measured to 3 accuracy. We divided the total counts of these events into logarithmically spaced bins and determined the weighted mean hardness ratio for each group. Figure 10a shows that the SGR 180620 burst hardness ratios are anti-correlated with fluence (=0.96, P=2.6 10-4). For 385 SGR 1900+14 bursts, Figure 10d shows a marginal anti-correlation between hardness and fluence ( = 0.89, P=4.6 10-3). Interestingly, we find that although the hardness fluence anti-correlation is evident in both sources, the SGR 180620 events are overall harder than the SGR 1900+14 ones. Our energy selection optimizes the PCA energy response, so that we are not affected by instrumental biases.
Fenimore, Laros & Ulmer (1994) have performed a similar study of hardness ratio vs fluence for 95 SGR 1806-20 events detected with ICE. We cannot directly compare our results with this study for two reasons. The energy ranges over which hardness ratios are computed differ significantly; while we use (10 60 keV)/(2 10 keV), Fenimore et al. (1994) use (43.2 77.5 keV)/(25.9 43.2 keV). The PCA sensitivity drops significantly beyond 25 keV, limiting the possibility of comparison. Furthermore, our fluence range ends at ergs cm-2, just below the range described in Figure 1 of Fenimore et al. (1994). However, since Fenimore et al. report a constant trend above ergs cm-2, one could postulate that the hardness ratio vs fluence trend we report, levels off at higher fluences (energies).
We further investigated the hardness fluence trend for burst morphology sub-sets, namely for single pulse and multi-peaked burst groups for each source. Figure 10b exhibits hardness fluence plot of single pulse SGR 180620 events and Figure 10c shows that of multi-peaked bursts. We see that both sets display spectral softening as the burst count fluence increases. Similarly SGR 1900+14 events are shown in Figure 10e and f. For this source, the hardness fluence anti-correlation is significant only for single pulse bursts. It is important to note that the peak rates of most of the highest fluence bursts reach 105 counts s-1 (on 1/1024 s time scale) around which the PCA pulse pileup may become important. This effect can artificially harden the observed count spectrum at these rates. The spectral hardening or leveling off seen in the last bins of the plots of Figure 10 may well be due to the pulse pileup effect and should not be considered as intrinsic source property.
We next investigated the relationship between the hardness and duration of SGR bursts. Although we find hardness fluence anti-correlations and fluence duration correlations, both SGR 180620 (Figure 11, squares) and SGR 1900+14 (Figure 11, diamonds) burst hardness ratios are independent of the event durations.
4 Discussion
Our study demonstrates that unlike the T90 duration distribution of cosmic GRBs which shows a bi-modal trend with peaks at 0.31 s and 37 s (Kouveliotou et al. 1993; Paciesas et al. 1999), the T90 distribution of SGR bursts displays a single peak which varies for each source: 93 ms and 162 ms for SGR 1900+14 and SGR 180620, respectively.
We find that the durations of single-pulse bursts from both SGRs form narrow distributions (compared to those of multi-peaked events) which peak at ms and ms for SGR 1900+14 and SGR 1806-20, respectively. These bright, hard, and short bursts are almost certainly powered by a sudden disturbance of the rigid neutron star crust, which transmits energy to the magnetosphere. Magnetic stresses, which force the star between distinct metastable equilibria, provide the most plausible source of energy for the giant flares, and by inference for the short bursts (TD95; Thompson & Duncan 2001).
The duration of the multi-peaked bursts is clearly fixed by the time between successive releases of energy. The widths of the single pulse bursts could, in principle, be limited either by the rate of release of energy from the initial reservoir or, alternatively, by the time for the released energy to be converted to radiation through some intermediate reservoir. There have been various suggestions for such an intermediate storage mechanism: a hot fireball that is confined on closed magnetic field lines (TD95); a region of strong magnetic shear and high current density (Thompson et al. 2000); or a persistent vibration of the star (Fatuzzo & Melia 1994).
Measurement of the burst rise time provides a discriminant between these possibilities. We find that is characteristically much shorter than the total duration, as defined by either or . Moreover, the distribution of is broad (both for single-pulsed bursts and multi-peaked events), which suggests that is not directly connected to cooling. For example, the X-ray luminosity of a trapped fireball in local thermodynamic equilibrium is proportional to its surface area, and is a weak function of its internal temperature (Thompson & Duncan 1995). The characteristic radiative timescales are, in general, very short at the high spectral intensity of an SGR burst. Thus, the rise of the X-ray flux plausibly represents the initial injection of energy, although strictly only sets an upper bound to the injection timescale.
While the overall shape of T90 (both single and multi-peaked) and the 90 distributions of both sources are quite similar (relatively consistent Gaussian widths), the peaks of both distributions for SGR 1900+14 occur at shorter durations compared to those for SGR 180620. This systematic difference in the burst durations probably results from some differing intrinsic property of the sources, such as the strength of the magnetic field, or the size of the active region.
We find a power law correlation between the total burst counts (fluence) and the duration of SGR bursts with a power law index around 1. Similar behavior was noted for earthquakes by Gutenberg & Richter (1956). Within the context of earthquake mechanics, one way of defining duration (also known as “bracketed duration” [Bolt 1973]) is the time between the first and last 5% excesses of g (gravitational acceleration on Earth) by the threshold acceleration of strong ground shaking. Recently, Lay & Wallace (1995) presented the power law correlation between the seismic moment ( energy) and duration of 122 earthquakes with energies between 3.5 1023 erg and 2.8 1026 erg. The power law fit to these events yields an index of 3.03.
An equally important constraint on the injection and cooling mechanisms comes from the anti-correlation between the hardness and fluence of the SGR bursts. Although very significant for SGR 1806-20, this anti-correlation is much milder than that expected for black-body emission from a region of constant area; indeed, the trend of increasing hardness with lower fluence is opposite to that expected for constant area emission. Two basic types of radiative mechanism could reproduce this trend. First, the emitting plasma could be in local thermodynamic equilibrium, which requires that its size (radiative area) should decrease at lower fluences. An alternative possibility is that the spectral intensity of the radiation field sits below that of a black body, and that the temperature of the emitting plasma is buffered within a narrow range. We consider each of these possibilities in turn.
An SGR burst can be parameterized by the rate of injection of energy into the magnetosphere, , and the volume of the injection region. When is large and is small enough, it is not possible to maintain a steady balance between heating and radiative cooling. The deposited energy is locked onto closed magnetic field lines of the neutron star, in a “trapped fireball” composed of photons and electron-positron pairs (TD95). This kind of event will tend to have a soft spectrum, because the injected energy has thermalized, and the plasma remains in LTE very close to its photosphere. The rise time is comparable to the time over which energy is initially injected, but the decay is limited by the rate of cooling through a thin radiative surface layer, which contracts toward the center of the fireball. The declining light curve of the 27 August 1998 giant flare can be accurately fit by such a model (Feroci et al. 2001; Thompson & Duncan 2001).
A second burst from SGR 1900+14 on 29 August 1998 has been interpreted in this trapped fireball model (Ibrahim et al. 2000). The main 29 August burst had a much shorter duration than the giant flare ( s versus s). This bright component was followed by a much fainter pulsating tail (extending out to s) which provides direct evidence for heating and compression of the neutron star surface by the fireball. In this model, the short duration and high luminosity of the bright component require that the trapped fireball had an approximately planar geometry, as would be expected if the energy were released along an extended fault (Ibrahim et al. 2000).
As our results show, most single-pulsed bursts from SGR 1900+14 have a much shorter duration (40 times smaller) than the bright component of the August 29 burst. It remains unclear, therefore, whether the trapped fireball model also applies to these much more frequent events. If it does apply, then the narrowness of the distribution (compared with the wide range of measured fluences) also requires a planar geometry, because the cooling time is determined by the smallest dimension of the fireball.
The radiative mechanism is somewhat different if the injection luminosity lies below a critical value of ergs s-1 (assuming a spherical geometry; Thompson & Duncan 2001). When the compactness is that low, it is possible to maintain a steady balance between the heating of a corona of electron-positron pairs, and radiative diffusion out of the corona (which one deduces must be optically thick to scattering). The central temperature of the corona is buffered in the range keV, and remains higher at lower luminosities – just the trend observed for SGR 1806-20 (Fig. 10). If this radiative model applies to the majority of single-pulsed events, then the constraints on the geometry of the active region are weaker, and one must consider alternative mechanisms for storing the injected energy, such as a persistent current driven by shearing motions in the neutron star crust (Thompson et al. 2000).
References
- (1)
- (2) Bak, P., Tang, C. & Wiesenfeld, K. 1988, Phys. Rev. A, 38, 364
- (3) Bolt, B.A. 1973, in 5th World Conf. Earthquake Eng., Inter. Assoc. for Earthquake Eng., Rome, paper no. 292
- (4) Cheng, B., et al. 1996, Nature, 382, 518
- (5) Cline, T.L., et al. 1981, ApJ, 255, L45
- (6) Corbel, S., et al. 1997, ApJ, 478, 624
- (7) Duncan, R.C. & Thompson C. 1992 ApJ, 392, L9
- (8) Fatuzzo, F, & Melia, F. 1994, in AIP Proc., 2th Huntsville Symp. on Gamma-Ray Bursts, eds. G.J. Fishman, J.J. Breinerd & K. Hurley (New York: AIP), p.515
- (9) Fenimore, E.E., Laros, J.G. & Ulmer, A. 1994, ApJ, 432, 742
- (10) Feroci, M., et al. 1999, ApJ, 515, L9
- (11) Feroci, M., Hurley, K., Duncan, R.C., & Thompson C. 2001, ApJ, in press, astro-ph/0010494
- (12) Göğüş, E., et al. 1999, ApJ, 526, L93
- (13) Göğüş, E., et al. 2000, ApJ, 532, L121
- (14) Gutenberg, B. & Richter, C.F. 1956, Bull. Seis. Soc. Am., 46, 105
- (15) Hurley, K., et al. 1999, Nature, 397, 41
- (16) Hurley, K., et al. 2000, in AIP Proc., 5th Huntsville Symp. on Gamma-Ray Bursts, eds. R.M. Kippen, R.S. Mallozzi & G.J. Fishman (New York: AIP), p.763
- (17) Jahoda, K. et al. 1996, Proc. SPIE, 2808, 59
- (18) Ibrahim, A., et al. 2001, ApJ, submitted, astro-ph/0007043
- (19) Kouveliotou, C., et al. 1993, ApJ, 413, L101
- (20) Koshut, T.M., et al. 1996, ApJ, 463, 570
- (21) Lay, T. & Wallace, T., eds. 1995, Modern Global Seismology, (San Diego: Academic), p.378
- (22) Mazetz, E.P., et al. 1979, Nature, 282, 587
- (23) Mazetz, E.P., et al. 1999, Astronomy Letters, 25, 635
- (24) Mitrofanov, I.G., et al. 1999, ApJ, 504, 925
- (25) Paciesas, W.S., et al. 1999, ApJS, 122, 465
- (26) Pacz̀ynski, B. 1992, Acta Astron., 42, 145
- (27) Strohmayer, T & Ibrahim, A. 2000, ApJ, 537, 111
- (28) Thompson, C. & Duncan, R.C. 1995, MNRAS, 275, 255
- (29) Thompson, C. & Duncan, R.C. 1996, ApJ, 473, 322
- (30) Thompson, C. & Blaes, O. 1998, Phys. Rev. D, 57, 3219
- (31) Thompson, C., et al. 2000, ApJ, 543, 340
- (32) Thompson, C. & Duncan, R.C. 2001, ApJ, submitted
- (33) Vasisht, G., et al. 1994, ApJ, 431, L35
- (34)