X-ray emission from the Sculptor galaxy NGC 300
We report here the results of a full analysis of all the ROSAT PSPC spectral imaging observations and all the ROSAT HRI high resolution imaging observations of the very nearby ( Mpc) Sculptor galaxy, NGC 300. Many point sources are detected within the field, several of them showing evidence for variability, and we present full source lists detailing their X-ray properties, and attempt to classify them on the basis of their temporal, spectral and multi-wavelength characteristics. A black hole X-ray binary candidate, a supersoft source and several supernova remnants and H ii regions are detected in X-rays, as is unresolved, possibly diffuse emission, accounting for perhaps 20% of the total NGC 300 X-ray (0.12.4 keV) luminosity ( erg s-1). We compare the X-ray source luminosity distribution of NGC 300 with that of other nearby galaxies, and we also compare NGC 300 with its Sculptor neighbours, concluding that it is a quite an unremarkable system, showing no unusual X-ray (or other multi-wavelength) properties. It may be one of the best examples of a completely typical normal quiescent late-type spiral galaxy.
Key Words.:
Galaxies: clusters: Sculptor – Galaxies: individual: NGC 300 – Galaxies: ISM – Galaxies: spiral – X-rays: galaxies1 Introduction
NGC 300, a near face-on SA(s)d galaxy, is one of the five well-known galaxies making up the nearby Sculptor galaxy group, and appears in fact to be possibly involved in weak gravitational interaction with one of the other Sculptor galaxies, namely NGC 55. Though estimates of its distance vary, we here adopt the value of 2.1 Mpc used by several authors (e.g. Freedman et al. 1992, Blair & Long 1997 [hereafter BL97], Côté et al. 1997). At this distance, 1′ corresponds to 0.61 kpc, and the scale of the galaxy, as indicated by its major (D25) and minor axis (de Vaucouleurs et al. 1991), is approximately 13.39.4 kpc (hence the system is physically quite small). Many giant H ii regions are visible within the galaxy, and there is evidence for many episodes of star formation having taken place. Interestingly though, it appears that star-forming activity in the centre of NGC 300 has been suppressed for the past 109 yr with respect to the disk, the central arcminute containing only a modest population of stars with ages less than 1 Gyr (Davidge 1998). Though the spiral arms are not so clearly defined, the spiral pattern is very evident (see e.g. Sandage & Bedke 1988). NGC 300’s close proximity, face-on nature and the fact the galactic hydrogen column density in the direction of NGC 300 is relatively low (3.6 atoms cm-2; Dickey & Lockman 1990), thus minimizing any absorption of soft X-rays, make it an ideal target for the study of X-ray source populations in nearby spiral galaxies. Furthermore, its similarity to other small spiral galaxies, notably M33 (see BL97; Haberl & Pietsch 1999) and its Sculptor neighbours, is useful in terms of comparisons.
NGC 300 was first observed in X-rays by the Position Sensitive Proportional Counter (PSPC) (Pfeffermann et al. 1986) on board ROSAT (Trümper 1983). The ROSAT X-ray telescope (XRT), with the PSPC at its focal plane, offers three very important improvements over previous X-ray imaging instruments. Firstly, the spatial resolution is very much improved, the 90% enclosed energy radius at 1 keV being (Hasinger et al. 1992). Secondly, the PSPC’s spectral resolution is very much better ( FWHM at 1 keV) than earlier X-ray imaging instruments, allowing the derivation of characteristic source and diffuse emission temperatures. Lastly, the PSPC internal background is very low ( ct s-1 arcmin-2; Snowden et al. 1994), thus allowing the mapping of low surface brightness emission. The ROSAT High Resolution Imager (HRI) on the other hand, because of its excellent spatial resolution (more like ) and relative insensitivity to diffuse emission, is an ideal instrument for further investigation into the point source populations.
A presentation of some of the early NGC 300 PSPC observations has already been given by Read et al. (1997), hereafter RPS97, as part of a homogeneous analysis of archival ROSAT data from several nearby spiral galaxies. Several point sources are seen together with a small amount of unresolved, possibly diffuse emission. Of the point sources seen, several appear to lie close to the positions of clusters of stars, and a few appear to coincide with H ii regions and Wolf-Rayet stars. The same PSPC observations were also very briefly discussed by Zang et al. (1997).
In terms of other significant multi-wavelength studies of NGC 300, two which are important are the SNR identification work of Blair & Long (1997; BL97) and Pannuti et al. (2000), hereafter P00. P00 made use of both the NGC 300 ROSAT PSPC X-ray results from RPS97 (though not correcting for the different assumed NGC 300 distances in RPS97 and P00), and the optical work of BL97, such that several SNR candidates are now thought to exist within NGC 300. These are discussed throughout the present paper.
Here we report the results of the full ROSAT observations (46 ks of PSPC, 40 ks of HRI) of the field surrounding NGC 300, concentrating primarily on the point source population within and around the galaxy. The plan of the paper is as follows. Section 2 describes the observations and the preliminary data reduction methods used and Sect. 3 discusses the results as regards the point sources. Section 4 discusses the X-ray properties of NGC 300, with regard both to its membership of the Sculptor group and to how it compares to spiral galaxies in general. Finally a summary is presented in Sect. 5.
2 ROSAT observations and preliminary analysis
2.1 PSPC
A summary log of the entire ROSAT PSPC and HRI observations of the NGC 300 field is given in Table 1. Because the PSPC is some three times as sensitive as the HRI, we expect, from the relevant exposure times of the observations, many more counts from the PSPC data. We have analysed all the data extensively, and find this to be so. Nevertheless the HRI data are in themselves of great interest, and their analysis and subsequent results are described later.
NGC 300 was observed with the ROSAT PSPC twice (see Table 1). Though each PSPC dataset was seen to be very clean, times of both very high and very low accepted event rates and master veto rates were removed. Source detection and position determination were performed over the full field of view with the EXSAS local detect, map detect, and maximum likelihood algorithms (Zimmermann et al. 1994) using images of pixel size 15″. The two eventsets were then shifted with respect to the prominent X-ray and optical bright star in the field, HD5403, correcting for the proper motion of the star (Perryman et al. 1997) at the epoch of the ROSAT observations. The two cleaned and position-corrected datasets were then merged together, and the source detection procedures were re-ran.
| OBS-ID | Instr. | Exposure | Observation | |
|---|---|---|---|---|
| Time (s) | Start date | End Date | ||
| (1) | (2) | (3) | (4) | (5) |
| 600025p-0 | PSPC | 9324 | 28/11/91 | 02/01/92 |
| 600025p-1 | PSPC | 36693 | 26/05/92 | 29/06/92 |
| 600621h | HRI | 15224 | 08/06/94 | 25/06/94 |
| 600621h-1 | HRI | 19138 | 27/05/95 | 28/05/95 |
| 600933h | HRI | 5619 | 02/06/97 | 03/06/97 |
Sources accepted as PSPC detections were those with a likelihood L 10. Probabilities P, are related to maximum likelihood values L, by the relation P. Thus a likelihood L of 10 corresponds to a Gaussian significance of 4.0 (Cruddace et al. 1988; Zimmermann et al. 1994).
In the following, we concentrate primarily on the sources found within the optical confines of NGC 300, though we discuss a few other interesting sources detected close by in Sect. 3.2 and in Appendix. A.
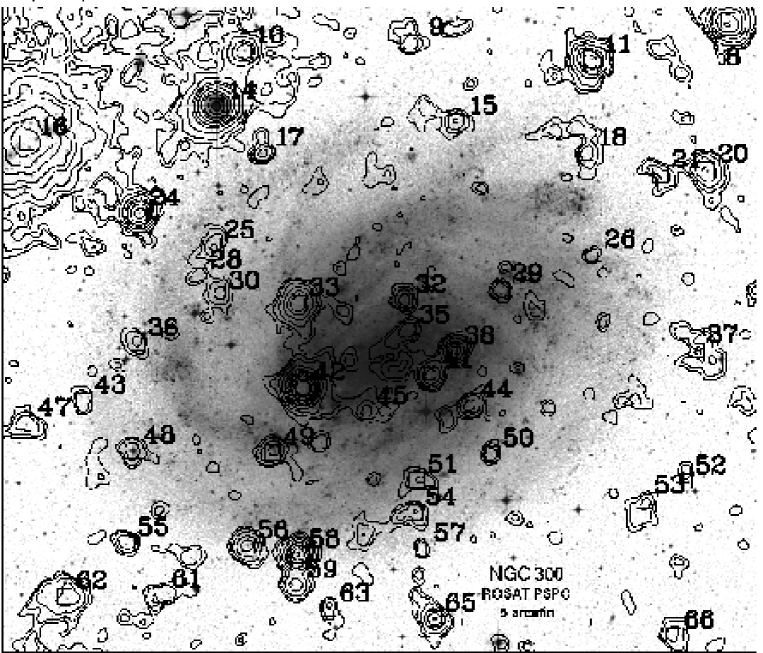
Figure 1 shows a broad band (channels 11235, corresponding approximately to 0.112.35 keV) contour image of the central 29′25′ region, overlayed on a Digital Sky Survey (DSS2) red image (note the bright optical and X-ray star HD5403, to the north east, used to register the X-ray coordinates).
Shown in Fig. 2 are equivalent contour images in the soft (ch. 1141), hard1 (ch. 5290) and hard2 (ch. 91201) ROSAT PSPC bands, with the D25 ellipse of the galaxy marked. Within the area covered by Fig. 1, 47 sources are detected, their source numbers marked in the figure, 26 of which lie within (or ′ from) the optical disk of NGC 300 (as indicated by the D25 ellipse in Fig. 2). These 26 sources are listed in Table 2 as follows: source number (Col. 1), corrected right ascension and declination (Cols. 2, 3), error on the source position (Col. 4, including a 39 systematic attitude solution error), likelihood of existence (Col. 5), net broad band counts and error (Col. 6), and count rates and errors after applying deadtime and vignetting corrections (Col. 7). Two hardness ratios are given in Cols. 8 & 9, HR1, defined as (hardsoft)/(hardsoft) (hard and soft being the net counts in the hard (channels 52201) and soft (channels 1141) bands, respectively), and HR2, defined as (hard2hard1)/(hard2hard1) (hard1 and hard2 being the net counts in the hard1 (channels 5290) and hard2 (channels 91201) bands, respectively). The corresponding errors, as per Ciliegi et al. 1997, are also given. While HR1 is most sensitive to variations in the absorbing column, HR2 traces more the power law index or temperature. Hardness ratios can be used to give very crude estimates of the spectral parameters that best describe the source photons (compare e.g. the tabulated values with plots showing the variation of HR1 and HR2 for simple spectral models in e.g. Pietsch et al. 1998). The 0.12.4 keV flux and X-ray luminosity, assuming a 5 keV thermal bremsstrahlung model and a source distance of 2.1 Mpc (i.e. to NGC 300), are given in Cols. 10 & 11. Count rates of the PSPC-detected point sources can be converted into fluxes, assuming a variety of spectral models. A 1 keV thermal bremsstrahlung model for instance, gives rise to fluxes 6% greater than those given in Table 2. Finally note that none of these 26 sources are observed to be significantly extended. A similar table for the PSPC sources in Fig. 1 detected outside of the D25 ellipse is given in Table 7 in the appendix (A).
| Src. | R.A. (J2000) Dec | Rerr | Lik. | Net counts | Ct. rate | Hardness ratios | ||||
|---|---|---|---|---|---|---|---|---|---|---|
| () | () | () | (ks-1) | (HR1) | (HR2) | () | () | |||
| (1) | (2) | (3) | (4) | (5) | (6) | (7) | (8) | (9) | (10) | (11) |
| P15 | 00 54 40.62 | -37 32 02.6 | 13.3 | 32.3 | 53.0(10.5) | 1.3(3) | 0.36(29) | 0.13(21) | 2.3(0.5) | 11.9 |
| P17 | 00 55 17.90 | -37 33 15.6 | 11.7 | 38.4 | 46.8(9.9) | 1.1(2) | 1.00(00) | 0.40(19) | 2.0(0.4) | 10.5 |
| P18 | 00 54 15.60 | -37 33 15.6 | 15.2 | 19.0 | 40.6(10.3) | 1.0(3) | 0.36(54) | 0.17(27) | 1.7(0.4) | 9.2 |
| P25 | 00 55 27.34 | -37 36 48.1 | 14.3 | 37.3 | 55.0(10.7) | 1.3(3) | 0.68(30) | 0.38(18) | 2.3(0.5) | 12.3 |
| P26 | 00 54 14.01 | -37 37 07.0 | 14.8 | 19.8 | 19.7(8.2) | 0.5(2) | 1.00(00) | 0.92(22) | 0.8(0.3) | 4.4 |
| P28 | 00 55 29.96 | -37 37 55.9 | 20.8 | 13.9 | 20.3(8.7) | 0.5(2) | 1.00(00) | 0.77(26) | 0.9(0.4) | 4.5 |
| P29 | 00 54 31.90 | -37 38 26.4 | 10.9 | 32.4 | 39.7(9.4) | 0.9(2) | 1.00(00) | 0.15(21) | 1.7(0.4) | 8.7 |
| P30 | 00 55 26.41 | -37 38 29.2 | 19.9 | 18.7 | 37.9(10.6) | 0.9(3) | 0.84(45) | 0.51(16) | 1.6(0.4) | 8.4 |
| P32 | 00 54 50.56 | -37 38 51.5 | 8.9 | 71.8 | 57.4(10.2) | 1.3(2) | 1.00(00) | 0.75(15) | 2.4(0.4) | 12.5 |
| P33 | 00 55 11.01 | -37 38 59.3 | 7.3 | 219.3 | 237.5(18.3) | 5.6(4) | -0.73(05) | -1.00(00) | 9.9(0.8) | 52.1 |
| P35 | 00 54 49.82 | -37 40 01.0 | 11.8 | 27.5 | 40.0(9.4) | 0.9(2) | 1.00(00) | -0.12(21) | 1.7(0.4) | 8.7 |
| P36 | 00 55 42.08 | -37 40 29.5 | 17.2 | 20.1 | 36.8(10.1) | 0.9(2) | 0.64(75) | -0.26(23) | 1.6(0.4) | 8.3 |
| P38 | 00 54 41.10 | -37 40 48.9 | 6.7 | 158.7 | 116.6(13.3) | 2.7(3) | 0.87(14) | -0.33(10) | 4.8(0.5) | 25.4 |
| P41 | 00 54 45.41 | -37 41 43.6 | 7.8 | 105.7 | 96.4(12.5) | 2.3(3) | 0.90(19) | -0.12(13) | 4.0(0.5) | 21.0 |
| P42 | 00 55 10.13 | -37 42 13.1 | 4.3 | 2458.7 | 1015.8(33.5) | 24.0(8) | 0.52(03) | 0.06(04) | 42.2(1.4) | 222.5 |
| P44 | 00 54 37.82 | -37 42 51.5 | 9.3 | 56.9 | 56.9(10.5) | 1.3(2) | 1.00(00) | 0.24(16) | 2.4(0.4) | 12.4 |
| P45 | 00 54 57.98 | -37 43 06.7 | 15.9 | 10.8 | 29.4(9.0) | 0.7(2) | 0.26(57) | 0.46(33) | 1.2(0.4) | 6.4 |
| P48 | 00 55 42.85 | -37 44 36.7 | 16.5 | 25.1 | 51.6(10.9) | 1.3(3) | 0.25(27) | -0.03(23) | 2.2(0.5) | 11.7 |
| P49 | 00 55 16.01 | -37 44 39.3 | 12.1 | 49.1 | 62.9(11.4) | 1.5(3) | 0.76(23) | -0.16(16) | 2.6(0.5) | 13.9 |
| P50 | 00 54 33.71 | -37 44 44.2 | 12.2 | 23.8 | 34.8(8.9) | 0.8(2) | 0.86(55) | 0.32(24) | 1.4(0.4) | 7.6 |
| P51 | 00 54 48.28 | -37 45 43.7 | 21.4 | 12.5 | 28.2(9.4) | 0.7(2) | 1.00(00) | 0.48(21) | 1.1(0.4) | 6.2 |
| P54 | 00 54 48.49 | -37 46 58.0 | 11.7 | 38.5 | 43.9(9.7) | 1.0(2) | 0.97(41) | 0.64(13) | 1.8(0.4) | 9.7 |
| P56 | 00 55 20.89 | -37 48 14.0 | 8.5 | 91.9 | 127.1(14.2) | 3.1(3) | -0.18(11) | -0.36(15) | 5.4(0.6) | 28.5 |
| P57 | 00 54 46.90 | -37 48 21.2 | 17.0 | 11.1 | 20.2(7.8) | 0.5(2) | 1.00(00) | 0.49(32) | 0.8(0.3) | 4.5 |
| P58 | 00 55 11.08 | -37 48 35.5 | 5.4 | 618.1 | 309.5(19.6) | 7.5(5) | 0.82(08) | 0.01(07) | 13.1(0.8) | 69.2 |
| P59 | 00 55 11.51 | -37 49 44.2 | 13.1 | 37.0 | 71.6(11.9) | 1.7(3) | 0.57(23) | 0.20(17) | 3.0(0.5) | 16.1 |
2.2 HRI
As discussed earlier, we expected the total PSPC observation to be far more sensitive than the total HRI observation. Nevertheless we reduced the entire HRI data collected at three epochs after the PSPC observations (see Table 1) to check for time variability of sources, resolve confused sources and to obtain improved source positions.
For the analysis we screened the observations for good time intervals longer than 10 s; we made no further selections on low background times (which would have reduced the accepted time by 32%) as we were mainly interested in point-like sources and for this purpose, we were still photon limited. Before merging the datasets for source detection, we checked the attitude solution of the individual observations using three relatively bright sources detected in all 3 observations (H3, H13, and H16 of Fig. 3). The positions of these sources in the individual pointings agree to better than ″, and we therefore did not correct the attitude of the pointings before merging the data. As with the PSPC, source detection and position determination was then performed over the full field of view on the merged dataset with the EXSAS local detect, map detect, and maximum likelihood algorithms (Zimmermann et al. 1994), using images of pixel size 5″, restricted to HRI raw channels 1–8 to reduce the detector background. We accepted sources with a likelihood as HRI detections. The resulting source list was then shifted with respect to the star HD5403, as done to improve the PSPC field positioning.
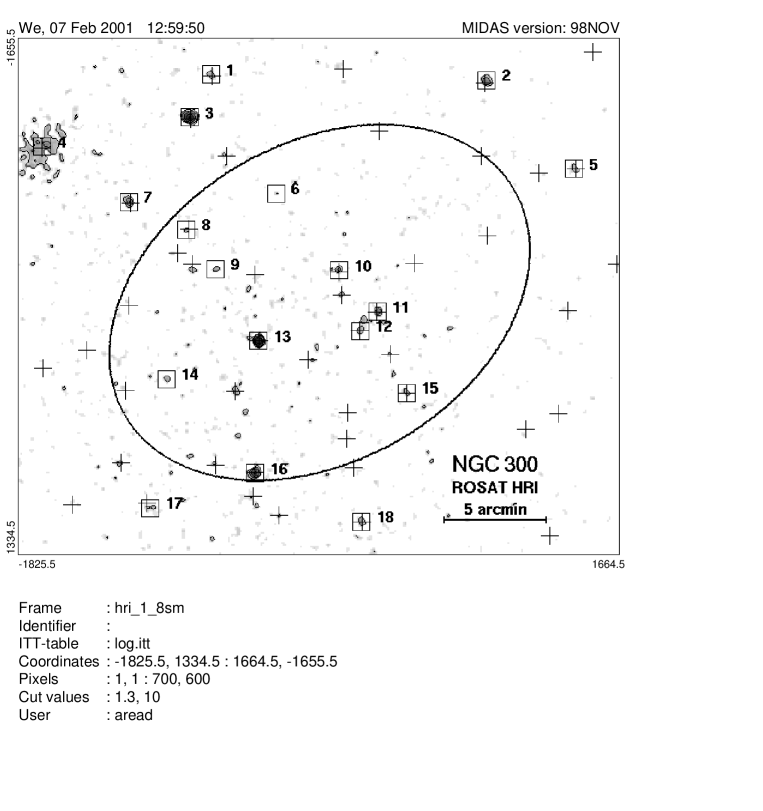
Figure 3 shows a full, 39.7 ks HRI contour image (channels 18) of the central 29′25′ region (i.e. equivalent in area to Figs. 1 & 2). Within the area covered by Fig. 3, 18 HRI sources are detected (with a likelihood 8), their source numbers marked in the figure, 10 of which lie within the optical disk of NGC 300 (as again indicated by the D25 ellipse). Crosses in Fig. 3 mark the positions of PSPC-detected sources (Fig. 1). In Table 3, similarly to Table 2, we list these 10 HRI sources as follows: source number (Col. 1), corrected right ascension and declination (Cols. 2, 3), error on the source position (Col. 4, including a 39 systematic attitude solution error), likelihood of existence (Col. 5), net broad band counts and error (Col. 6), and count rates and errors after applying deadtime and vignetting corrections (Col. 7). The 0.12.4 keV flux assuming again a 5 keV thermal bremsstrahlung model and Galactic absorption is given (Col. 8), as is the X-ray luminosity (Col. 8), assuming an NGC 300 source distance of 2.1 Mpc. Finally, an identification column is given (Col. 10), listing which PSPC source (if any) is a likely counterpart. Finally note that only one of the 18 sources is observed to be significantly extended (H4 at a likelihood of 82.9; see Sect. 3.2). A similar table for the HRI sources in Fig. 3 detected outside of the D25 ellipse is given in Table 8 in Appendix A.
| Src. | R.A. (J2000) Dec | Rerr | Lik. | Net counts | Ct. rate | PSPC ID | |||
|---|---|---|---|---|---|---|---|---|---|
| () | () | () | (ks-1) | () | () | ||||
| (1) | (2) | (3) | (4) | (5) | (6) | (7) | (8) | (9) | (10) |
| H6 | 00 55 05.65 | -37 35 08.3 | 5.8 | 9.2 | 12.6(4.4) | 0.3(1) | 1.6(0.6) | 8.6 | |
| H8 | 00 55 27.61 | -37 36 53.5 | 5.9 | 11.5 | 18.3(5.5) | 0.5(1) | 2.4(0.7) | 12.6 | P25 |
| H9 | 00 55 20.58 | -37 38 48.5 | 6.1 | 9.4 | 14.7(4.9) | 0.4(1) | 1.9(0.6) | 10.0 | |
| H10 | 00 54 50.24 | -37 38 49.5 | 5.4 | 22.3 | 25.8(6.0) | 0.7(2) | 3.3(0.8) | 17.4 | P32 |
| H11 | 00 54 40.65 | -37 40 49.9 | 5.4 | 23.2 | 35.1(7.1) | 0.9(2) | 4.5(0.9) | 23.7 | P38 |
| H12 | 00 54 45.04 | -37 41 48.5 | 6.2 | 11.1 | 18.5(5.5) | 0.5(1) | 2.4(0.7) | 12.4 | P41 |
| H13 | 00 55 10.00 | -37 42 15.8 | 4.2 | 720.5 | 295.0(17.7) | 7.5(5) | 37.7(2.3) | 199.1 | P42 |
| H14 | 00 55 32.46 | -37 44 07.7 | 6.9 | 8.5 | 20.0(6.3) | 0.5(2) | 2.6(0.8) | 13.8 | |
| H15 | 00 54 33.59 | -37 44 48.1 | 5.5 | 12.3 | 14.7(4.6) | 0.4(1) | 1.9(0.6) | 10.0 | P50 |
| H16 | 00 55 10.89 | -37 48 40.5 | 4.6 | 179.0 | 118.2(11.9) | 3.1(3) | 15.5(1.6) | 81.8 | P58 |
2.3 Time variability study of NGC 300 point sources
As mentioned earlier, two separate PSPC observations were carried out, a half year apart. The second of these (the larger) consisted of two, quite distinct periods of observation, separated by about three weeks. The complete observation was binned into these three observation periods; the December 1991 observation, and the two halves of the larger observation; the May 1992 and June 1992 observations.
A maximum likelihood search at the source positions given in Table 2 was performed for the three observation intervals, the vignetting and deadtime corrected count rates (and errors) calculated within a cut radius of the PSF FWHM at the source positions. Table 4 gives the count rates for the 26 sources for the three observation intervals plus the probability that the source is variable. As can be seen, a few of the sources appear variable, notably source P33. Two further sources that appear to be variable at greater than the 2 significance level, are sources P42 () and P58 ().
Because of the far fewer photons obtained with the HRI than with the PSPC, no large HRI time variability study was possible. Also, as we have, for the majority of sources, insufficient spectral information, no attempt was made at a variability study using variations between the PSPC and HRI count rates.
| Src. | PSPC Count rate (ks-1) | Probability | ||
|---|---|---|---|---|
| Dec. ’91 | May ’92 | Jun. ’92 | (variation) | |
| (1) | (2) | (3) | (4) | (5) |
| P15 | 1.5(0.6) | 1.4(0.5) | 1.2(0.4) | 22% |
| P17 | 1.2(0.5) | 1.5(0.4) | 0.8(0.4) | 44% |
| P18 | 1.4(0.6) | 0.7(0.4) | 1.0(0.4) | 37% |
| P25 | 1.2(0.5) | 2.1(0.5) | 0.9(0.4) | 60% |
| P26 | 0.9(0.5) | 0.5(0.4) | 0.4(0.3) | 35% |
| P28 | 1.5(0.8) | 0.9(0.4) | 0.2(0.3) | 62% |
| P29 | 0.1(0.4) | 0.9(0.4) | 1.4(0.4) | 72% |
| P30 | 1.1(0.7) | 0.9(0.5) | 1.0(0.4) | 18% |
| P32 | 1.1(0.5) | 1.7(0.4) | 1.2(0.4) | 42% |
| P33 | 0.0(0.4) | 7.4(0.8) | 7.5(0.8) | 100% |
| P35 | 0.5(0.4) | 1.3(0.4) | 1.0(0.4) | 52% |
| P36 | 0.5(0.5) | 0.8(0.4) | 1.2(0.4) | 43% |
| P38 | 3.3(0.8) | 3.1(0.6) | 2.3(0.4) | 50% |
| P41 | 2.3(0.7) | 2.4(0.5) | 2.4(0.5) | 16% |
| P42 | 21.0(1.6) | 22.6(1.3) | 27.1(1.3) | 80% |
| P44 | 0.7(0.5) | 1.4(0.4) | 1.7(0.4) | 55% |
| P45 | 0.6(0.4) | 0.0(0.4) | 1.4(0.4) | 71% |
| P48 | 0.5(0.5) | 1.9(0.5) | 1.2(0.4) | 65% |
| P49 | 1.7(0.6) | 1.3(0.4) | 1.8(0.5) | 35% |
| P50 | 1.1(0.5) | 0.7(0.4) | 0.8(0.3) | 31% |
| P51 | 0.7(0.6) | 1.2(0.4) | 0.3(0.3) | 62% |
| P54 | 0.9(0.5) | 1.4(0.4) | 0.9(0.3) | 36% |
| P56 | 4.4(0.8) | 2.0(0.5) | 3.4(0.6) | 75% |
| P57 | 0.2(0.3) | 0.7(0.4) | 0.5(0.3) | 47% |
| P58 | 7.5(1.1) | 5.6(0.7) | 9.3(0.8) | 83% |
| P59 | 1.8(0.7) | 2.0(0.5) | 1.7(0.5) | 23% |
3 Results
3.1 Point sources within NGC 300
As can be seen in Fig. 1, 26 PSPC sources are detected within or close to the D25 ellipse of NGC 300, and various X-ray properties of these are given in Tables 2 and 4. 10 HRI sources (the majority having PSPC counterparts) are also detected within the NGC 300 D25 ellipse (Fig. 3), and these are listed in Table 3. Table 5 summarises the following section, giving the best identification of each X-ray source as discussed here. Firstly (Col. 3), the corresponding X-ray source from RPS97 (also P00) is given. Then (Col. 4) a ‘B’, ‘F’ or ‘-’ is given, indicating whether a bright, a faint or no DSS2 source is coincident (see Fig. 1). In confused cases (essentially within the central NGC 300 regions), a ‘c’ is given. A source identification is then given (Col. 5), curved brackets indicating that the identification is not definite, question marks indicating that it is significantly less so. Square brackets give the actual names of any particular SNR or H ii counterparts (from BL97 or P00).
Haberl & Pietsch (1999) found that, in classifying the PSPC-detected X-ray sources in the LMC, different sources (e.g. foreground stars, SSSs and SNRs) show distinctive hardness ratios on account of their different X-ray spectra. A very similar situation has also been seen in the SMC and in M33. In Fig. 4, hardness ratio 1 (HR1) versus hardness ratio 2 (HR2) is plotted for the 26 sources discussed above lying within or close to the D25 NGC 300 ellipse. On the plot, lines delineate the parameter space regions found by Haberl & Pietsch (1999) to be populated with distinctly different sources, as follows; A: supersoft X-ray sources (SSSs), B: foreground stars, C: supernova remnants, D: mixture of all types (though mainly XRBs and AGN). Also indicated are sources for which we believe we have a fairly good identification, though an identification not based on any hardness ratio arguments, i.e. based purely on other observational evidence. It is worth noting that variations in absorbing column both to and within NGC 300 and M31 will alter the positions of the lines in Fig. 4 somewhat, but only by a small amount ( in HR) compared to the typical source HR errors. We have here used this hardness ratio information together with the variability studies presented earlier and observations at other wavelengths in classifying the NGC 300 sources. Much of the information is summarized in Table 5, though some additional explanation and clarification as regards a few of the individual sources is also given here.
A point to bear in mind is the subject of background AGN. An estimate of the number of background sources (predominately AGN and QSOs) expected at or above our limiting flux level within a sky area the size of the NGC 300 D25 ellipse ( sq. degrees) can be obtained by making use of the function from Hasinger et al.’s (1998) deep ROSAT X-ray survey of the Lockman Hole. This number turns out to be about 45, though we note that the nearer their projected position to the centre of NGC 300, the harder they would be to detect.
One can also compare the surface density of PSPC and HRI sources inside and outside of the NGC 300 D25 ellipse, to obtain a perhaps more direct measure of the AGN contamination within the galaxy. Counting the number of unidentified PSPC sources outside of the D25 ellipse and scaling this for the areas in question, one obtains a figure of 9 for the number of unidentified (possibly background AGN) PSPC sources expected within a NGC 300 D25 ellipse in this part of the X-ray sky. The equivalent figure using the HRI data comes out rather lower, more like 34. Problems with this method include the fact that all of the unidentified non-D25 sources are unlikely to be AGN, and some of course, may be in reality truly associated with NGC 300. All this said, we expect the AGN contamination within the NGC 300 disk to be anything from to perhaps more than double this value. The source identification column (Col. 5) of Table 5 includes ‘AGN’ entries, where we are fairly sure that the source is a background AGN, but also ‘acc.’ entries, where the source appears to be accreting in nature, though whether it is background or related to NGC 300 is difficult to say.
All the sources detected by RPS97 (and used in the P00 study) are detected. All 12 of the newly detected NGC 300 PSPC sources have a net counts value less than 50 (except for P59, which, though significantly visible in the RPS97 study, lay outside their area of interest, and was hence not included in their list). All 14 RPS97 sources re-detected here have a net counts value greater than 50, except for sources P29 and P30, the least significant of the sources listed in RPS97/P00. (Note RPS97 source 14 corresponds to non-D25 source P24).
| PSPC | HRI | Identifications | ||
|---|---|---|---|---|
| Src. | Src. | (RPS97) (DSS2) | (type/[name]) | |
| (1) | (2) | (3) | (4) | (5) |
| P15 | 3 | - | (Star?) | |
| P17 | F | (AGN) | ||
| P18 | - | (Star?) | ||
| H6 | F | (?) | ||
| P25 | H8 | 13 | F | (Acc.?) |
| P26 | F | (Acc.?) | ||
| P28 | F | (Acc.?) | ||
| P29 | 1 | c | SNR[BL97-S6] | |
| P30 | 12 | F | (Acc.?) | |
| H9 | c | (?) | ||
| P32 | H10 | 6 | c | (XRB) |
| P33 | 9 | c | SSS | |
| P35 | c | H ii[BL97-H13] (SNR) | ||
| P36 | F | (SNR) | ||
| P38 | H11 | 4 | c | SNR[BL97-S10] |
| P41 | H12 | 5 | c | (SNR) |
| P42 | H13 | 7 | c | BHXRB |
| P44 | 2 | c | (XRB) ([P00-SNR3]?) | |
| P45 | c | Star | ||
| H14 | - | (?) | ||
| P48 | 15 | B | (Star) | |
| P49 | 10 | c | SNR[BL97-S26] | |
| P50 | H15 | F | (?) | |
| P51 | F | (Acc.?) | ||
| P54 | - | (Acc.?) | ||
| P56 | 11 | F | (Star) ([P00-SNR15]?) | |
| P57 | - | (Acc.?) | ||
| P58 | H16 | 8 | B | (AGN) |
| P59 | F | (AGN) | ||
The brightest source, P42, lies within the inner spiral arms of NGC 300. No SNR, giant H or H ii regions are seen coincident (BL97), and it is likely an accreting binary. Note that the Eddington limit for a compact object is erg s-1, so source P42’s X-ray emission may suggest the prescence of a more massive () black hole X-ray binary. P33 is both extremely soft (note the hardness ratios given in Table 2 and the soft- and hard-band images in Fig. 2) and extremely variable; it is not detected at all in the December 1991 observation, but is seen to be very bright in the May/June 1992 observation. Also the source is not detected at all in any of the HRI observations (see Fig. 3). No counterparts are seen, and it appears to be another example of a supersoft source (SSS), extremely soft X-ray sources, quite often seen to be variable (see Kahabka & van den Heuvel 1997 for a review). P38 (H11) lies coincident with a SNR (S10; BL97), also confirmed by optical spectroscopy (DDB2; D’Odorico & Dopita 1983). Close by, P41 (H12) is similarly HR2-soft and is non-variable. Two bright H knots are visible, and this source may also be a SNR, as also suggested by P00. P49 lies 6.6′′ offset from SNR S26 (BL97), also confirmed by optical spectroscopy (DDB5; D’Odorico & Dopita 1983). Although not formally detected in the HRI data, some HRI emission from this position is evident (Fig. 3). P32 (H10) has no nearby counterparts, and is likely to be an accreting binary. Similarly, P44 lies coincident with bright H knots, and P00 suggest that it may be associated with a possibly radio-detected SNR (their SNR3). Given its hard X-ray HR2 however, it is more likely to be accreting in nature. Interestingly, the X-ray feature visible just to the south-east of P44 is coincident with a SNR (S11; BL97). It may be worth noting here that, even with the greater sensitivity of the present work over RPS97, and the larger source list, no further X-ray counterparts to the new candidate SNRs of P00 are detected (apart from the ones listed in P00). Sources P29 and P35 are similarly bright and hard. P29 lies less than 1′′ from SNR S6 (BL97), and the hint of variability and the spectral hardness may indicate that some emission from a more compact harder component, perhaps at the centre of the remnant, is contributing. P35, coincident with a H ii region (No. 13; BL97), is likely also SNR-related. Lastly, the hardness of P45 points to it being a (very variable) foreground star.
To the north, the hard P17 has a DSS2 optical counterpart, and is likely a background AGN, while sources P15 and P18, given their hardness ratos, are more likely stellar in origin. To the south, P58 (H16), and P59 are highly likely to be associated with distant AGN. Though P00 discuss P56 (or rather RPS97 source 11) as a candidate SNR (their SNR15), given P56’s softness, and its position at the very edge of the NGC 300 disk, the likely counterpart is probably a foreground star. Note that HRI emission is evident at the positions of P59 and P56. Sources P51, P54 and P57, given their hardness, are probably accreting objects, though whether they are foreground objects, objects within NGC 300, or distant AGN is difficult to say. To the east, P48 lies exactly coincident with a very bright DSS2 point source (very apparent in Fig. 1), and is likely a foreground star. P36 has a very faint optical counterpart and is more likely SNR-related. As regards P25 (H8), P28 and P30, faint DSS2 counterparts do exist in each case, and only conclusions similar to those drawn as regards the P51/P54/P57 triple can be drawn here.
The formal HRI detection algorithm picks up a further three sources within the D25 ellipse not formally detected in the PSPC, namely H6, H9 & H14. These though are detected with the lowest values of existence likelihood (less than 10), and cannot be solidly believed without additional evidence. No SNRs, H ii regions or significant DSS2 sources are visible at the positions of these three.
3.2 Other point sources
Although we here concentrate on the point source population within NGC 300, a few of the surrounding sources are interesting, and it is worth referring to Figs. 1 & 3 and to Tables 7 and 8 in Appendix A.
The non-variable P14 (H3) is associated with the prominent bright star, HD5403 (visible to the north-east of NGC 300 in Fig. 1), and has been used to improve both the X-ray PSPC and HRI positions.
North-east and east of P14 lies the () galaxy cluster Abell S0102 (Abell et al. 1989), the central galaxies of which themselves show some extremely interesting X-ray and radio properties (Read et al. 2001). Cappi et al. (1998) have recently shown that part of the Abell S0102 cluster is in fact a separate, more distant () cluster, CL 0053-37, and this cluster is entirely coincident with P16 (H4), the highly extended (likelihood of extent being [PSPC] , [HRI] ), bright source to the far north-east of Fig. 1. Several distant galaxy-like sources are visible in the optical associated with P16 (Fig. 1). Again, no evidence for PSPC or HRI variability is observed.
P37 appears marginally extended (likelihood of extent, 9.8), perhaps due to its emission being from two bright optical sources in the vicinity, one of which is also an NRAO VLA radio source (NVSS J005353-374020; Condon et al. 1998). Similarly, P47 (again of marginal extent, the extent likelihood being 9.9) appears likely associated with QSO 005342.1-375947 (Iovino et al. 1996), P53 with the radio source MRC 0051-380 (Condon et al. 1998), and P63 with the galaxy B005241.34-380658.4 (Maddox et al. 1990).
4 Discussion
4.1 Emission components within NGC 300
We have attempted to identify above as many of the X-ray sources within NGC 300 as possible. Once we eliminate from the source list those sources we are fairly sure do not belong to NGC 300, namely (see Table 5) sources P17, P45, P48, P56, P58 & P59, then one arrives at a total (0.12.4 keV) X-ray luminosity of point sources within NGC 300 of erg s-1 (assuming a distance of 2.1 Mpc). Note that the number of believed background AGN excluded from the list is consistent with the number expected statistically from deep ROSAT surveys. Note though that we have been rather conservative in removing the sources a number of the ‘acc.’ sources may well be unrelated to NGC 300 also.
Comparing the PSPC broad-band total counts within the NGC 300 D25 ellipse with the counts detected in (all) the D25 sources, one detects a small amount of residual emission, presumably due to unresolved point sources and/or genuine hot gas. In order to calculate this residual non-source NGC 300 flux, one needs to take the background into account. Variations in the background outside of NGC 300 and of source regions however, are comparable with the level of the residual NGC 300 emission itself, and so only a very approximate value of residual NGC 300 PSPC counts can be estimated. This small number of counts, together with the large uncertainties in the background outside of NGC 300 made any spectral fitting of this residual emission rather impossible. Assuming a 0.25 keV thermal bremsstrahlung model, typical of relatively inactive normal spiral galaxies (e.g. RPS97), with a hydrogen column density of cm-2 (i.e. no intrinsic NGC 300 absorption), then we arrive at a (0.12.4 keV) flux of erg cm-2 s-1, and a luminosity ( Mpc) of erg s-1. This gives rise to a total (0.12.4 keV) X-ray luminosity, i.e. sources plus residual (diffuse gas and unresolved sources) emission, of erg s-1, the residual emission fraction (the fraction of the luminosity due to residual emission) being %.
4.2 The X-ray source luminosity distribution in NGC 300
Figure 5 shows the luminosity distribution of the X-ray sources in NGC 300, as a function of the mass of neutral hydrogen. Also shown, for comparison, are the corresponding distributions for seven other well-known nearby spirals galaxies (strong nuclear sources having been removed), this adapted from Fig. 14 of Wang et al. (1999), the values for M83 having been updated (Immler et al. 1999). All values for the neutral hydrogen mass are taken from Tully (1988).
Though in the case of NGC 300, we are dealing with rather low number statistics when compared with the other systems (hence the larger errors), NGC 300’s X-ray source luminosity distribution does not appear significantly different from the others, and all the galaxies appear to have very similar H i-normalised luminosity distributions. The suggestion of an increase in NGC 300’s distribution at the low-luminosity end may be attributed to a small underestimation of the H i mass of NGC 300 in Tully (1988) compared with more recent studies, e.g. Puche & Carignan (1991) (the Tully (1988) value has been used in Fig. 5 for the sake of consistency with the other systems). It is certainly true that the perhaps ‘relative steepness’ of NGC 300’s source luminosity distribution can also be brought into line with the other systems, if 2 or 3 of the questionable ‘acc.’ sources (see Table 5) are removed. We have been here slightly conservative, in removing only sources we are fairly sure do not belong to NGC 300 it may well be the case, and Fig. 5 seems to bear this out, that a couple of the low luminosity sources may well not belong to NGC 300. Finally note that, although no very bright sources are seen in NGC 300, none are also seen in the other normal, quiescent galaxies M31 and M33. NGC 300 therefore, in terms of the luminosity distribution of its X-ray sources, appears in no way unusual.
4.3 NGC 300 as a member of the Sculptor group
The Sculptor group is probably the nearest small group of galaxies to our own Local Group, and the individual members have been studied in great detail. Kinematical studies (e.g. Puche & Carignan 1988) have established the group to be made up of five major members (NGC 55, NGC 247, NGC 253, NGC 300 and NGC 7793). Other smaller galaxies, such as NGC 24 and NGC 45, were found to be more distant, and although dwarf galaxies do exist within Sculptor (e.g. Lausten et al. 1977), they contribute essentially nothing to the group emission or dynamics.
The X-ray properties of the five members have been presented several times in the past (e.g. Schlegel et al. 1997; RPS97; Vogler & Pietsch 1999; Pietsch et al. 2000), and in discussing the ROSAT PSPC observations of NGC 7793 (Read & Pietsch 1999, hereafter RP99), a comparison of the Sculptor galaxies’ X-ray properties was presented, and it is well worth referring to RP99 here. A similar table to Table 5 of RP99 is given in Table 6. Various physical, X-ray and other multi-wavelength properties for the five prominent Sculptor members are given. All X-ray information for NGC 300 is taken from the present paper, while that for the remaining systems is taken from RPS97, apart from NGC 7793 (RP99). Given in the last column (12) is the ratio, the neutral hydrogen mass values taken from Tully (1988).
| Galaxy | Type | Diam. | Axis | Dist. | Log luminosity (erg s-1) | Luminosity ratios () | |||||
|---|---|---|---|---|---|---|---|---|---|---|---|
| (kpc) | ratio | (Mpc) | (erg s-1/) | ||||||||
| (1) | (2) | (3) | (4) | (5) | (6) | (7) | (8) | (9) | (10) | (11) | (12) |
| NGC 55 | SBS9 | 12.3 | 5.8 | 1.3 | 43.02 | 41.94 | 38.91 | 830 | 0.78 | 9.3 | 29.86 |
| NGC 247 | SXS7 | 13.1 | 3.1 | 2.1 | 42.96 | 41.48 | 38.68 | 330 | 0.52 | 16.0 | 29.78 |
| NGC 253 | SXS5 | 24.0 | 4.1 | 3.0 | 43.78 | 43.74 | 40.04 | 9100 | 1.80 | 2.0 | 30.26 |
| NGC 300 | SAS7 | 13.3 | 1.4 | 1.2 | 43.01 | 41.92 | 38.76 | 810 | 0.57 | 6.9 | 29.86 |
| NGC 7793 | SAS7 | 9.1 | 1.5 | 3.4 | 43.01 | 42.23 | 38.78 | 1700 | 0.59 | 3.6 | 30.08 |
What is interesting as regards NGC 300 is that now, the galaxy appears more ‘normal’ than previously reported. In RP99, the NGC 300 data reported, analysed in RPS97, assumed a distance of 1.2 Mpc (Tully 1988). Now we have assumed a distance, as described in the introduction, of 2.1 Mpc, based on several authors’ more recent work. Note that, correcting for the different assumed distances, the luminosity for NGC 300 quoted here and that in the RPS97 survey, where only a part of the NGC 300 PSPC data was analysed (and then only in a semi-automatic sense), agree rather well.
The most famous Sculptor member is probably NGC 253, a large X-ray and far-infrared bright starburst galaxy, while the remaining four systems are all very similar; physically small, normal (i.e. non-starburst), late-type spirals (NGC 253 is also a late-type spiral). The four normal Sculptor systems are also extremely similar in terms of their multiwavelength properties. The narrow range in especially , but also , evident in Table 6 (excluding NGC 253) is very striking (the larger range in observed is partly due to properties of NGC 7793 - see RP99).
Though this in itself is interesting, i.e. that the four normal Sculptor galaxies are extremely similar, and are therefore good examples of prototypical ‘normal’ galaxies, what is perhaps remarkable about NGC 300 is that it is the most ‘normal’ of the four. It is neither the brightest nor the dimmest galaxy in either the optical, the far-infrared or the X-ray band. Similarly, it has neither the largest nor the smallest value of , or flux ratio. Furthermore, H i studies and mass modelling of the Sculptor group galaxies (e.g. Puche & Carignan 1991) have shown that NGC 300 lies midway in every parameter space, e.g. mass-to-light ratio , H i mass etc. Note also NGC 300’s midway ratio.
As seen in Table 6, the other three normal Sculptor galaxies are unusual in some way; NGC 55 is X-ray bright, NGC 7793 is very far-infrared bright and NGC 247 is very far-infrared dim. NGC 300 however, is wholly unremarkable, both in terms of how it compares with its Sculptor neighbours and, as seen in Sect. 4.2, in how its X-ray source luminosity distribution compares with other nearby spiral galaxies. It is therefore perhaps one of the finest examples of a typical quiescent normal late-type spiral galaxy.
5 Summary
We have analysed all the ROSAT PSPC and HRI data from a field centred on the nearby face-on Sculptor galaxy NGC 300. 29 PSPC and HRI sources are detected within the optical confines of the galaxy. Many of the sources appear to be variable and we attempt to classify and identify the sources based on their temporal and spectral properties and using other multi-wavelength observations. In addition to point source emission, some evidence for unresolved residual emission is detected within NGC 300. Our findings with regard to the observed point-source and unresolved emission can be summarized as follows:
1. 26 PSPC sources are detected within the D25 ellipse of NGC 300, as are 10 HRI sources (all but the very dimmest having PSPC counterparts), and we present full source lists for these, detailing their X-ray properties.
2. The brightest source (- erg s-1) is likely a BHXRB, while a highly variable source nearby is seen to be a supersoft source. Other bright sources coincident with known SNRs and H ii regions are discussed, as are foreground stars and background AGN.
3. The present analysis attains a greater sensitivity than previous studies, and the number of believable X-ray sources within NGC 300 has been increased almost twofold. That said, no further X-ray counterparts to new candidate SNRs have been detected.
4. Residual X-ray emission is observed within NGC 300, due probably to unresolved sources and genuine diffuse gas. This emission ( erg s-1) accounts for approximately 20% of the total X-ray luminosity of NGC 300 ( erg s-1).
5. Detailed PSPC and HRI source lists are also presented for sources detected outside of NGC 300, and we briefly discuss a number of them, notably the galaxy cluster CL 0053-37.
6. The X-ray source luminosity distribution of NGC 300 is in no way unusual when compared with other nearby spiral galaxies. The observed lack of highly luminous X-ray sources is entirely consistent with other normal, quiescent spirals.
7. In terms of how the X-ray properties of NGC 300 compare with those of its neighbours in the Sculptor galaxy group, NGC 300 appears to be the most unremarkable of all the normal group members. It shows no unusual X-ray properties, nor oddities in multi-wavelength luminosities or ratios. It may the best example of a typical normal quiescent late-type spiral galaxy.
Acknowledgements.
We thank our colleagues from the MPE ROSAT group for their support, and we are especially grateful to Rodrigo Supper for reading the manuscript, and to the referee for comments which have greatly improved the paper. The ROSAT project is supported by the German Bundesministerium für Bildung und Forschung (BMBF) and the Max-Planck-Gesellschaft (MPG). Based on photographic data obtained using The UK Schmidt Telescope. The UK Schmidt Telescope was operated by the Royal Observatory Edinburgh, with funding from the UK Science and Engineering Research Council, until 1988 June, and thereafter by the Anglo-Australian Observatory. Original plate material is copyright (c) the Royal Observatory Edinburgh and the Anglo-Australian Observatory. The plates were processed into the present compressed digital form with their permission. The Digitized Sky Survey was produced at the Space Telescope Science Institute under US Government grant NAG W-2166.Appendix A ROSAT PSPC and HRI sources outside of NGC 300
Here are tabulated the X-ray properties of the PSPC and HRI sources detected outside of the NGC 300 D25 ellipse.
Table 7 lists the PSPC values, as follows: source number (Col. 1), corrected right ascension and declination (Cols. 2, 3), error on the source position (Col. 4, including a 39 systematic attitude solution error), likelihood of existence (Col. 5), net broad band counts and error (Col. 6), and count rates and errors after applying deadtime and vignetting corrections (Col. 7), hardness ratios HR1 and HR2 (Cols. 8 & 9; see Sect. 2). Finally, the 0.12.4 keV flux and X-ray luminosity, assuming a 5 keV thermal bremsstrahlung model and a source distance of 2.1 Mpc (i.e. to NGC 300, which is here unlikely to be valid, hence the bracketed values), are given in Cols. 10 & 11.
Table 8 lists the HRI values in the same way as Table 7, except that no hardness ratios are given, hence the 0.12.4 keV flux and the (again bracketed) X-ray luminosity are given in Cols. 8 & 9. A final identification column is given (Col. 10), listing which PSPC source (if any) is a likely counterpart, whether any DSS2 candidates (as for Table 5), and the names of any known counterparts (see Sect. 3.2).
| Src. | R.A. (J2000) Dec | Rerr | Lik. | Net counts | Ct. rate | Hardness ratios | ||||
|---|---|---|---|---|---|---|---|---|---|---|
| () | () | () | (ks-1) | (HR1) | (HR2) | () | () | |||
| (1) | (2) | (3) | (4) | (5) | (6) | (7) | (8) | (9) | (10) | (11) |
| P8 | 00 53 48.25 | -37 28 10.5 | 7.5 | 648.8 | 433.2(24.0) | 11.5(0.6) | 0.81(05) | 0.18(06) | 20.2(1.1) | (106.6) |
| P9 | 00 54 49.43 | -37 29 02.3 | 16.2 | 22.5 | 48.9(10.8) | 1.2(0.3) | 0.10(34) | 0.42(22) | 2.1(0.5) | ( 11.3) |
| P10 | 00 55 21.53 | -37 29 21.1 | 8.3 | 149.4 | 183.5(17.2) | 4.6(0.4) | 0.17(12) | 0.15(10) | 8.1(0.8) | ( 43.0) |
| P11 | 00 54 14.70 | -37 29 42.5 | 7.1 | 407.4 | 292.1(20.2) | 7.4(0.5) | 0.68(07) | 0.11(07) | 13.0(0.9) | ( 68.7) |
| P14 | 00 55 26.80 | -37 31 26.5 | 4.8 | 1966.9 | 1148.6(36.5) | 28.5(0.9) | -0.20(03) | -0.27(05) | 50.2(1.6) | (264.8) |
| P16 | 00 56 03.21 | -37 32 49.9 | 6.7 | 1388.7 | 2779.0(60.9) | 73.4(1.6) | 0.74(02) | 0.28(02) | 129.2(2.8) | (681.7) |
| P20 | 00 53 52.41 | -37 33 51.3 | 10.9 | 102.5 | 129.9(15.3) | 3.3(0.4) | 0.33(16) | -0.06(12) | 5.8(0.7) | ( 30.5) |
| P21 | 00 54 01.39 | -37 34 05.2 | 21.7 | 26.6 | 44.1(11.7) | 1.1(0.3) | 1.00(00) | 0.27(20) | 1.9(0.5) | ( 10.2) |
| P24 | 00 55 41.63 | -37 35 32.0 | 5.8 | 458.5 | 329.6(20.5) | 8.2(0.5) | 0.59(07) | -0.17(07) | 14.3(0.9) | ( 75.7) |
| P31 | 00 53 42.34 | -37 38 28.3 | 16.9 | 28.7 | 40.8(10.4) | 1.0(0.3) | 1.00(00) | 0.42(18) | 1.8(0.5) | ( 9.6) |
| P37 | 00 53 54.31 | -37 40 44.7 | 27.6 | 24.7 | 90.9(17.9) | 2.2(0.4) | 0.38(24) | 0.12(17) | 3.9(0.8) | ( 20.8) |
| P43 | 00 55 52.37 | -37 42 40.2 | 24.9 | 12.8 | 44.5(11.4) | 1.1(0.3) | -0.21(26) | 0.04(32) | 1.9(0.5) | ( 10.2) |
| P47 | 00 56 03.16 | -37 43 30.9 | 24.3 | 62.4 | 68.9(12.3) | 1.8(0.3) | 0.56(17) | 0.19(15) | 3.1(0.6) | ( 16.3) |
| P52 | 00 53 56.52 | -37 45 45.3 | 31.1 | 10.0 | 17.2(9.6) | 0.4(0.2) | 1.00(00) | 0.72(26) | 0.8(0.4) | ( 4.0) |
| P53 | 00 54 04.39 | -37 46 30.3 | 18.9 | 15.6 | 38.8(10.9) | 0.9(0.3) | -0.33(23) | 0.51(28) | 1.7(0.5) | ( 8.8) |
| P55 | 00 55 44.10 | -37 48 07.3 | 13.4 | 32.6 | 46.6(10.6) | 1.2(0.3) | 1.00(00) | 0.06(21) | 2.0(0.5) | ( 10.8) |
| P61 | 00 55 37.70 | -37 50 05.4 | 21.9 | 12.4 | 33.9(10.7) | 0.8(0.3) | 1.00(00) | 0.44(30) | 1.5(0.5) | ( 7.9) |
| P62 | 00 55 56.15 | -37 50 09.5 | 14.7 | 79.7 | 142.1(17.3) | 3.7(0.5) | 0.64(13) | 0.26(11) | 6.5(0.8) | ( 34.1) |
| P63 | 00 55 05.17 | -37 50 39.0 | 18.9 | 10.7 | 28.1(9.3 ) | 0.7(0.2) | 0.38(57) | 0.12(34) | 1.2(0.4) | ( 6.3) |
| P65 | 00 54 44.75 | -37 51 01.2 | 8.2 | 137.3 | 121.1(13.8) | 2.9(0.3) | 0.58(16) | 0.02(12) | 5.2(0.6) | ( 27.3) |
| P66 | 00 53 58.59 | -37 51 38.7 | 20.3 | 28.4 | 53.7(11.7) | 1.4(0.3) | 0.61(35) | 0.58(19) | 2.4(0.5) | ( 12.8) |
| Src. | R.A. (J2000) Dec | Rerr | Lik. | Net counts | Ct. rate | Ident. | ||||
|---|---|---|---|---|---|---|---|---|---|---|
| () | () | () | (ks-1) | () | () | |||||
| (1) | (2) | (3) | (4) | (5) | (6) | (7) | (8) | (9) | (10) | |
| H1 | 00 55 21.48 | -37 29 20.6 | 8.1 | 11.4 | 37.5(9.7) | 1.0(0.3) | 5.1(1.3) | ( 27.0) | P10 | F |
| H2 | 00 54 14.09 | -37 29 38.8 | 6.4 | 56.2 | 96.7(12.9) | 2.7(0.4) | 13.3(1.8) | ( 70.3) | P11 | F |
| H3 | 00 55 26.80 | -37 31 26.0 | 4.8 | 410.3 | 290.5(18.8) | 7.8(0.5) | 39.2(2.5) | (206.7) | P14 | HD5403 |
| H4 | 00 56 02.91 | -37 32 49.3 | 8.0 | 80.3 | 475.9(33.3) | 13.4(0.9) | 67.0(4.7) | (353.7) | P16 | CL0053-37 |
| H5 | 00 53 52.66 | -37 33 54.6 | 8.2 | 15.4 | 47.6(10.7) | 1.3(0.3) | 6.6(1.5) | ( 34.7) | P20 | (AGN) |
| H7 | 00 55 41.72 | -37 35 32.9 | 5.8 | 46.3 | 63.6(10.0) | 1.7(0.3) | 8.5(1.3) | ( 44.9) | P24 | F |
| H17 | 00 55 36.77 | -37 50 23.6 | 9.6 | 8.3 | 34.7(10.1) | 0.9(0.3) | 4.7(1.4) | ( 24.8) | P61 | - |
| H18 | 00 54 44.66 | -37 51 03.8 | 6.6 | 15.3 | 31.0(7.6 ) | 0.8(0.2) | 4.1(1.0) | ( 21.7) | P65 | F |
References
- (1) Abell G.O., Corwin H.G., Olowin R.P., 1989, ApJS 70, 1
- (2) Blair W.P., Long K.S., 1997, ApJS, 108, 261 [BL97]
- (3) Cappi A., Held E.V., Marano B., 1998, A&AS 129, 31
- (4) Ciliegi P., Elvis M., Wilkes B.J., Boyle B.J., McMahon R.G., 1997, MNRAS 284, 401
- (5) Condon J.J., Cotton W.D., Greisen E.W., Yin Q.F., Perley R.A., Taylor G.B., Broderick J.J., 1998, AJ 115, 1693
- (6) Côté S., Freeman K.C., Carignan C., Quinn P.J., 1997, AJ 114, 1313
- (7) Cruddace R.G., Hasinger G.R., Schmitt J.H.M.M., 1988, in Murtagh F., Heck A. (eds), Astronomy from large databases, ESO Conference and Workshop Proc. 28, p. 177
- (8) Davidge T.J., 1998, ApJ 497, 650
- (9) de Vaucouleurs G., de Vaucouleurs A., Corwin H.G., Jr., Buta R.J., Paturel G., Fouqué P., 1991, Third Reference Catalogue of Bright Galaxies (RC3). Springer-Verlag, New York
- (10) Dickey J.M., Lockman F.J., 1990, ARA&A 28, 215
- (11) D’Odorico S., Dopita M.A., 1983, in IAU Symp. 101, Supernova Remnants and Their X-ray Emission, eds. J. Danzinger & P. Gorenstein, Dordrecht:Reidel, p517
- (12) Freedman W.L., Madore B.F., Hawley S.L., Horowitz I.K., Mould J., Navarette M., Sallmen S., 1992, ApJ 396, 80
- (13) Haberl F., Pietsch W., 1999, A&A 139, 277
- (14) Hasinger G., Turner T.J., George I.M., Boese G., 1992, OGIP calibration memo CAL/ROS/92-001
- (15) Hasinger G., Burg R., Giacconi R., Schmidt M., Trümper J., Zamorani G., 1998, A&A 329, 482
- (16) Immler S., Vogler A.J., Ehle M., Pietsch W., 1999, A&A 352, 415
- (17) Iovino A., Clowes R., Shaver P., 1996, A&AS 119, 265
- (18) Kahabka P., van den Heuvel E.P.J., 1997, ARA&A 35, 69
- (19) Lausten S., Richter W., van der Lans J., West R.M., Wilson R.N., 1977, A&A 54, L639
- (20) Maddox S.J., Sutherland W.J., Efstathiou G., Loveday J., 1990, MNRAS 243, 692
- (21) Pannuti T.G., Duric N., Lacey C.K., Goss W.M., Hoopes C.G., Walterbos R.A.M., Magnor M.A., 2000, ApJ 544, 780 [P00]
- (22) Perryman M.A.C., et al., 1997, The Hipparcos and Tycho Catalogues (SP-1200), ESA Publications Division
- (23) Pfeffermann E., et al., 1986, Proc. SPIE 733, 519
- (24) Pietsch W., Trinchieri G., Vogler A.J., A&A 340, 351
- (25) Pietsch W., Vogler A.J., Klein U., Zinnecker H., 2000, A&A 360, 24
- (26) Puche D., Carignan C., 1988, AJ, 95, 1025
- (27) Puche D., Carignan C., 1991, ApJ, 378, 487
- (28) Read A.M., Pietsch W., 1999, A&A 341, 8 [RP99]
- (29) Read A.M., Ponman T.J., Strickland D.K., 1997, MNRAS 286, 626 [RPS97]
- (30) Read A.M., Filipović M.D., Pietsch W., Jones P.A., 2001, A&A 369, 467
- (31) Schlegel E.M., Barrett P., Kulinder P.S., 1997, AJ 113, 1296
- (32) Sandage A., Bedke J., 1988, Atlas of Galaxies: Useful for Measuring the Cosmological Distance Scale (NASA SP-496) (Washington:NASA)
- (33) Snowden S.L., McCammon D., Burrows D., Mendenhall J., 1994, ApJ 424, 714
- (34) Trümper J., 1983, Adv. Space Res. 2, 241
- (35) Tully R.B., 1988, Nearby Galaxies Catalogue. Cambridge University Press, Cambridge
- (36) Vogler A.J., Pietsch W., 1999, A&A 342, 101
- (37) Wang Q.D., Immler S., Pietsch W., 1999, ApJ 523, 121
- (38) Zang Z., Warwick R.S., Meurs E.J.A., 1997, Irish Atron.J., 24, 45
- (39) Zimmermann H.-U. et al., 1994, EXSAS User Guide, 4th edition