X-ray Line Emission from
Evaporating and Condensing Accretion Disk Atmospheres
Abstract
We model the X-rays reprocessed by an accretion disk in a fiducial low-mass X-ray binary system with a neutron star primary. An atmosphere, or the intermediate region between the optically thick disk and a Compton-temperature corona, is photoionized by the neutron star continuum. X-ray lines from the recombination of electrons with ions dominate the atmosphere emission and should be observable with the Chandra and XMM-Newton high-resolution spectrometers. The self-consistent disk geometry agrees well with optical observations of these systems, with the atmosphere shielding the companion from the neutron star. At a critical depth range, the disk gas has one thermally unstable and two stable solutions. A clear difference between the model spectra exists between evaporating and condensing disk atmospheres. This difference should be observable in high-inclination X-ray binaries, or whenever the central continuum is blocked by absorbing material and the extended disk emission is not.
1 Introduction
The X-rays reprocessed on accretion disks to the optical, UV and X-ray bands in both X-ray binaries and AGN could be one of our best probes of accretion disk structure and the environment around compact objects. It is convenient to study an illuminated disk around neutron star low-mass X-ray binaries (LMXB) since the central continuum dominates the energetics of the disk atmosphere and accretion disk corona (ADC), and the system geometry is often determined. Measurements of the optical magnitudes and lightcurve amplitudes of LMXB yielded estimates of the angle subtended by the disk of 12 and of the average fraction of X-rays reprocessed by the disk into the optical of (de Jong, van Paradijs, & Augusteijn, 1996). Models that seem to correctly describe the accretion disk interior have been unable to produce disk geometries consistent with the optical data (Dubus et al., 1999). Analytical models assuming an isothermal disk show better agreement with the data, yet produce illuminated disks that are significantly thinner than expected (Vrtilek et al., 1990).
A pure continuum incident on the gaseous disk will photoionize and heat the gas. Radiative heating sustains a K ADC and a smaller - K atmosphere emitting X-ray lines on top of the optically thick disk. X-ray spectra of LMXBs during dips show strong Comptonized emission plus an excess flux at 0.65 keV consistent with the same covering fraction (Church et al., 1998), positing that ADC and disks may coexist. The apparent size of the ADC and the disk may not be equal (Church, 2000), since the emission mechanisms have different radial dependence. Nayakshin, Kazanas & Kallman (2000) modeled the reprocessed continuum and fluorescence emission from the inner disk of AGN with an ADC, and Ko & Kallman (1994) modeled X-ray spectra of disk annuli in an LMXB with ADC and normally incident radiation.
In this paper, we calculate the structure of an accretion disk illuminated by the grazing radiation of a neutron star in an LMXB with a Compton-temperature ADC, building on a model by Raymond (1993). This model, which we will detail in a future paper, includes a more accurate calculation of the vertical and radial disk structure than previous models, accounts for thermal instabilities, and incorporates recent atomic model calculations that predict X-ray spectra at a resolution superior to the Chandra and XMM-Newton spectrometers. We obtain the first self-consistent flared disk geometry that matches the disk thickness expected from optical data, and we predict that broad X-ray lines will be observable and will provide, among other diagnostics, evidence for photo-evaporation, which is central to the origin of winds (Woods et al., 1996).
2 Model atmosphere
We consider an LMXB with a primary radiating an Eddington luminosity bremsstrahlung continuum with keV. We use a set of fiducial system parameters for a bright LMXB, so application to a particular source will require using the observed X-ray continuum to improve accuracy. The maximum radius of the centrally-illuminated disk is cm, so the orbital period day. The minimum radius is cm, below which the omitted effect of radiation pressure will dominate.
We obtain the vertical disk atmosphere structure of each annulus by integrating the hydrostatic balance and 1-D radiation transfer equations for a slab geometry:
| (1) |
| (2) |
| (3) |
while satisfying local thermal equilibrium:
| (4) |
where is the pressure, is the density, is the incident radiation field, is the reprocessed radiation propagating down towards the disk midplane, the vertical distance from the midplane, the gravitational constant, the grazing angle of the radiation on the disk, the radius, and is the local absorption coefficient. The difference between heating and cooling includes Compton scattering, bremsstrahlung cooling, photoionization heating, collisional line cooling, and recombination line cooling from H, He, C, N, O, Ne, Mg, Si, S, Ar, Ca, and Fe ions. We assume cosmic abundances (Allen, 1973). The code from Raymond (1993) computes the net heating and ionization equilibrium, Compton scattering, and line scattering using escape probabilities. A new disk structure calculation simultaneously integrates Eqs. 1-3 by the Runge-Kutta method using an adaptive stepsize control routine with error estimation, and Eq. 4 is solved by a globally convergent Newton’s method (Press, 1994). At the ADC height , the equilibrium is close to the Compton temperature , from which we begin to integrate downward until . The optically thick part of the disk, with temperature , is assumed to be vertically isothermal (Vrtilek et al., 1990). To get , we assume that the viscous energy and illumination energy is all locally radiated as blackbody radiation. That is, for and :
| (5) |
where is the neutron star radius, the accretion rate and luminosity, the Stephan-Boltzmann constant, and is the X-ray ‘albedo’ derived from optical observations (de Jong, van Paradijs, & Augusteijn, 1996), such that is the fraction of X-rays absorbed at the photosphere. The height at which the integration ends is defined as the photosphere height . Thus, the assumption is that for viscous dissipation dominates heating.
The boundary conditions at the ADC are set to , , and , where , is the Boltzmann constant, and is the average particle mass in units of the proton mass . The boundary conditions at for and are set free, and we use the shooting method (Press, 1994) with shooting parameter adjusted until we satisfy at the photosphere. Note is the viscosity () dependent density calculated for an X-ray illuminated Shakura & Sunyaev (1973) disk.
We calculate iteratively. To get self-consistently from Equation 5, we need . We neglect the term , which is valid for cm. After an initial guess for , we define it as the height where is attenuated by . We stop after and converge to %. Note for . Since is not physically determined, but it is bound by , we ran a second model calculating from , which we will use to estimate systematic errors due to the 1-D radiation transfer calculation.
3 Thermal instability of the photoionized gas
The disk atmosphere exhibits a thermally unstable region, which has direct consequences for the disk structure and X-ray spectrum. The origin of the thermal instability is well understood, and its behaviour depends on metal abundances and the local radiation spectrum (Hess, Kahn, & Paerels, 1997).
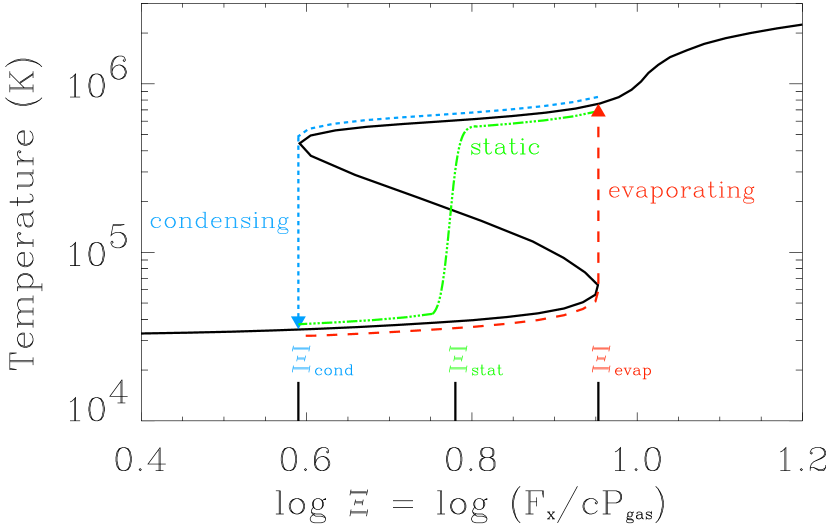
Within a range of pressure ionization parameters (), thermal equilibrium is achieved by three distinct temperatures, only two of which are stable to perturbations in (Fig. 1). , where is the radiation pressure and the gas pressure (Krolik, McKee & Tarter, 1981). The thermally stable branches have positive slope (Field, 1965). Previous spectral studies of illuminated accretion disks in LMXB had not explicitly selected the stable solutions (Ko & Kallman, 1994), a choice which affects X-ray production.
The instability implies a large temperature gradient as the gas is forced to move between stable branches, requiring the formation of a transition region whose size may be determined by electron heat conduction, convection, or turbulence, depending on which dominates the heat transfer. For simplicity, we neglect emission from the transition region. Upon calculation of the Field length , the lengthscale below which conduction dominates thermal equilibrium Begelman & McKee (1990), we estimate that conduction forms a transition layer times thinner than the size of the X-ray emitting zones. Nevertheless, X-ray line emission from the neglected conduction region may not be negligible in all cases (Li et al., 2001).
Conduction determines the dynamic behaviour of the gas. The dynamics will allow us to attach a physical interpretation to the chosen solutions from Fig. 1. Roughly, a static conduction solution can only be found if the transition region splits the instability -range in half (Fig. 1). This solution (Zeldovich & Pikelner, 1969) takes the low- stable branch at , and the high- stable branch at , separated by the transition layer at . A transition layer located away from will dynamically approach by a conduction driven mass flow. A transition layer at is moving towards lower , and the gas is evaporating from the low- branch to the high- branch. A transition layer at is moving towards higher , with the gas condensing to the low- branch (Zeldovich & Pikelner, 1969; Li et al., 2001).
We compute the disk structure for both condensing and evaporating solutions. We assume a steady state, condensing or evaporating mass flow through the transition layer at or , respectively. The static conduction solution is an intermediate case of the latter extreme cases. We take a single-valued , since a two-phase solution would be buoyantly unstable, making the denser (colder) gas sink. The evaporating disk corresponds to the low- branch, while the condensing disk corresponds to the high- branch (Fig. 1). This introduces spectral differences (section 6).
We do not know from first principles whether the disk atmosphere is evaporating, condensing, or static. We estimate the speed of the conduction mass flow to be , by using the characteristic conduction time at the Field length, where is the Spitzer (1962) conductivity (for a detailed discussion, see McKee & Begelman, 1990). We obtain a conduction mass flow speed which is 1-2 times the local sound speed. Thus, the phase dynamics will depend on the subsonic () flow patterns in the disk atmosphere, and these flows will also determine the evaporation or condensation rates.
The only physical mechanism known to transport the necessary angular momentum for disk accretion involves a magneto-rotational instability (MRI) which drives turbulent flow in the disk (Balbus & Hawley, 1998). Heat transfer due to this turbulent flow could quench the thermal instability and affect the disk structure. The MRI also favors our assumption of vertical isothermality in the optically thick disk.
4 Spectral modeling
With the disk structure , and ion abundances , we model the X-ray line emission from the disk atmosphere by using HULLAC (Hebrew University/Lawrence Livermore Atomic Code, Klapisch et al. (1977)). The code calculates the atomic structure and transition rates of radiative recombination (RR) and radiative recombination continuum (RRC) for the H-like and He-like ions of C, N, O, Ne, Mg, Si, S, Ar, Ca, and Fe XVII-Fe XXVI. The emissivities are calculated as described in Sako et al. (1999).
The spectrum for each annulus is added to obtain the disk spectrum. Each annulus consists of a grid of zones in the vertical direction, and , and for each zone are used to calculate the RR and RRC emissivities. The radiation is propagated outwards at inclination angle , including the continuum opacity of all zones above. Compton scattering is not included in the calculated spectrum because it is negligible in the vertical direction in the region where the line emission is formed. The spectrum is Doppler broadened by the projected local Keplerian velocity, assuming azimuthal symmetry.
5 Disk structure results
The self-consistent disk is thicker than would be expected from the local pressure scale height alone. We find . We fit the modeled photosphere and atmosphere height, and , with ( in cm), with fit parameters and . We find cm, +, + cm, . Thus, - and -+ . Estimated systematics are shown, if significant. Vrtilek et al. (1990) estimated , but in spite of the steeper radial dependence, the Vrtilek disk is thinner, and it equals for cm. For comparison to the optically derived disk thickness, is the de facto disk boundary, since a fraction of the central X-rays have been absorbed there. Thus, previous theoretical studies severely underestimated the disk thickness.
The atmosphere’s () maximum photoelectric opacity is always , although . Illumination heating dominates at cm (Eq. 5), where only of the incident photons reach directly, while reach after reprocessing in the atmosphere. Thus, the atmospheric albedo is . To reproduce the disk (atmosphere and photosphere) albedo observed by de Jong, van Paradijs, & Augusteijn (1996) (), the photosphere albedo can be , which is a range closer to physical expectations. There is no significant change in the atmosphere structure by varying from 1 to 0.1.
6 Spectral results
The LMXRB photon flux (photon cm-2 s-1 keV-1) is modeled by:
| (6) |
where is the neutron star continuum, is the RR line and RRC modeled flux, and are the neutral hydrogen absorption column densities and are the Morrison & McCammon (1983) absorption cross sections. The system is assumed to be 10 kpc away.
If we let in Eq. 6 with , the lines are swamped by the continuum. Thus, low inclination neutron star LMXBs are unlikely to have detectable X-ray lines from the disk. Instead, we consider cm-2 and cm-2 with , where an obscuring medium absorbs half of the continuum flux and is compact enough to leave the disk almost unobscured.
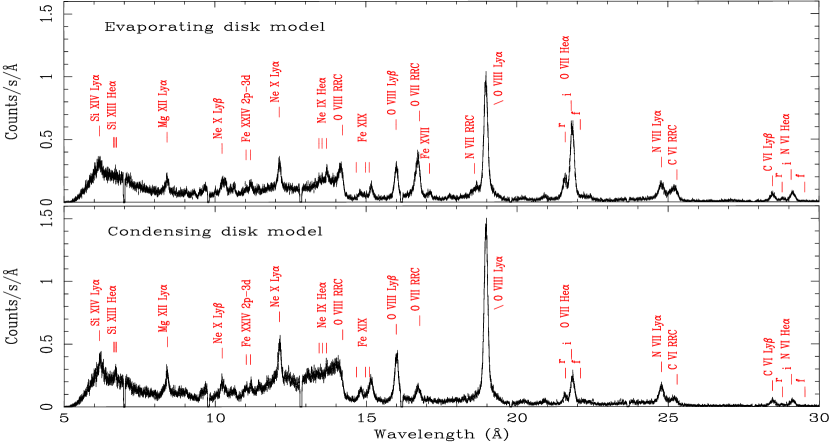
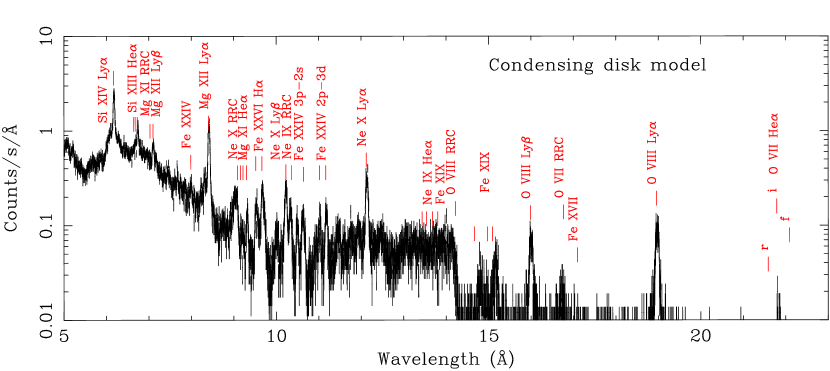
With a partially obscured central continuum, disk evaporation has an observable spectral signature. We simulate 50 ks XMM-Newton RGS 1 and Chandra MEG +1 observations (Fig. 2,3). Some bright lines are shown on Table 1. The evaporating and condensing disks have contrasting O VII/O VIII line ratios. The evaporating disk contains gas at - K, unlike the condensing disk. The H-like ion line intensities are higher for the condensing disk since it has more gas at K. The spectral differences stem from the distinct differential emission measure distributions and from the O VII recombination rate , where -, is the emission measure, and are the ion and electron densities.
The RRC and He-like line triplet can be used as temperature and density diagnostics, respectively. The RRC width (Liedahl & Paerels, 1996). The forbidden line of O VII at Å is absent due to collisional depopulation at high density, since cm-3. The O VII intercombination to resonance line ratio is , indicating a purely photoionized plasma (Porquet & Dubau, 2000). The O VII RRC broadening is Doppler-dominated, resembling the RR lines, while the O VIII RRC has a component with Å that is produced at K.
7 Conclusions
Using a model for a disk illuminated by a neutron star, we have produced a global spectrum of X-ray line emission from a self-consistent accretion disk atmosphere. The flaring of the atmosphere matches optical observations (de Jong, van Paradijs, & Augusteijn, 1996). For fiducial parameters of a LMXB with a partially obscured central source with Eddington luminosity, observable spectral signatures would identify an evaporating disk atmosphere.
The O VII/O VIII line ratios are a good tracer of evaporation from the disk. The line-rich spectrum has line profiles resolvable by the XMM and Chandra spectrometers. The lines have broad wings and a double-peaked core with a velocity from the outermost radius. Only a single line may be resolved since the emission is well distributed throughout cm cm. He-like triplet diagnostics show signatures of photoionization and high density ( cm-3), and H-like RRC are very broad, with a superposed narrow component in evaporating disks.
The distinct spectral signature of evaporation is due to the presence of a thermal instability in the photoionized gas of the disk. This instability cannot be quenched by spectral variations, abundance variations, or optical depth effects (Hess, Kahn, & Paerels, 1997). Conduction heating should not affect this result, though turbulent heat transfer or coronal heating might quench the instability if present. In the outer disk, the incident radiative power is times the viscous power, so coronal-like heating should be small.
The X-ray lines from the disk are weak and difficult to detect for a low-inclination LMXB. Only if the inclination is high and a cloudy environment exists do we expect them to be detectable. At press time, an XMM-Newton observation of LMXB dipper EXO 0748-67 has detected broad lines from photoionized gas with cm-3 (Cottam et al., 2001), which we interpret as the disk atmosphere emission, since it confirms the key predictions of our model.
References
- Allen (1973) Allen, C. W. 1973, Astrophysical Quantities (3rd ed.; London: Athlone Press)
- Balbus & Hawley (1998) Balbus, S. A., & Hawley, J. F. 1998, Rev. Mod. Phys., 70, 1
- Begelman & McKee (1990) Begelman, M. C., & McKee, C. 1990, ApJ, 358, 375
- Church (2000) Church, M. J. 2000, astro-ph/0012411
- Church et al. (1998) Church, M. J., Balucinska-Church, M., Dotani, T., & Asai, K. 1998, ApJ, 504, 516
- Cottam et al. (2001) Cottam, J., Kahn, S. M., Brinkman, A. C., den Herder, J. W., & Erd, C. 2001, A&A, 365, L277
- de Jong, van Paradijs, & Augusteijn (1996) de Jong, J. A., van Paradijs, J., & Augusteijn, T. 1996, A&A, 314, 484
- Dubus et al. (1999) Dubus, G., Lasota, J. P., Hameury, J. M., & Charles, P. 1999, MNRAS, 303, 139
- Field (1965) Field, G. B. 1965, ApJ, 142, 531
- Hess, Kahn, & Paerels (1997) Hess, C. J., Kahn, S. M., & Paerels, F. B. S. 1997, ApJ, 478, 94
- Klapisch et al. (1977) Klapisch, M., Schwab, J. L., Fraenkel, J. S., & Oreg, J. 1977, Opt. Soc. Am., 61, 148
- Ko & Kallman (1994) Ko, Y., & Kallman, T. R. 1994, ApJ, 431, 273
- Krolik, McKee & Tarter (1981) Krolik, J. H., McKee, C. F., & Tarter, C. B. 1981, ApJ, 249, 422
- Li et al. (2001) Li, Y., Gu, M. F., & Kahn, S. M., submitted to ApJ
- Morrison & McCammon (1983) Morrison, R., & McCammon, D. 1983, ApJ, 270, 119
- Liedahl & Paerels (1996) Liedahl D. A., & Paerels F. 1996, ApJ, 468, 33
- for a detailed discussion, see McKee & Begelman (1990) McKee, C. F. & Begelman, M. C. 1990, ApJ, 358, 392
- Nayakshin, Kazanas & Kallman (2000) Nayakshin, S., Kazanas, D., & Kallman, T. R. 2000, ApJ, 537, 833
- Porquet & Dubau (2000) Porquet, D., & Dubau, J. 2000, A&A, 143, 495
- Press (1994) Press, W. H. 1994, Numerical Recipes in FORTRAN : The Art of Scientific Computing (Cambridge: Cambridge University Press)
- Raymond (1993) Raymond, J. C. 1993, ApJ, 412, 267
- Sako et al. (1999) Sako M., Liedahl, D. A., Kahn, S. M., & Paerels, F. 1999, ApJ, 525, 921
- Shakura & Sunyaev (1973) Shakura, N. I., & Sunyaev, R. A. 1973, A&A, 24, 337
- Spitzer (1962) Spitzer, L. 1962, Physics of Fully Ionized Gases, (New York: Interscience)
- Vrtilek et al. (1990) Vrtilek, S. D., Raymond, J. C., Garcia, M. R., Verbunt, F., Hasinger, G., & Kurster, M. 1990, A&A, 235, 162
- Woods et al. (1996) Woods, D. T., Klein, R. I., Castor, J. I., McKee, C. F., & Bell, J. B. 1996, ApJ, 461, 767
- Zeldovich & Pikelner (1969) Zeldovich, Y. B., & Pikelner, S. B. 1969, Soviet Physics JETP, 29, 170
| Line(s) | EvaporatingaaLine fluxes in units of erg cm-2 s-1, typically over an interval . Estimated systematic normalization error limit of %, due to the 1-D calculation. | CondensingaaLine fluxes in units of erg cm-2 s-1, typically over an interval . Estimated systematic normalization error limit of %, due to the 1-D calculation. |
|---|---|---|
| O VII He triplet | 2.1 | 0.99 |
| O VIII Ly | 3.4 | 4.7 |
| O VII RRC | 1.3 | 0.61 |
| O VIII Ly | 0.94 | 1.5 |
| Fe XIX L (0.815 keV) | 0.45 | 0.91 |
| Ne X Ly | 1.4 | 2.2 |
| Fe XXVI H (1.28 keV) | 0.74 | 0.86 |
| Mg XII Ly | 1.2 | 2.0 |
| Si XIII He triplet | 1.2 | 2.4 |
| Si XIV Ly | 4.0 | 6.0 |
| Fe XXV Ly | 15 | 16 |
| Fe XXVI Ly | 12 | 12 |