LOW STATE OF THE X-RAY BURSTER SLX 1732-304
IN THE
GLOBULAR CLUSTER TERZAN 1
ACCORDING TO RXTE DATA
To be published in “Astronomy Letters”, 2001, v. 27, n. 6
Space Research Institute, Russian Academy of Sciences, Profsoyuznaya
str., 84/32, Moscow, 117810 Russia
Received on October 23, 2000
Observations of the X-ray burster SLX 1732-304 in the globular cluster Terzan 1 with the PCA/RXTE instrument in April 1997 are presented. The source was in a low state; its flux in the standard X-ray band was half the flux recorded by the ART-P/Granat telescope also during its low state. At the same time, its spectrum was softer than the ART-P spectrum; it was well described by a power law with a photon index of 2.3 without any evidence of a high-energy cutoff.
INTRODUCTION
Globular clusters stand out from the Galactic stellar population by a high abundance of low-mass binary systems, with one of their components being a relativistic, degenerate object — a neutron star or a white dwarf. X-ray sources were discovered in twelve globular clusters (Hut et al. 1992). Type I X-ray bursts were observed from most of them, which is indicative of the nature of their compact object — a neutron star with a weak magnetic field.
X-ray emission from the region of the globular cluster Terzan 1 was first detected by the HAKUCHO satellite precisely during bursts (Makishima et al. 1981; Inoue et al. 1981). The two detected bursts were identified with a persistent X-ray source later, in 1985, when first X-ray images of this region were obtained with the XRT telescope of the SPACELAB-2 laboratory (Skinner et al. 1987). The flux from the source, designated as SLX 1732-304, was erg cm-2 s-1 in the 3-30-keV energy band. Subsequent observations of several X-ray missions showed that the source’s emission was highly variable in intensity. The most catastrophic decline in flux was recorded in 1999 by the BeppoSAX observatory. The 2-10-keV flux fell to the level of erg cm-2 s-1 (Guainazzi et al. 1999). The data obtained with the ART-P X-ray telescope onboard the GRANAT observatory in the fall of 1990 (Pavlinsky et al. 1995, 2001) were of considerable importance in investigating the variability of SLX 1732-304. The source was detected in two different intensity states — a low state similar to that observed by the XRT telescope and a high state with 3-20-keV fluxes of and erg cm-2 s-1, respectively. Variations in intensity were apparently accompanied by hardness variations: whereas the source during its high state had the thermal spectrum with a distinct exponential cutoff at high energies typical of bright low-mass X-ray binaries, its low-state spectrum could be satisfactorily fitted by a power law with a photon index . Here, we continue to analyze the spectral states of SLX 1732-304 on the basis of its observations with RXTE.
OBSERVATIONS
The PCA instrument onboard the RXTE (Rossi X-ray Timing Explorer) orbiting X-ray observatory consists of five identical proportional counters with a total area of 6500 cm2, the operating energy range 2-60 keV, and an energy resolution % at 6 keV (Bradt et al. 1993). Because of its large area, the instrument is sensitive enough for a spectral analysis of emission even from weak X-ray sources to be performed. The PCA field of view is restricted by a collimator with a FWHM of 1∘. Depending on peculiarities of the suggested study, observational data during their initial onboard reduction can be written in various telemetric formats. In the observations discussed here, we use data in three formats with a time resolution of 0.125 s, 16 s, and 1 and an energy breakdown into 1, 129, and 256 channels, respectively. By the time the paper was written, SLX 1732-304 had been within the PCA field of view four times (table 1). The total exposure was eight hours.
Table 1. PCA/RXTE observations of SLX 1732-304 in 1997
| Observation | Date | Starting time | Exposure | Mean flux |
|---|---|---|---|---|
| (UT) | (s) | (mCrab)a | ||
| 20071-10-01-00 | 18.04 | |||
| 20071-10-01-01 | 18.04 | |||
| 20071-10-01-02 | 19.04 | |||
| 20071-10-01-03 | 20.04 |
aThe 3-20-keV flux
We see from the table that during two observations, the flux from the source was approximately the same with an insignificant (10%) trend toward its increase. The mean 3-20-keV flux was erg cm-2 s-1; i.e., it was almost half the flux recorded by ART-P in 1990 during the low state of SLX 1732-304. For this estimate, we subtracted the contribution of the 6.7-keV line of diffuse emission from hot gas in the Galactic bulge (see below). An analysis of the source’s light curve revealed no appreciable variability of its emission on time scales of tens and hundreds of seconds. An analysis of the power spectra obtained from data written with a high time resolution revealed no variability at frequencies 1-1000 Hz either (the limit on the total power in this frequency range was 15%).
EMISSION SPECTRUM
Since the spectra of SLX 1732-304 measured during different observing sessions were similar in shape, we performed a detailed analysis for the mean spectrum. Data written with a 16-s time resolution in the 3-20-keV energy band were used. The PCA response matrix at lower and higher energies is known with a large uncertainty. The pulse-height spectrum of the source is shown in Fig. 1 together with its power-law fit (histogram). The best-fit parameters are: photon index and intensity at 10 keV phot. cm-2 s-1 keV-1. The interstellar absorption (atomic hydrogen column density) was fixed at cm-2, which was measured by the ROSAT observatory under the assumption of solar elemental abundances (Johnston et al. 1995). In the PCA operating range, the effect of such absorption is essentially weak. As can be seen from the figure, the measured spectrum exhibits an intense emission line at energy keV. This line is most likely unrelated to the source SLX 1732-304 itself, but is a superposition of the diffuse 6.64-, 6.67-, 6.68-, and 6.7-keV lines of Fe XXV, whose ions recombine in clouds of hot plasma near the Galactic center. Using LAC/GINGA observations (Yamauchi et al. 1993), we estimated the expected intensity of the iron-line emission to be phot. cm-2 s-1 toward the globular cluster Terzan 1. Direct measurements of the line intensity in the measured spectrum yielded phot. cm-2 s-1. The line has the centroid at energy keV and a width of eV ( in a Gaussian profile). Thus, the observed line can be entirely attributed to the diffuse emission of ionized iron.
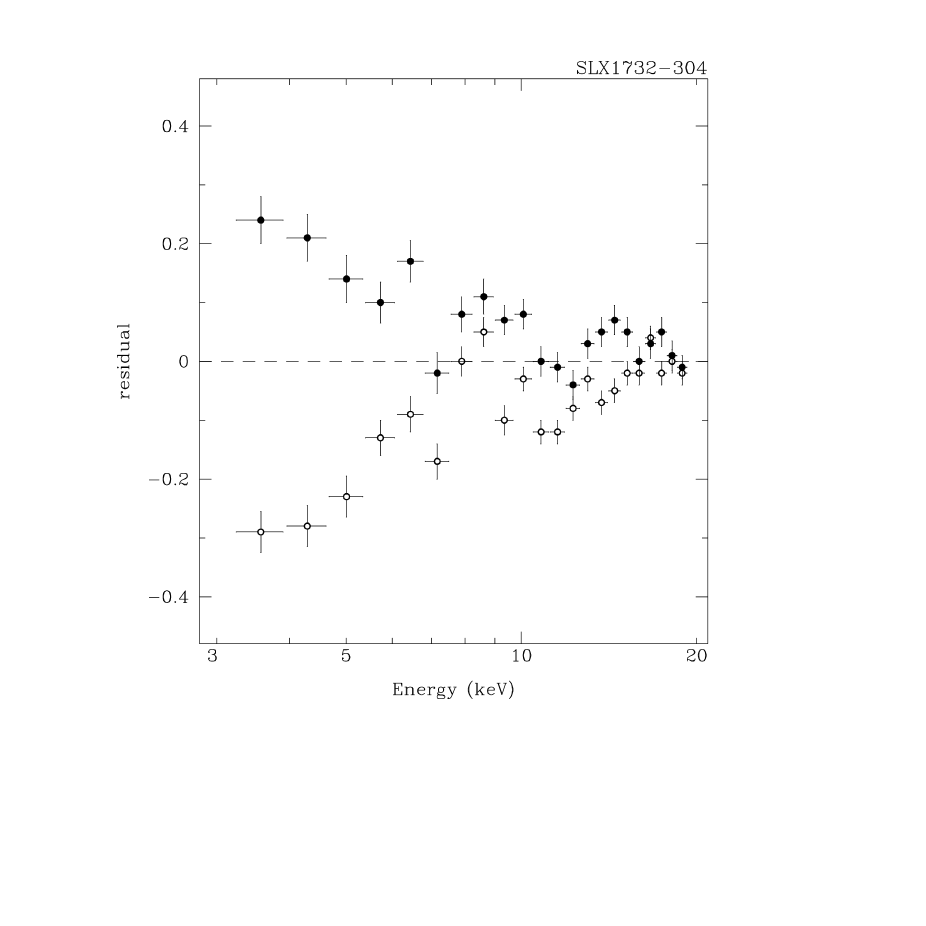
Figure 2 shows that the above slight trend in the source’s flux during the PCA observations was accompanied by changes in its spectrum. The figure presents the ratio of the April 18 (open circles) and 20 (filled circles) spectra to the best fit to the mean spectrum. We see that maximum changes (up to 40%) took place at soft energies below 7 keV. We also see that there is a small excess of photons at energies keV in both spectra (or a deficit at energies keV) compared to the power-law fit to the mean spectrum.
DISCUSSION
Figure 3 shows the X-ray photon spectrum of SLX 1732-304 reconstructed from the PCA data. The component attributable to the background diffuse 6.7-keV emission was removed. We neglected by possible contribution of the diffuse continuum emission. This spectrum was taken during the source’s low state, in which it spends most of its time. Significantly, the observed spectrum is not just very hard, but it is well described by a power law over the entire PCA operating range without any evidence of a high-energy cutoff. The X-ray flux was a factor of lower than that recorded by ART-P in 1990, also during the source’s low state. At the same time, the spectrum was steeper: the spectral slope had a photon index , whereas the ART-P spectrum had a slope . Discrepancies in the spectra are clearly seen in Fig. 3, in which the ART-P spectra of SLX 1732-304 observed in 1990 during its low and high states are indicated by open and filled circles, respectively. In particular, we see that the ART-P low-state spectrum is in better agreement with a hard Comptonized spectrum than with just a power law. This can serve as evidence that this spectrum originated in an optically thicker and more opaque plasma than did the PCA spectrum. It is much more similar to the source’s high-state spectrum. In general, it should be said that the PCA data contribute appreciably to the study of various spectral states of SLX 1732-304.
ACKNOWLEDGMENTS
This study was supported by the Russian Foundation for Basic Research (project nos. 99-02-18178 and 00-15-99297).
REFERENCES
H. V. Bradt, R. E. Rothschild, and J. H. Swank, Astron. Astrophys., Suppl. Ser. 97, 355 (1993)
M. Guainazzi, A. Parmar, and T. Oosterbroek, Astron. Astrophys. 349, 819 (1999)
P. Hut, S. McMillan, J. Goodman, et al., Publ. Astron. Soc. Pac. 104, 681 (1992)
H. Inoue, K. Koyama, K. Makishima, et al., Astrophys. J. 250, L7 (1981)
H. M. Johnston, F. Verbunt, and G. Hasinger, Astron. Astrophys. 298, L21 (1995)
K. Makishima, T. Ohashi, H. Inoue, et al., Astrophys. J. 247, L23 (1981)
M. N. Pavlinsky, S. A. Grebenev, A. A. Lutovinov, et al., Astron. Lett. 27, 297 (2001)
M. Pavlinsky, S. Grebenev, A. Finogenov, and R. Sunyaev, Adv. Space Res. 16, (3)95 (1995)
G. Skinner, A. Willmore, C. Eyles, et al., Nature 330, 540 (1987)
S. Yamauchi and K. Koyama, Astrophys. J. 404, 620 (1993)