The X-ray Source SLX 1732-304 in the Globular Cluster Terzan 1: The Spectral States and an X-ray Burst
To be published in “Astronomy Letters”, 2001, v.27, p.297
Space Research Institute, Russian Academy of Sciences, Profsoyuznaya
str., 84/32, Moscow, 117810 Russia1
Max-Planck Institut für Astrophysik, Garching, Germany2
Received on 29 June 2000
The results of ART-P/Granat observations of the X-ray burster SLX1732-304 in
the globular cluster Terzan 1 are presented. The X-ray (3-20 keV) fluxes
from the source differed by more than a factor of 4 during the observing
sessions on September 8 ( erg cm-2
s-1) and October 6, 1990 ( erg
cm-2 s-1). The intensity variations of SLX1732-304 were
apparently accompanied by variations in its hardness: whereas the
source in its high state had the spectrum with a distinct exponential
cutoff typical of bright low-mass X-ray binaries, its low-state
spectrum could be satisfactorily described by a simple power law with
a photon index . During the ART-P observation on
September 8, a type I X-ray burst was detected from SLX1732-304.
INTRODUCTION
Persistent X-ray emission from the globular cluster Terzan 1 was first discovered in 1985 with the XRT telescope onboard the SPACELAB-2 space laboratory (Skinner et al., 1987). A flux of erg cm-2 s-1 was detected in the 3-30 keV energy band. The XRT telescope was one of the first coded-aperture X-ray instruments that allowed the sky images within the field of view to be reconstructed with an angular resolution of several arcminutes. The localization with XRT showed that the new X-ray source, designated as SLX1732-304, closely coincided in position with the cluster center. Since two X-ray bursts had been previously detected from this region with the HAKUCHO instruments (Makishima et al., 1981), Skinner et al. (1987) concluded that the discovered source was an X-ray burster, i.e., a neutron star with a weak magnetic field in a low-mass binary system. Weak X-ray emission was detected from the source with approximately the same flux during its subsequent EXOSAT (Parmar et al., 1989), Granat (Pavlinsky et al., 1995; Borrel et al., 1996), ROSAT (Johnston et al., 1995), and RXTE (Guainazzi et al., 1999; Molkov et al., 2001) observations. Only the recent BeppoSAX observations (Guainazzi et al., 1999), when the 2-10 keV flux from the source was a factor of lower than its normal value, constitute an exception. Of particular interest are also the ART-P/Granat observations (Pavlinsky et al., 1995), when the source was observed in states with different intensities and when an X-ray burst was detected from it.
Note that the distance to the globular cluster Terzan 1 has been known poorly until recently. In several studies (Skinner et al., 1987; Pavlinsky et al., 1995; Borrel et al., 1996), it was assumed to be kpc. Optical observations suggested a more modest value, kpc (see Johnston et al., 1995 and references therein). In general, this estimate is confirmed by recent observations of the cluster with the ESO telescopes, kpc (Ortolani et al., 1993), and with the Hubble Space Telescope, kpc (Ortolani et al., 1999). In our subsequent analysis, we use kpc.
In this paper, we present the results of our detailed timing and spectral
analyses of the ART-P/Granat observations for the X-ray source in Terzan 1
obtained in 1990-1992.
OBSERVATIONS
The ART-P telescope onboard the Granat orbiting astrophysical observatory consists of four independent modules; each module is a position-sensitive detector with a geometric area of 625 cm2, equipped with a collimator and a coded mask whose opaque elements always cover half of the detector. The instrument has a 3436 field of view (FWHM) and an angular resolution of 5 arcmin (the element size of the coded mask). Because of the detector’s higher spatial resolution ( arcmin), the localization accuracy for discrete sources is several-fold higher. The telescope is sensitive to photons in the energy range keV (the photon arrival time is accurate to within ms, and the ART-P dead time is 580 s) and has an energy resolution of % in the 5.9-keV iron line. See Sunyaev et al. (1990) for a more detailed description of the telescope.
Table 1. ART-P observations of SLX1732-304 in 1990-1992.
| Date(UT) | Exposure, s | Efficiency,% | Flux, mCrab | |
|---|---|---|---|---|
| 8.09.90 | 26680 | 42.0 | 1 | |
| 9.09.90 | 7370 | 2.5 | 107 | 0 |
| 6.10.90 | 40460 | 29.1 | 0 | |
| 9.10.90 | 6590 | 4.0 | 72.4 | 0 |
| 23.02.91 | 3040 | 2.8 | 460 | 1 |
| 30.08.91 | 4995 | 3.2 | 300 | 0 |
| 19.09.91 | 16950 | 20.9 | 25.8 | 0 |
| 2.10.91 | 13970 | 13.3 | 39.6 | 0 |
| 15.10.91 | 7400 | 1.8 | 239 | 1 |
| 17.10.91 | 6040 | 4.5 | 219 | 0 |
| 18.10.91 | 3960 | 3.3 | 325 | 0 |
| 19.10.91 | 7920 | 4.1 | 188 | 3 |
| 19.02.92 | 24530 | 14.4 | 14.3 | 0 |
| 29.02.92 | 5360 | 3.0 | 439 | 1 |
| 1.03.92 | 4590 | 2.9 | 489 | 0 |
| 2.04.92 | 7460 | 2.9 | 392 | 0 |
| 3.04.92 | 5350 | 3.7 | 343 | 0 |
| 4.04.92 | 6700 | 4.0 | 281 | 0 |
| 6.04.92 | 6550 | 4.2 | 270 | 0 |
| 7.04.92 | 3890 | 4.7 | 316 | 1 |
| 8.04.92 | 1790 | 5.7 | 381 | 0 |
| Collimator transmission efficiency. | |
| Mean 6-20 keV flux. | |
| upper limits. | |
| Number of bursts detected from sources within the field of view. |
During regular observations of the Galactic-center region, SLX1732-304 was within the ART-P field of view many times. The total exposure was s. In most cases, however, the source was at the very edge of the field of view, in the region where the efficiency of observations was low due to the drop in collimator transmission. Table 1 gives data only for those sessions during which the mean efficiency exceeded 1%. During a session, the telescope axis could deviate from the pointing direction within 30 arcmin because of the spacecraft wobbling, and, accordingly, the efficiency of observations could exceed its mean value during some periods. We therefore selected time intervals for the sessions listed in the table during which the instantaneous efficiency exceeded 1% and used them to determine the photon flux from the source and the actual exposure. Note that the efficiencies given in the table also refer only to the selected ”good” parts of the sessions. The total exposure for these parts is s.
We see from Table 1 that in most sessions, no flux was detected from the source, and only the corresponding upper limit was obtained. Nevertheless, these sessions provide important information for the search for X-ray bursts from the source and for estimating their recurrence time. Over the entire period of observations, we detected only one burst that was unambiguously identified with SLX1732-304. In addition, we detected nine more bursts that we failed to localize and to identify with any source of persistent emission in the Galactic-center region (Grebenev et al., 2001). Based on our data, we can estimate the burst recurrence time, (the lower limit follows from the session duration on October 6, 1990, while the upper limit follows from the total duration of observations, s). Since only three X-ray bursts were detected from this source over more than twenty years of its observations, is most likely closer to the upper limit.
A statistically significant persistent X-ray flux from the source was
detected by ART-P only during two sessions: September 8 and October 6, 1990
(see Table 1). During the former observation, the flux was a factor of higher than that during the latter observation. An X-ray burst was
detected from the source on September 8, 1990.
PERSISTENT SPECTRUM
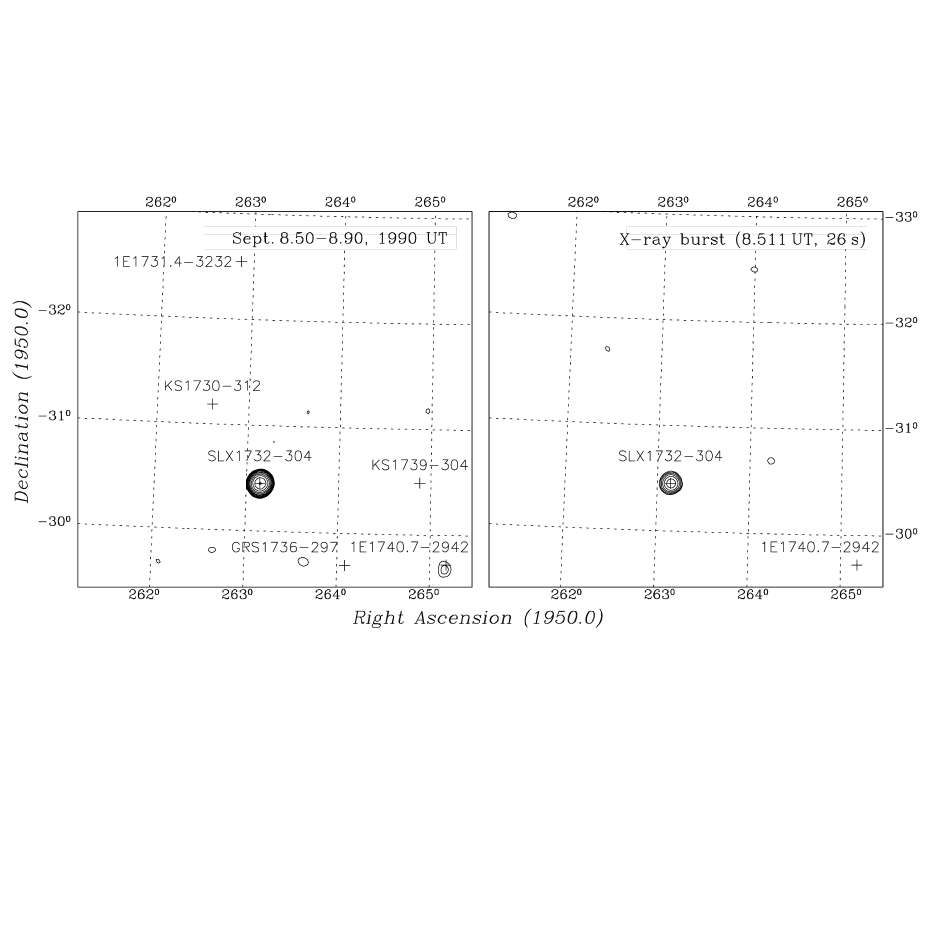
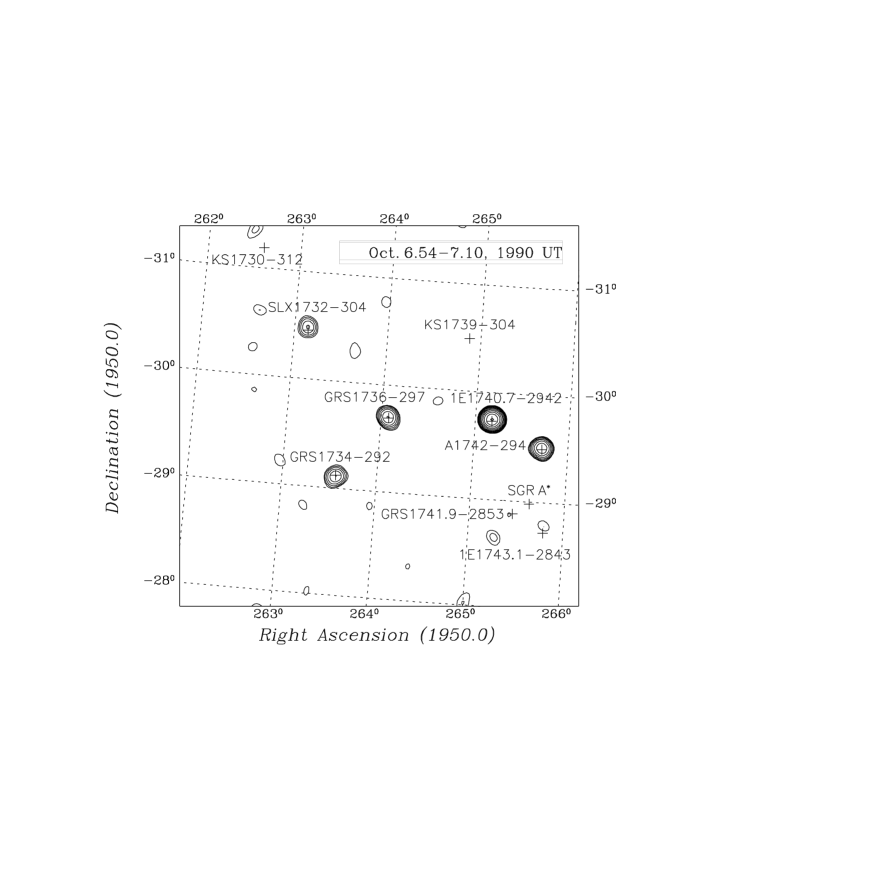
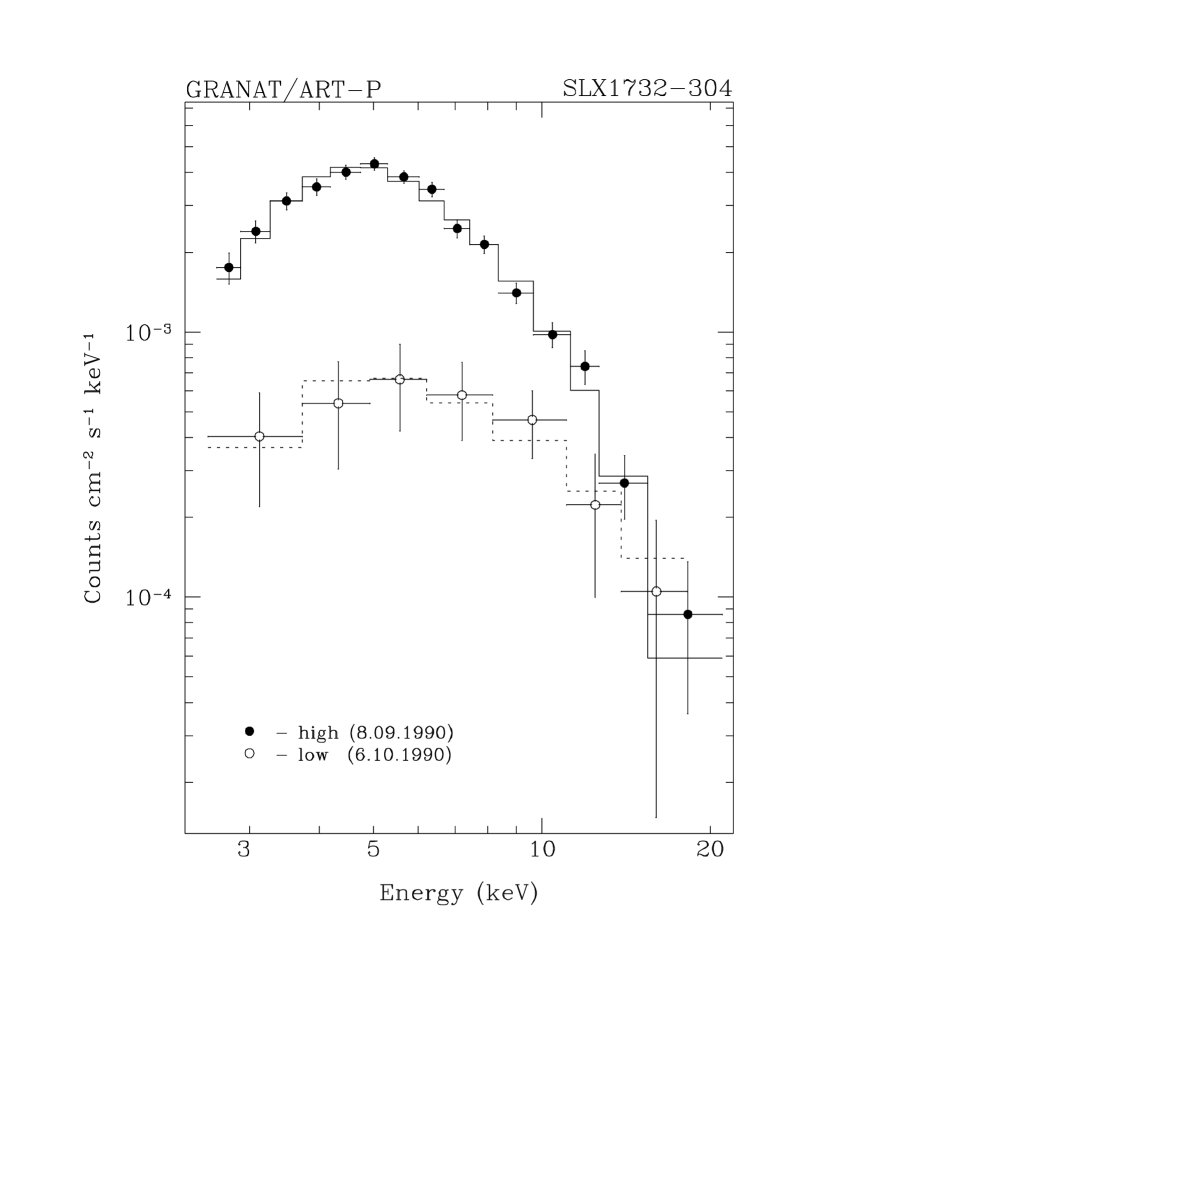
The X-ray spectrum of SLX1732-304 in quiescence can generally be described by a power law with a photon index modified at low energies by interstellar absorption, which corresponds to a hydrogen column density cm-2 (Parmar et al., 1989; Johnston et al., 1995; Guainazzi et al., 1999; Molkov et al., 2001). During the ART-P observation on September 8, SLX1732-304 was virtually the only bright source within the field of view (Fig. 1a), while the main target for the October 6 observation was the Galactic-center region (Fig. 2); apart from SLX1732-304, there were such bright sources as A1742-294 and 1E1740.7-2942, as well as the new sources GRS1734-292 and GRS1736-297 within the field of view (Pavlinsky et al., 1992, 1994). The ART-P design allows the spectra of each object within the field of view to be measured irrespective of their number. The 3-20 keV fluxes measured on September 8 and October 6 were erg cm-2 s-1 ( mCrab) and erg cm-2 s-1 ( mCrab), respectively. Below, we therefore arbitrary call the source’s states during the September 8 and October 6 observations ”high” and ”low”, respectively. The changes in the spectrum occurred between these observations are clearly seen in Fig. 3, which shows pulse-height spectra of the source, and in Fig. 4, which shows the restored photon spectra. Best-fit parameters for the high- and low-state spectra are listed in Table 2. The interstellar absorption toward SLX1732-304 was fixed at cm-2 (Johnston et al., 1995). This value is in satisfactory agreement with cm-2 that was directly determined from ART-P data (Pavlinsky et al., 1995). The spectra were fitted by three models: a power law (PL), bremsstrahlung of an optically thin plasma (BR), and Comptonization of low-frequency photons in a cloud of high-temperature plasma (ST) suggested by Sunyaev and Titarchuk (1980).
Table 2. Best-fit parameters for the spectrum of SLX1732-304
| Date | Model | Parameters | |
| 8.09.90 | ST | 0.78 (14) | |
| keV | |||
| BR | 0.85 (15) | ||
| keV | |||
| PL | 2.52 (15) | ||
| 6.10.90 | ST | 0.08 (6) | |
| keV | |||
| BR | 0.09 (7) | ||
| keV | |||
| PL | 0.13 (7) | ||
| ST | 0.37 (7) | ||
| keV | |||
| ST – | for the spectrum Comptonized in a disk with electron | |
| temperature and optical depth , | ||
| BR – | for bremsstrahlung with temperature , | |
| PL – | for a power-law spectrum with photon index . | |
| is the flux at 1 keV (phot cm-2 s-1 keV-1). | ||
| is the hydrogen column density ( cm-2). | ||
| The value normalized to the number of degrees of freedom . | ||
As we see from Figs. 3 and 4 and from Table 2, the source’s high-state spectrum exhibits a cutoff at high energies, resulting in a poor description of the spectrum by a pure power law. The ST and BR models describe the spectrum equally well; the bremsstrahlung fit yields the temperatures typical of many bright low-mass X-ray binaries, objects of the same type as that of SLX1732-304.
Since the source’s low-state spectrum was measured with large statistical errors, we cannot prefer one model to another. When this spectrum is fitted by the ST and BR models, the temperatures that characterize the steepness of the high-energy exponential cutoff are generally larger than those obtained for the high-state spectrum. This is evidence that the source’s hardness increases with a transition to its low state. The best-fit parameters of the low-state spectrum (see the low part of Table 2) for the Comptonization model with fixed and (the same as those obtained for the high state) confirm this conclusion. The spectrum normalization and the hydrogen column density , which characterizes the interstellar absorption, were taken as the free parameters. This model simulates a situation in which the transition between the states was associated with a change in intrinsic intensity of the source’s radiation (without any change in spectral shape) or with the emergence of a scattering and absorbing cloud of cold plasma on the line of sight. Although both these possibilities cannot be completely rejected, we see that this model describes the pulse-height spectrum worst. The long-term SIGMA/Granat observations of SLX1732-304 (Pavlinsky et al., 1995; Borrel et al., 1996) also indicate that the source has a hard Comptonized spectrum in its low state.
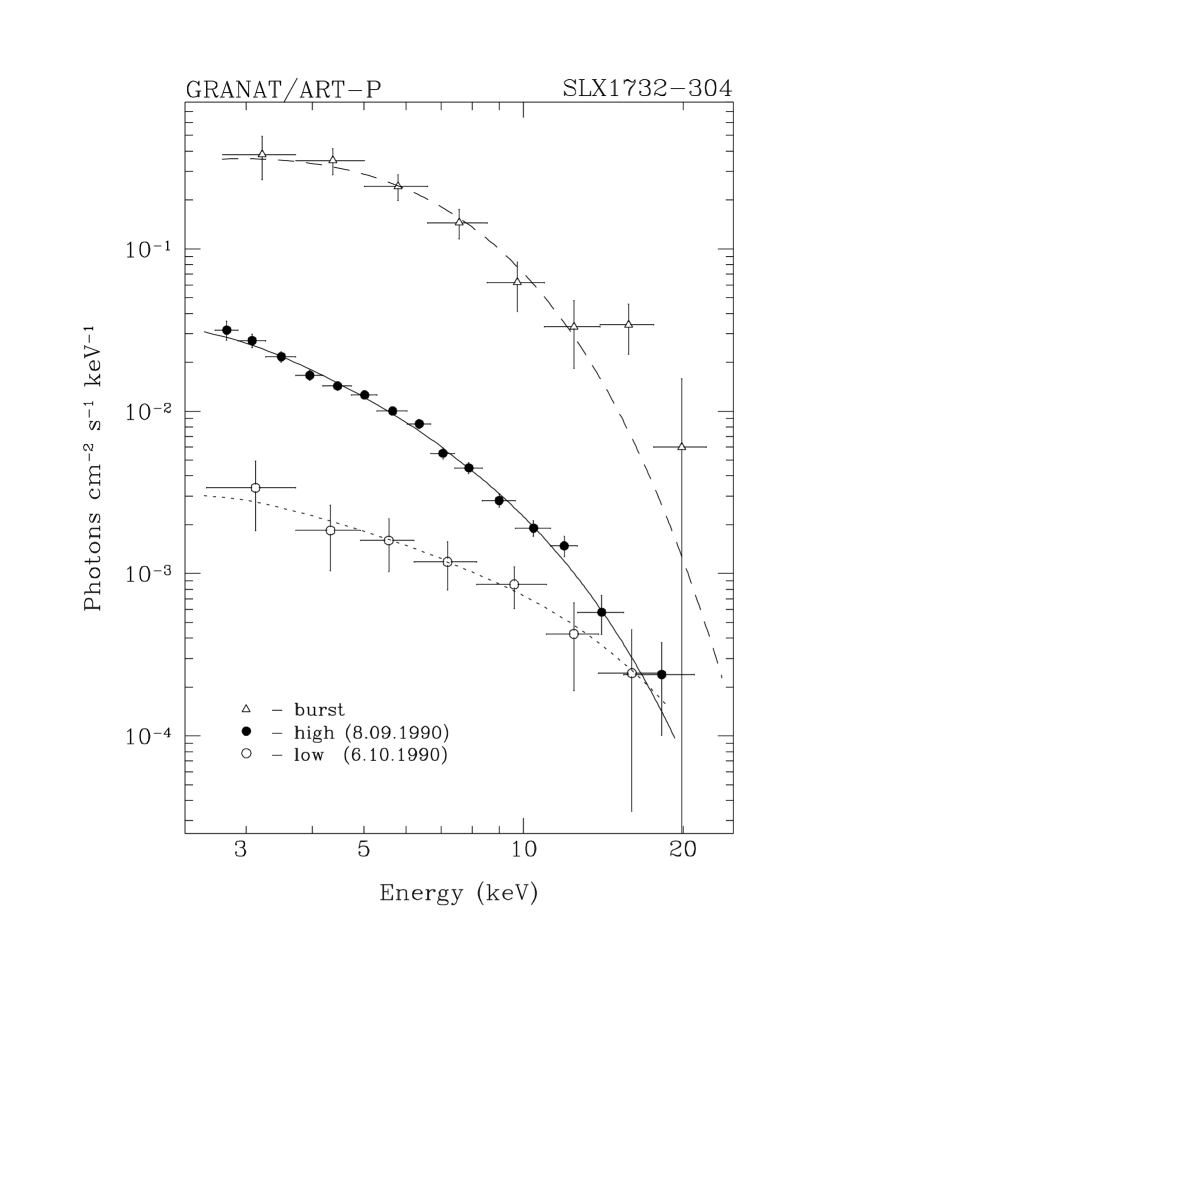
In Figs. 3 and 4, the solid and dashed lines represent the best fits to the
source’s high- and low-state spectra with the Comptonization model.
According to the ART-P data, the source’s mean 3-20 keV luminosity during
these states was and erg s-1,
respectively.
X-RAY BURST
During the September 8, 1990 observation at (UT) ART-P detected an intense X-ray burst (Fig. 5). Its localization showed that the position of the burst source, R.A. =, Decl. =-30∘29′26′′(Pavlinsky et al., 1994), coincides, within the error limits (120′′at 90% confidence), with the position of SLX1732-304. Our result is illustrated by Fig. 1b, which shows an X-ray (3-20 keV) map of the sky within the ART-P field of view during the first 26 s of the burst. It is of interest to compare it with a similar map obtained during the entire observing session on September 8 (see Fig. 1a).
The time profile of the burst (an insert in Fig. 5) indicates that it belongs to type I bursts, which are produced by a thermonuclear explosion on the neutron-star surface and which are characterized by an abrupt rise followed by a slow exponential decline in X-ray flux. A distinctive feature of type I bursts is the so-called ”cooling” of the radiation at the burst exponential stage, i.e., a gradual softening of the spectrum and a decrease in -folding decline time with increasing energy. The burst time profiles in Fig. 6 and the corresponding -folding times of exponential decline show that the cooling state is well defined in this case.
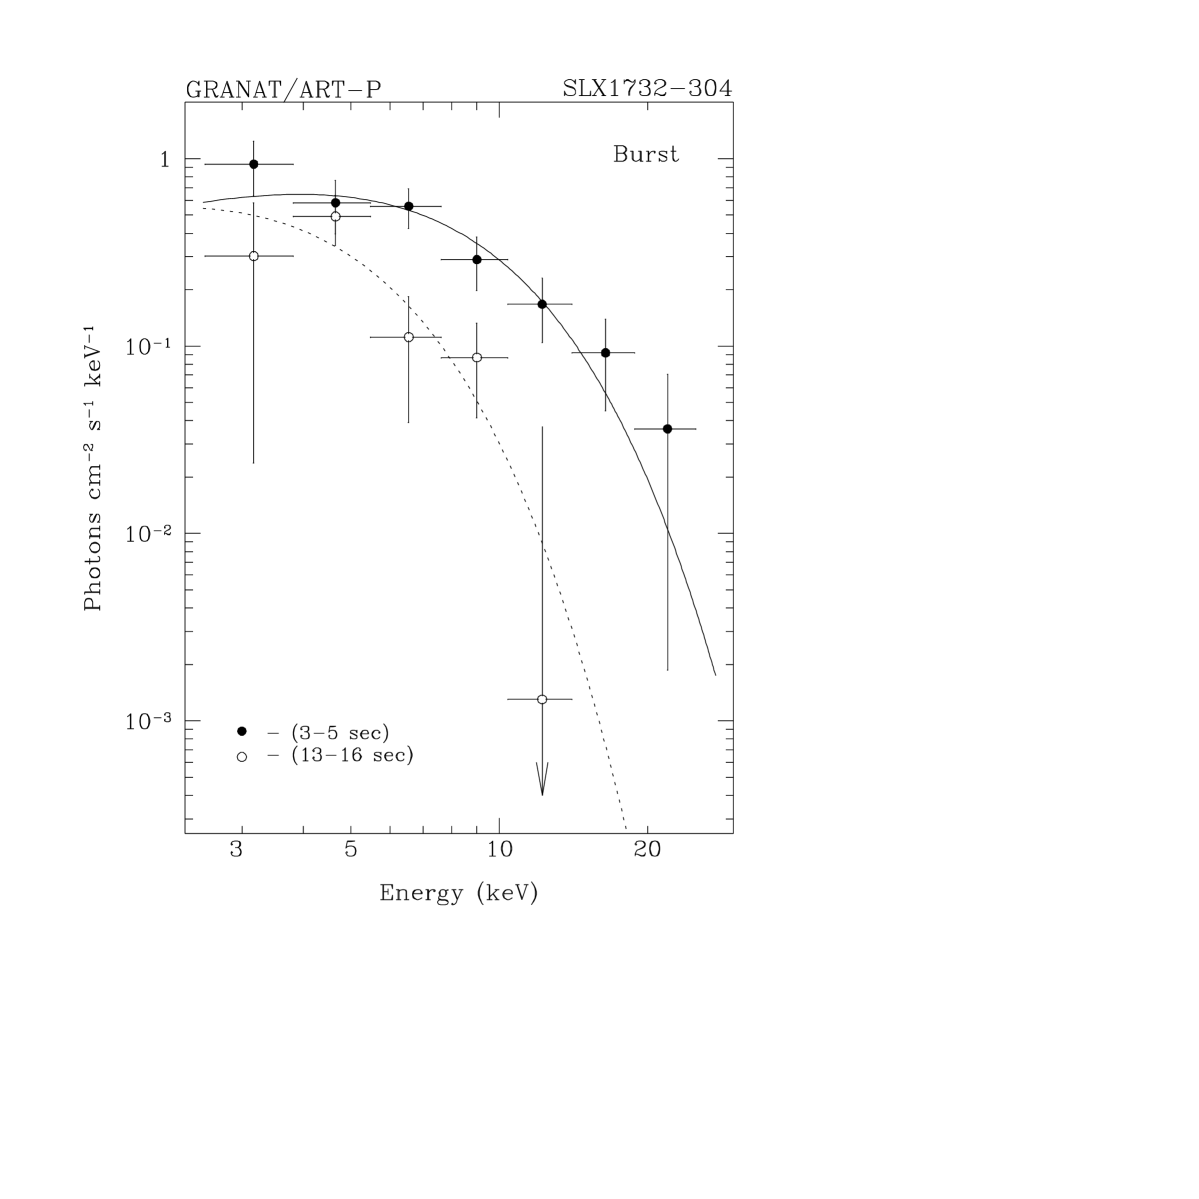
Figures 4 (triangles) and 7 (filled and open circles) show three photon spectra measured during the burst: the spectrum averaged over the entire burst time ( s), the spectrum near peak flux (3-5 s after the burst onset), and the spectrum at the end of the cooling stage (13-16 s). The dashed, solid, and dotted lines represent the best fits to these spectra with the blackbody model. Figure 7 clearly shows that the spectrum appreciably softens by the end of the burst. To better trace the spectral evolution, we singled out seven intervals in the burst profile and performed a spectral analysis for each of them. The best-fit parameters for each spectrum with the model of a blackbody sphere and the corresponding X-ray (3-20 keV) flux are given in Table 3. The spectrum averaged over the entire burst time can be described by the model of a blackbody sphere with temperature keV, radius km, and the 3-20 keV flux erg cm-2 s-1, which corresponds to a luminosity . Note that the blackbody model does not satisfactorily describe the measured burst spectrum at hard ( keV) energies (see Fig. 4).
Table 3. Spectral evolution of SLX 1732-304 during the X-ray burst
| Interval, s | Flux, | , | , | |
|---|---|---|---|---|
| mCrab | keV | km | ||
| 0-2 | 904272 | 3.841.17 | 1.881.02 | 0.43 (8) |
| 3-5 | 2470340 | 2.490.33 | 6.431.59 | 1.43 (8) |
| 6-8 | 1549281 | 1.980.33 | 7.802.63 | 0.66 (8) |
| 9-12 | 535236 | 1.770.55 | 6.384.21 | 0.10 (5) |
| 13-16 | 578163 | 1.380.40 | 9.763.53 | 0.84 (5) |
| 17-24 | 17886 | 1.000.39 | 13.7414.74 | 1.45 (8) |
| From the burst onset at (UT). | |
| The value normalized to the number of degrees of freedom . |
Figure 8 shows the evolution of the source’s bolometric luminosity, radius
, and temperature during the burst in the blackbody
model. The radius is almost always smaller than the typical
neutron-star radius, km, suggesting that the thermonuclear
explosion responsible for the burst took place not instantaneously over the
entire neutron-star surface, but only in its part. However, a much more
probable reason is the oversimplified description of the measured
spectra. As was first shown by Sunyaev and Titarchuk (1986) and Ebisuzaki
and Nomoto (1986), the Comptonized spectra of the radiation emerging from
the photospheres of X-ray bursters during bursts can differ markedly from
Planck spectra. In particular, the Wien radiation component with a
temperature corresponding to the electron temperature of the outer
photosphere, which can be higher than the effective (blackbody) temperature,
dominates in the X-ray band.
CONCLUSIONS
The ART-P observations of the X-ray burster SLX1732-304 in the globular cluster Terzan 1 are unique not only because the source was detected during them in states with different intensities, but also because, for the first time, it has become possible to carry out a detailed spectral study of the evolution of its radiation during an X-ray burst.
Our analysis shows that the transition between the high and low states was apparently accompanied by a change in the source’s hardness. In its high state, the spectrum of the source was typical of bright low-mass X-ray binaries whose compact object is a neutron star with a weak magnetic field. It could be satisfactorily described by bremsstrahlung of an optically thin thermal plasma with keV or, equally well, by Comptonization of low-frequency photons in a cloud of hot ( keV) electron plasma. In its low state, the source in the ART-P energy band most likely had a power-law spectrum with no evidence of an obvious high-energy cutoff. This means that the emission from the source in this state originates in much hotter and more tenuous plasma.
The X-ray burst observed with ART-P on September 8 became the third burst detected from this source over the entire period of its observations. Our analysis shows that it is a classical type I burst; i.e., it is characterized by an abrupt rise in flux followed by a slow exponential decline, with the decline at hard energies ( s) being faster than that at soft energies ( s). Our study of the source’s spectrum during the burst indicates that it can be satisfactorily described by the model of a blackbody with a temperature smoothly falling during the burst from 3.8 to 1.0 keV. The total energy release during the burst is erg, which is equivalent to an explosion of g of matter, where is the helium burning efficiency. If we use an estimate for the rate of accretion onto the neutron star in quiescence (, where , and km are the luminosity, mass, and radius of the neutron star, respectively), then we can estimate the time it takes for this amount of matter to be accreted onto the stellar surface, i.e., the characteristic burst recurrence time: during the high state and during the low state. When comparing these estimates with the duration of the source’s ART-P observations in its high and low states (see Table 1), the burst detection in the former case and its absence in the latter case seems natural. However, one should not attach too great a significance to these estimates. Many bright X-ray sources are known to show up as bursters only in a state with a certain (usually moderately high) luminosity (Lewin et al., 1993; Molkov et al., 1999). In this sense, the observation of the burst from SLX1732-304 in its high state provides further evidence that this source is exceptional and unique among X-ray bursters.
ACKNOWLEDGMENTS
This study was supported by the Russian Foundation for Basic Research (project nos. 98-02-17056, 99-02-18178, and 00-15-99297). We wish to thank K.G. Sukhanov, flight director, the staffs of the Lavochkin Research and Production Center, RNIIKP, and the Deep Space Communications Center in Evpatoria, the Evpatoria team of the Space Research Institute (Russian Academy of Sciences), the team of I.D. Tserenin, and B.S. Novikov, S.V. Blagii, A.N. Bogomolov, V.I. Evgenov, N.G. Khavenson, and A.V. D’yachkov from the Space Research Institute who operated the Granat Observatory, provided the scientific planning of the mission, and performed a preliminary processing of telemetry data. We also wish to thank the team of M.N. Pavlinsky and the staff of the former Research and Development Center of the Space Research Institute in Bishkek who designed and manufactured the ART-P telescope. We wish to thank V.Astakhov for the help in translating this paper in English.
REFERENCES
Borrel V., Bouchet L., Jourdan E. et al. //Astrophys. J., 1996, v. 462, p. 754
Ebisuzaki T., Nomoto K. //Astrophys. J., 1986, v. 305, p. L67
Grebenev S., Lutovinov A., Pavlinsky M. et al. //Astron. Lett., 2001, v. 27, (in press)
Guainazzi M., Parmar A., Oosterbroek T. //Astron. Astrophys., 1999, v. 349, p. 819
Johnston H., Verbunt F., Hasinger G. //Astron. Astrophys., 1995, v. 298, p. L21
Lewin W., van Paradijs J. and Taam R. //Space Sci. Rev., 1993, v. 62, p. 223
Makishima K., Ohashi T., Inoue H., et al. //Astrophys. J., 1981, v. 247, p. L23
Molkov S., Grebenev S., Pavlinsky M,, and Sunyaev R. //Astrophys. Lett. Commun., 1999, v. 38, p. 141; astro-ph/9903089
Molkov S., Grebenev S. and Lutovinov A. //Pis’ma Astron. Zhurn, 2001, v. 27, p. 423 (Astron. Lett., 2001, v. 27, N 6, in press)
Ortolani S., Bica E., Barbuy B. //Astron. Astrophys., 1993, v. 267, p. 66
Ortolani S., Barbuy B., Bica E., et al. //Astron. Astrophys., 1999, v. 350, p. 840
Parmar A., Stella L., Giommi P. //Astron. Astrophys., 1989, v. 222, p. 96
Pavlinsky M., Grebenev S., Sunyaev R. //Sov. Astron. Lett., 1992, v. 18, p. 88
Pavlinsky M., Grebenev S., Sunyaev R. //Astrophys. J., 1994, v. 425, p. 110
Pavlinsky M., Grebenev S., Finogenov A., Sunyaev R. //Adv. Space Res., 1995, v. 16, p. (3)95
Skinner G., Willmore A., Eyles C. et al. //Nature, 1987, v. 330, p. 544
Sunyaev R.A., Titarchuk L. //Astron. Astrophys., 1980, v. 86, p. 121
Sunyaev R., Titarchuk L. //Sov. Astron. Lett., 1986, v. 12, p. 359
Sunyaev, R.A., Babichenko, S.I., Goganov, D.A., et al. //Adv. Space Res., 1990, v. 10, p.(2)233.