Photometric Variability in the Ultracool Dwarf BRI 00210214:
Possible Evidence for Dust Clouds
Abstract
We report CCD photometric monitoring of the nonemission ultracool dwarf BRI 00210214 (M9.5) obtained during 10 nights in 1995 November and 4 nights in 1996 August, with CCD cameras at 1 m class telescopes on the observatories of the Canary Islands. We present differential photometry of BRI 00210214, and we report significant variability in the -band light curve obtained in 1995. A periodogram analysis finds a strong peak at a period of 0.84 day. This modulation appears to be transient because it is present in the 1995 data but not in the 1996 data. We also find a possible period of 0.20 day, which appears to be present in both the 1995 and 1996 datasets. However, we do not find any periodicity close to the rotation period expected from the spectroscopic rotational broadening (0.14 day). BRI 00210214 is a very inactive object, with extremely low levels of Hα and X-ray emission. Thus, it is unlikely that magnetically induced cool spots can account for the photometric variability. The photometric variability of BRI 00210214 could be explained by the presence of an active meteorology that leads to inhomogeneous clouds on the surface. The lack of photometric modulation at the expected rotational period suggests that the pattern of surface features may be more complicated than previously anticipated.
1 Introduction
During the last five years, we have witnessed the discovery of hundreds of ultracool dwarfs,111We define ultracool dwarfs as those with spectral type M7 or later. located in the solar neighborhood and in young open clusters and associations, e.g., Jones & Steele (2001). Detailed study of their properties is still in its infancy, but some general facts seem to be already well established.
Non-gray model atmospheres have shown that dust forms under the low-temperature and high-density conditions prevalent in M dwarfs with K, e.g., Tsuji, Ohnaka, & Aoki (1996a) and Allard et al. (1997). Dust grains such as calcium titanate (CaTiO3) and corundum (Al2O3) have been held responsible for the observed depletion of gaseous TiO from the atmospheres of the coolest M dwarfs. A new spectral class, designated as L, has been defined to classify dwarfs cooler than M (Kirkpatrick et al., 1999; Martín et al., 1999). The optical spectra of late L dwarfs do not show any TiO features, and they are dominated by broad resonance lines of alkali elements (Cs, K, Na, Rb). The colors of late M and L dwarfs are extremely red due to their cool temperatures and the greenhouse effect caused by dust opacity, which dissociates the main molecular absorbers in the -band (CO and H2O). Dusty atmospheric models are more successful than dust-free models in reproducing the observed colors of late M and L dwarfs in the field (Leggett, Allard, & Hauschildt, 1998), in the Pleiades cluster (Martín et al., 2000), and in very low-mass multiple systems (White et al., 1999; Leinert et al., 2000). On the other hand, the same models cannot explain the blue colors of even cooler dwarfs ( K), such as Gl 229 B, without gravitational settling of dust grains (Tsuji et al., 1996b). The real atmospheres of ultracool dwarfs are likely to be very dynamical, due to turbulent motions related to convection and rotation (Allard et al., 2001; Marley, 2001).
Ultracool dwarfs are generally fast rotators. Rotational broadening ( sin ) for about 40 late-M and L dwarfs has been measured using high-resolution spectra (Basri & Marcy, 1995; Martín et al., 1997; Tinney & Reid, 1998; Basri et al., 2000; Basri, 2001). The majority of the ultracool dwarfs have km s-1, with a trend for faster rotation toward cooler temperatures. The late L dwarfs also tend to be very inactive as judged from the flux of Hα emission (Gizis et al., 2000). Chandra observations of the M9 dwarf LP944-20 have set an upper limit to the quiescent X-ray emission that is two orders of magnitude lower than typical X-ray emission levels in M0–M6 dwarfs (Rutledge et al., 2000).
BRI 00210214 is an ultracool dwarf (M9.5) that was discovered during the course of a survey for high-redshift quasars because it has an extremely red color (Irwin, McMahon, & Reid, 1991). Among the known very late M and L dwarfs, BRI 00210214 is one of the fastest rotators with km s-1 (Basri, 2001). Moreover, it is a very inactive dwarf because it usually does not show a detectable Hα emission line (Basri & Marcy, 1995), although a weak flare has been observed once (Reid et al., 1999). Even at the maximum of the flare, the level of activity was 3 times lower than the mean quiescent level in mid-type M dwarfs. The flare recurrence rate was estimated to be 7% of the time. Neuhauser et al. (1999) reported a nondetection of X-rays from BRI 00210214 in a pointed ROSAT/HRI observation of 106 kiloseconds, implying , which is one of their most sensitive upper limits to X-ray emission from brown dwarf candidates.
The fast rotation of BRI 00210214, originally reported by Basri & Marcy (1995), prompted us to start a program of CCD monitoring in 1995. Earlier results of a program of CCD observations of M7–M9 field dwarfs have been reported in Martín, Zapatero Osorio, & Rebolo (1996). Thermal inhomogeneities in the atmosphere, such as magnetic cool spots or massive cloud systems, could be modulated with the rotation period, which is expected to be shorter than 0.135 day for a typical radius of 0.1 . Thus during one observing night, the object completes a few rotation cycles. This paper reports on the results of monitoring the behavior of BRI 00210214 in the -band over 10 nights in 1995 and 4 nights in 1996. In §2 we describe the data acquisition, reduction, and analysis techniques. In §3 we present the light curves that result from the differential photometry. We discuss the results and implications in §4, and our conclusions and directions for future research in §5.
2 Observations and Data Analysis
CCD images of BRI 00210214 were obtained on the nights of 1995 November 8–15 and 22–23 with the 1 m Jacobus Kapteyn Telescope (JKT) at the Observatorio del Roque de los Muchachos (La Palma), and on the nights of 1996 August 19–22 with the 0.82 m telescope (IAC80) at the Observatorio del Teide (Tenerife). We used standard broadband filters. The JKT was equipped with a pixel Tektronix camera mounted on the Cassegrain focus, providing a field of view of 32.3 arcmin2 (0333 pix-1). The IAC80 was equipped with a pixel Thomson camera mounted on the Cassegrain focus, providing a field of view of 54.4 arcmin2 (0433 pix-1). All nights were photometric with the exception of 1995 November 15 and 1996 August 21–22, which had some patchy thin cirrus. Exposure times ranged from 300 s to 500 s. We adjusted the exposure time to compensate for extinction due to high airmass or cirrus clouds. The seeing of the images varied from 10 to 25, and the airmasses at which they were taken ranged from 1.18 up to 1.80. All the CCD frames were bias subtracted and flat fielded using packages within the IRAF environment.222IRAF is distributed by National Optical Astronomy Observatory, which is operated by the Association of Universities for Research in Astronomy, Inc., under contract with the National Science Foundation.
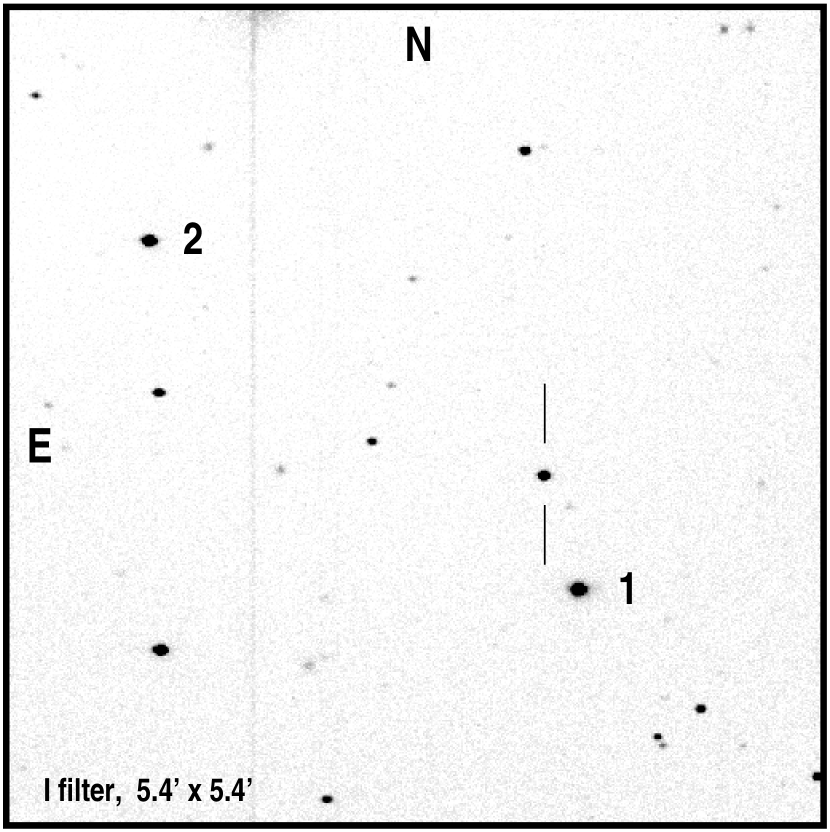
We performed aperture photometry on BRI 00210214 and on five other stars in the field using “vaphot,” an IRAF script written by Hans Deeg (Deeg et al., 1998). We verified that the two brightest stars in the field of view are not variable on the timescale of our observations, and we have used them as reference stars. They are shown in Figure 1. Images were first aligned, and the nonoverlapping parts were removed. Changes in the seeing conditions and in the telescope focus throughout a night implied variations in the size of the point-spread function (PSF) of the stellar sources from frame to frame. To take this into account we derived an average PSF of the three stars by fitting a circular Gaussian on each frame. All three sources comply with the requisites for a good definition of the PSF. Additionally, to obtain high signal-to-noise aperture photometry, we determined optimum apertures for each star according to Howell (1989). All apertures were expressed in multiples of the FWHM of the average PSF, and the sky intensity was defined as an outer ring 1.5 pixels wide. These multiples were kept constant from night to night. Finally, instrumental magnitudes were computed, and relative magnitudes (i.e., differential photometry) of BRI 00210214 with respect to the sum of the flux of the two reference stars were derived. The 1 accuracy of the differential photometry is 0.006 mag and 0.003 mag for the IAC80 and JKT data, respectively.
3 Results
Figure 2 displays the light curve of BRI 00210214 obtained at the JKT in 1995 November. The photometry of reference star 1 with respect to reference star 2 is also shown. The target presents a larger photometric dispersion than the two reference stars. In Figure 3, we show the standard deviation () associated with the total JKT differential light curve of BRI 00210214 and five other stars (including the references 1 and 2) in the field of view of our CCD images. We call this quantity in analogy to Bailer-Jones & Mundt (2001). The -band photometry was calibrated using the DENIS -band magnitude of reference star 1 (X. Delfosse, 2000, private communication). The value of increases toward fainter magnitude, as expected. We find a rather tight relationship between -band magnitude and value for the JKT data () with a scatter of 0.0006 mag (1 ). The amplitude of photometric variability in the JKT data of BRI 00210214 is 0.0182 magnitudes. This value is 14 away from the relation between I-magnitude versus for the reference stars.
Figure 4 displays the total light curve of BRI 00210214 obtained at the IAC80 in 1996 August. The scatter in the differential photometry of BRI 00210214 in the IAC80 data set is mag, which is a factor of three lower than that in the JKT data set ( mag). On the other hand, the photometric errors in the IAC80 data are larger due to the smaller aperture of the telescope and poorer image quality. In Figure 5 we plot the versus -band magnitude (DENIS system). The relation between these two quantities is not as good as for the JKT data. The standard deviation of the fit shown in Figure 5 is 0.00316 mag (compare with 0.0006 mag for the fit shown in Figure 3). This is probably because there are large PSF variations across the CCD frames taken with the IAC80. BRI0021–0214 and reference star 1 have a better PSF than the average of the other reference stars because they are closer to the center of the chip. Our differential photometry was obtained by averaging the fluxes of the reference stars, and this procedure gives more weight to the brighter sources. The reference star 1 is the brightest source. Figure 5 indicates that photometric variability of BRI 00210214 with the same amplitude as in the 1995 JKT dataset ( mag) can be ruled out in the IAC80 dataset with a confidence of 2.5 . Thus, the photometric variability of BRI 00210214 in the I-band appears to have decreased from 1995 November to 1996 August. In the next subsection we will show that this effect can be accounted for by a source of periodic modulation which was present in 1995 but vanished in 1996.
Since BRI 00210214 is redder than the reference stars, we checked for the presence of correlations between differential magnitude and airmass or seeing, which, if present, might indicate color-dependent differential photometric effects due to refraction and scattering in the Earth’s atmosphere. We did not find any such correlation, as illustrated in Figures 6 and 7. We conclude that the variability of BRI 00210214 is likely to be intrinsic to the object, and not due to changes in the Earth’s atmosphere.
3.1 Periodogram analysis
We performed a period analysis of the data using a CLEAN algorithm modified by one of us (H. J. Lehto, 2002, in preparation). For an earlier version of this method, see Roberts, Dreher, & Lehár (1987). The sampling in both the 1995 November and 1996 August data sets is such that the window function shows high sidelobes at small multiples of about 1 d-1. In principle, these could create ambiguity in the determined period.
Because CLEAN (and any other deconvolution method) contains inherently degenerate solutions, we ran several solutions with different values of the gain to get an idea of the stability of the solution. The solutions for our periodograms remained stable. In 1995 November, BRI 00210214 shows a single strong peak with a frequency of 1.1898 d-1, corresponding to a period of 0.8405 day. This peak has a pseudo-power about 2 orders of magnitude higher than the highest peak in the comparison star’s CLEANed periodogram (Fig. 8). The amplitude of this peak is 0.018 mag, which is similar to the value of . In 1996 August there is no sign of the 0.8405 day peak, but a new small cluster of peaks has appeared around 4.8842 d-1 (corresponding to a period of 0.205 day). These peaks clearly have a lower amplitude than previously, and may represent a sinusoid-like variation with a modulated amplitude. There is also a small possibility that the dominant frequency of this variation is actually 4.0115 d-1 (corresponding to a period of 0.249 day). The amplitude of the peak at day is 0.007 mag, which is similar to the photometric errors. The periodogram can, however, find a sinusoid of amplitude below the photometric uncertainty because the noise is spread over many frequencies in the power spectrum.
Figures 9 and 10 present the JKT light curve of BRI 00210214 folded with a period of 0.84 day. In the first figure, data points taken at different nights are given different symbols. In the second one the data points have been binned in groups of five and a sinusoid fit is overplotted. We note that around phase=0.5 the data seems to deviate from the sinusoidal function. Each individual error bar corresponds to the standard deviation of a group of five points. Figure 11 displays the IAC80 light curve of BRI 00210214 folded with a period of 0.20 day. Data points have been binned by 5, as in Figure 10. The amplitudes of the sinusoidal fits are 0.022 mag for the JKT and 0.006 mag for the IAC80. After subtracting the 0.84 day sinusoidal fit from the JKT data, we searched for the 0.2 day period. The JKT residual photometry is plotted in phase with day in Figure 12. Data points have been binned in groups of seven to increase the S/N ratio. The shape of the phased light curve suggests that the 0.2 day period may be present in the JKT data, although the amplitude is lower than the 0.84 day modulation. In fact, the amplitude of the 0.2 day sinusoidal fit to the JKT residuals is 0.006 mag, which coincides with the amplitude of the fit to the IAC80 data.
4 Discussion
The presence of the 0.2 day photometric modulation in both the IAC80 and JKT light curves of BRI 00210214 suggests that this is a long-lived modulation. Could it be the rotation period? The absolute magnitude and of BRI 00210214 are and 2,500–2,000 K (Leggett et al. 1998), respectively. Another observational constraint is that lithium has been depleted from the atmosphere (Basri & Marcy, 1995). According to the evolutionary models of Chabrier et al. (2000), the lack of lithium rules out the possibility that the object is younger than 0.3 Gyr and less massive than 0.06 . Given these constraints, the models predict that the radius of BRI 00210214 should be . For , , and km s-1, we get a period of 0.14 day, which is inconsistent with our periodogram analysis. The radius would have to be 0.14 to get a rotation period of day, which is inconsistent with the theory. We consider several hypotheses to explain this discrepancy.
First, we consider the possibility of non-rotational line broadening. Three different studies have derived independently by using high-resolution optical spectra (Basri & Marcy, 1995; Tinney & Reid, 1998; Basri, 2001). They all find values of about 40 km s-1, and we have adopted the most recent one. The agreement between measurements obtained at different epochs indicates that the broadening is not due to an unresolved spectroscopic binary. BRI 00210214 does not have an unusual rotation among the sample of late M and L dwarfs that have been studied at high spectral resolution. It is unlikely that the broadening is due to any line formation effect, which should basically be the same for all dwarfs of similar gravity and temperature.
Second, we consider the possibility that the radius is about 30% larger than predicted by the models. Recently, the radius of an extrasolar giant planet has been observed for the first time. The planet HD209458b has a radius about 40% larger than that of Jupiter (Mazeh et al., 2000). The favored interpretation is that the radius has been puffed up by stellar insolation (Burrows et al., 2000). The radius of BRI 00210214, however, cannot be increased in the same way because of the lack of a close main-sequence star. The lack of detected X-ray emission by ROSAT (Neuhauser et al., 1999) rules out the possibility that there is a compact relativistic primary, such as a black hole or neutron star. The effects of rotation have not yet been included in models of brown dwarfs. One possible effect in a fully convective object is a larger radius and a cooler central temperature (Martín & Claret, 1996). Preliminary calculations by I. Baraffe (2000, private communication) indicate, however, that the rotational distorsion in a fast-rotating 0.1 M⊙ star is small (1%).
Our previous discussion has ruled out the possibility of problems with either the sin or the theoretical radius. Thus, we must address the evidence that BRI 00210214 presents periodic photometric variability with periods longer than the rotation period.
Cool stars are usually understood by analogy to the Sun. Periodic photometric variability in cool stars arises from the presence of dark spots, where the enhanced magnetic field suppresses convective energy transport and cools off the plasma to temperatures below that of the photosphere. Early- and mid-M-type dwarfs have a high occurrence of Hα emission, light variability, and flares (the BY Dra syndrome), e.g., Bopp & Espenak (1977); Herbst & Miller (1989). The photometric periods of BY Dra stars are consistent with their expected rotation periods. The fraction of the bolometric luminosity that is emitted in the Hα line () is for the active, photometrically variable, BY Dra stars. Many of these stars have photometric variability with an amplitude of 0.3 to 0.02 mag in the V-band (Bopp & Espenak, 1977; Pettersen et al., 1987; Alekseev & Gershberg, 1997).
BRI 00210214 is rotating even faster than most BY Dra stars, but it is not active. It has (Basri & Marcy, 1995), which is more than two orders of magnitude lower than the BY Dra stars. Magnetic flares cannot account for the observed light changes because they happen 7% of the time and are too weak to produce continuum light at optical wavelengths (Reid et al., 1999). Thus, it seems unlikely that the source of photometric variability in BRI 00210214 is a magnetic field because most of the time there is no evidence for chromospheric or coronal cooling.
Bailer-Jones & Mundt (2001) recently presented results of an -band search for variability in 21 late-M and L dwarfs. Half of their objects present evidence for variability with amplitudes of 0.01 to 0.05 mag on timescales between 0.4 and 100 hr. CLEAN periodograms found strong periodicities at about a few hours in some of the objects, but for other objects the variability did not seem to be periodic. For one object with observations obtained 1 year apart, no common period could be found. Bailer-Jones & Mundt (2001) argued that the periodicities were due to long-lived surface features modulated with the rotation periods, and the absence of periodicities for other stars was due to surface features that evolved in brightness and physical size on timescales of a few hours to a few days. The surface inhomogeneities could plausibly be due to magnetically induced spots or plages, or dusty clouds.
If magnetic fields produce surface features, we would expect that the amplitude of the photometric modulation may scale with the strength of Hα emission. We could also expect that photometric modulation becomes smaller for cooler objects, because they tend to be more inactive (Gizis et al., 2000). Bailer-Jones & Mundt (2001) found that the amplitude of photometric modulation does not depend on spectral type from M6 through L5. In Figure 13 we plot photometric variability () versus Hα equivalent width (EW) of BRI 00210214 together with L dwarfs for which Bailer-Jones & Mundt found evidence for variability. For these ultracool dwarfs there is no correlation between EW and the amplitude of photometric variability, suggesting that these two observables are not causally connected.
We conjecture several possibilities to explain the pattern of variability in BRI 00210214: (a) There is differential rotation in BRI 00210214, however it would have to be extreme to explain the very long periodicity of 0.84 day; (b) There are turbulent regions in BRI 00210214 reminiscent of Jupiter’s bands and zones. Perhaps bright spots are lagging behind the mean rotation of the photosphere; however, the period of 0.84 day seems again to be too extreme because Jupiter’s zonal velocities are moderate (Smith & Hunt, 1976). On the other hand, this period may be related to a zonal oscillation. Jupiter’s Great Red Spot has a zonal oscillation with a period of three months (Solberg, 1969), and it is possible that an ultracool dwarf may have shorter zonal oscillation period; (c) The fast rotation of BRI 00210214 (almost three times faster than Jupiter) may produce instabilities related to strong Coriolis forces. The instabilities may lead to wave motions typical of rotating fluids, similar to inertial waves or Rossby waves e.g., Tritton (1988). It is possible that the 0.2 day periodicity corresponds to a stable pulsation mode, but the 0.84 day periodicity cannot be accounted for by stable pulsations; (d) Convection reaches the optically thin layers of ultracool dwarf atmospheres (Hauschildt, Allard, & Baron, 1999). Coriolis forces and convective overshooting may push clouds of dust some distance beyond the theoretical radius of structural models. Some cloud decks could reach out to significant altitudes with respect to the surface. They would be dragged by rotation, but they could lag behind the deeper layers. The photosphere of BRI 00210214 may not rotate as a solid body. The 0.2 and 0.84 day periods could arise from bright or dark clouds located high above the photosphere.
5 Conclusions and Future Directions
We have monitored the brightness of the ultracool dwarf BRI 00210214 for 10 nights in 1995 November and 4 nights in 1996 August using -band CCD imaging. BRI 00210214 has shown significant variability, particularly in 1995. We find a surprisingly long modulation in the 1995 data set (0.84 day) that cannot be due to rotation. A CLEAN periodogram of the 1996 data set gives a periodicity of 0.2 day. None of these two periods correspond to the expected rotation period (0.14 day).
Since BRI 00210214 is a very inactive object with extremely low levels of Hα and X-ray emission, we favor the interpretation that the source of surface thermal inhomogeneities required to explain the photometric variability are clouds rather than magnetically induced spots. BRI 00210214 has weak TiO bands, which is a sign of Ti depletion by condensation onto grains. The atmosphere of BRI 00210214 is too warm for water to condense, but silicate and iron clouds are expected (Chabrier et al., 2000; Ackerman & Marley, 2001). Theoretical models indicate that they play a key role in controlling opacity and temperature structure in the atmosphere. The rapid rotation and cool temperature of BRI 00210214 could make its surface appear more analogous to Jupiter than to the Sun. Gelino & Marley (2000) have simulated integrated light observations of Jupiter at 400 nm (-band) made by the Hubble Space Telescope. They find that the apparent magnitude could be modulated with Jupiter’s rotation period. The amplitude of the sinusoidal light curve would be about 0.04 mag, which is similar to the amplitudes found by us and Bailer-Jones & Mundt (2001). Gelino & Marley (2000) predict that the amplitude would be larger in the thermal emission regime. Thus, near-infrared monitoring of BRI 00210214 and other ultracool dwarfs may be worthwhile.
Tinney & Tolley (1999) reported a search for variability using a tunable filter technique to measure changes in the strength of TiO bands. Tinney (2000) discusses more techniques, such as long-slit spectra and narrowband imaging. We suggest that -band observations could be particularly valuable to search for changes in the dust-induced greenhouse effect on the CO bands. Optical spectroscopic monitoring could test the hypothesis that the clouds are made of dust because the strengths of the TiO bands should be variable. A report of possible variability of the Li I resonance line in Kelu 1, an L2 dwarf, was made by Martín et al. (1998). Since the Li I line is formed against a background of TiO bands (Pavlenko, 2000), the apparent variability of the atomic line could be due to variable TiO opacity and/or variable continuum opacity. Kirkpatrick et al. (2001) reported variability in the L dwarf Gl 584 C in the 835–975 nm region in timescales of days and years.
We have briefly discussed four possible scenarios to explain the variability observed in BRI 00210214: differential rotation; bands and zones moving with different velocities; pulsations; and turbulent clouds located high above the photosphere. In any case, the variability of BRI 00210214 is more complicated than previously anticipated. Simultaneous multiwavelength observations may shed light on what phenomena are responsible for the surprising photometric behaviour of BRI 00210214.
References
- Ackerman & Marley (2001) Ackerman, A. S., & Marley, M. S. 2001, ApJ, submitted
- Alekseev & Gershberg (1997) Alekseev, I. Y., & Gershberg, R. E. 1997, ARep, 41, 207
- Allard et al. (1997) Allard, F., Hauschildt, P. H., Alexander, D. R., & Starrfield, S. 1997, ARA&A, 35, 137
- Allard et al. (2001) Allard, F., Hauschildt, P. H., Alexander, D. R., Tamanai, A., & Schweitzer, A. 2001, ApJ, in press
- Bailer-Jones & Mundt (2001) Bailer-Jones, C. A. L., & Mundt, R. 2001, A&A, 367, 218
- Basri (2001) Basri, G. 2001, in ASP Conf. Ser. 223, Cool Stars, Stellar Systems and the Sun, Eleventh Cambridge Workshop, ed. R. J. García López, R. Rebolo, & M. R. Zapatero Osorio (San Francisco: ASP), 261
- Basri et al. (2000) Basri, G., et al. 2000, ApJ, 538, 363
- Basri & Marcy (1995) Basri, G., & Marcy, G. W. 1995, AJ, 109, 762
- Bopp & Espenak (1977) Bopp, B. W., & Espenak, F. 1977, AJ, 82, 916
- Burrows et al. (2000) Burrows, A., Guillot, T., Hubbard, W. B., Marley, M. S., Saumon, D., Lunine, J. I., & Sudarsky, D. 2000, ApJ, 534, L97
- Chabrier et al. (2000) Chabrier, G., Baraffe, I., Allard, F., & Hauschildt, P. 2000, ApJ, 542, 464
- Deeg et al. (1998) Deeg, H. J., et al. 1998, A&A, 338, 479
- Gelino & Marley (2000) Gelino, Ch. R., & Marley, M. S. 2000, in ASP Conf. Ser. 212, From Giant Planets to Cool Stars, ed. C. A. Griffith & M. S. Marley (San Francisco: ASP), 322
- Gizis et al. (2000) Gizis, J. E., Monet, D. G., Reid, I. N., Kirkpatrick, J. D., Liebert, J., & Williams, R. J. 2000, AJ, 120, 1085
- Hauschildt, Allard, & Baron (1999) Hauschildt, P. H., Allard, F., & Baron, E. 1999, ApJ, 512, 377
- Herbst & Miller (1989) Herbst, W., & Miller, J. R. 1989, AJ, 97, 891
- Howell (1989) Howell, S. B. 1989, PASP, 101, 616
- Irwin, McMahon, & Reid (1991) Irwin, M., McMahon, R. G., & Reid, I. N. 1991, MNRAS, 252, 61
- Jones & Steele (2001) Jones, H. R. A., & Steele, I. A. 2001, Proceedings of the Ultracool Dwarfs workshop, IAU General Assembly, Lecture Notes in Physics (Berlin: Springer), in press
- Kirkpatrick et al. (1999) Kirkpatrick, J. D., et al. 1999, ApJ, 519, 802
- Kirkpatrick et al. (2001) Kirkpatrick, J. D., et al. 2001, AJ, in press
- Leggett, Allard, & Hauschildt (1998) Leggett, S. K., Allard, F., & Hauschildt, P. H. 1998, ApJ, 509, 836
- Leinert et al. (2000) Leinert, Ch., Allard, F., Richichi, A., & Hauschildt, P. H. 2000, A&A, 353, 691
- Marley (2001) Marley, M. 2001, in ASP Conf. Ser., Planetary Systems in the Universe: Observation, Formation and Evolution, ed. A. J. Penny, et al. (San Francisco: ASP), in press
- Martín et al. (1997) Martín, E. L., Basri, G., Delfosse, X., & Forveille, T. 1997, A&A, 327, L29
- Martín et al. (1998) Martín, E. L., Basri, G., Zapatero Osorio, M. R., Rebolo, R., & García López, R. J. 1998, ApJ, 507, L41
- Martín et al. (2000) Martín, E. L., Brandner, W., Bouvier, J., Luhman, K., Stauffer, J., Basri, G., Zapatero Osorio, M. R., & Barrado y Navascués, D. 2000, ApJ, 543, 299
- Martín & Claret (1996) Martín, E. L., & Claret, A. 1996, A&A, 306, 408
- Martín et al. (1999) Martín, E. L., Delfosse, X., Basri, G., Goldman, B., Forveille, T., & Zapatero Osorio 1999, AJ, 118, 2466
- Martín, Zapatero Osorio, & Rebolo (1996) Martín, E. L., Zapatero Osorio, M. R., & Rebolo, R. 1996, ASP Conf. Ser. 109, in Cool Stars, Stellar Systems and the Sun, Ninth Cambridge Workshop, ed. R. Pallavicini & A. K. Dupree (San Francisco: ASP), 615
- Mazeh et al. (2000) Mazeh, T., et al. 2000, ApJ, 532, L55
- Neuhauser et al. (1999) Neuhauser, R., et al. 1999, A&A, 343, 883
- Pavlenko (2000) Pavlenko, Ya. V. 2000, A Rep, 44, 219
- Pettersen et al. (1987) Pettersen, B. R., Lambert, D. L., Tomkin, J., Sandman, W. H., & Lin, H. 1987, A&A, 183, 66
- Reid et al. (1999) Reid, I. N., Kirkpatrick, J. D., Gizis, J. E., & Liebert, J. 1999, ApJ, 527, L105
- Roberts, Dreher, & Lehár (1987) Roberts, D. H., Dreher, J. W., & Lehár, J. 1987, AJ, 93, 968
- Rutledge et al. (2000) Rutledge, R. E., Basri, G., Martín, E. L., & Bildsten, L. 2000, ApJ, 538, L141
- Smith & Hunt (1976) Smith, B. A., & Hunt, G. E. 1976, in Jupiter, ed. T. Gehrels, The University of Arizona Press, 564
- Solberg (1969) Solberg, H. G., Jr. 1969, Icarus, 10, 412
- Tinney (2000) Tinney, C. G. 2000, in ASP Conf. Ser. 212, From Giant Planets to Cool Stars, ed. C. A. Griffith & M. S. Marley (San Francisco: ASP), 278
- Tinney & Reid (1998) Tinney, C. G., & Reid, I. N. 1998, MNRAS, 301, 1031
- Tinney & Tolley (1999) Tinney, C. G., & Tolley, A. 1999, MNRAS, 304, 119
- Tritton (1988) Tritton, D. J. 1988, Physical Fluid Dynamics, Clarendon Press, Oxford
- Tsuji, Ohnaka, & Aoki (1996a) Tsuji, T., Ohnaka, K., & Aoki, W. 1996a, A&A, 305, L1
- Tsuji et al. (1996b) Tsuji, T., Ohnaka, K., Aoki, W., & Nakajima, T. 1996b, A&A, 308, L29
- White et al. (1999) White, R. J., Ghez, A. M., Reid, I. N., & Schultz, G. 1999, ApJ, 520, 811