The Radio Corona of AR Lacertae
We present multifrequency VLA and VLBA observations at 8.4 GHz of the RS CVn system AR~Lac, that were performed in autumn 1997 simultaneously with X-ray observations obtained from Rodonò et al. (Rodono (1999)). Our VLBA data indicate a resolved source with dimension close to the system separation, while the study of the flux density curve evidences a small amplitude outside of the eclipse variability. The derived five-frequencies spectra, combined with the size information from VLBA data, are compared with gyrosynchrotron emission from a two component structured source. A comparison with the results of the X-ray observations allow us to exclude the possibility that thermal gyrosynchrotron is responsible for the radio emission, but it is compatible with the hypothesis of co-spatial X-ray and radio emitting sources.
Key Words.:
Stars: coronae – Radio continuum: stars – Stars: binaries: close – Stars: individual: AR Lac – Stars: binaries: general – Techniques: interferometric –1 Introduction
The RS CVn stars constitute one of the major classes of stellar system radio sources. The intense and highly variable radio emission is strictly related to magnetic activity and originates from the interaction of mildly relativistic electrons and magnetic fields (gyrosynchrotron emission) on one or both components. Radio observations of this kind of system can, therefore, allow us to directly investigate non-thermal phenomena occurring in stellar coronae.
AR Lacertae (G2IV+K0IV) is a totally eclipsing RS CVn binary with a short, almost 2 days, orbital period (see Table 1 for the parameters of the system). Its orbital characteristics and strong coronal emission () make this source an ideal target for the studies of coronal structure and geometry of RS CVn close binaries.
| RK | 2.81 R⊙ | Chambliss (Chambliss (1976)) |
| RG | 1.54 R⊙ | Chambliss (Chambliss (1976)) |
| Sep. | 9.22 R⊙ | Chambliss (Chambliss (1976)) |
| MG/MK | 0.89 | Marino et al. (Marino (1998)) |
| Dist | 42 pc | Perryman (Perryman (1997)) |
| Prot | Marino et al. (Marino (1998)) |
The AR~Lac coronal emission has been widely studied using most of the X-ray satellites launched in the last twenty years. Early observations, carried out by Swank et al. (Swank (1981)) using the Einstein Solid State Spectrometer, showed two distinct temperature distributions centred at and to K. On the basis of Einstein IPC observations, Walter et al. (Walter (1983)) found that low lying coronae () seems to be associated with both component stars, while a more extended corona () only with the K subgiant.
| VLA | VLBA+VLA | ||||
| C Band | K Band | Q Band | X Band | U Band | |
| Nov 2-3 (U.T.) | 21:00-08:25 | 20:30-09:25 | 20:05-09:00 | 20:05-09:25 | 21:30-08:37 |
| Nov 3-4 (U.T.) | 21:00-08:25 | 20:30-09:25 | 20:05-09:00 | 20:05-09:25 | 21:30-08:37 |
| Number of scans | 10 | 11 | 11 | 7 | 6 |
| Duration of a scan [m] | 19 | 25 | 27 | 44 | 44 |
| Interval between scans [m] | 80 | 80 | 80 | 60 | 60 |
| Duty cycle (cal-sour-cal) [m] | 2-15-2 | 3-8-3 | 3-5-3 | 1.5-3-1.5 | 1.5-3-1.5 |
| Total Time on source [h] | 2.42 | 2.54 | 2.4 | 2.75 | 2.5 |
EXOSAT observations by White et al. (White (1990)) confirmed the existence of two different coronal regions associated with different temperature distributions. The observations showed evidence of modulations at low energy ( 1 keV), which are not present at high energy (1 keV). On the other hand, Ottmann et al. (Ottmann (1993)) observed evidence of the primary minimum in all energy bandpasses of the ROSAT PSPC.
Despite the numerous X-ray observations only a few have been carried out at radio wavelengths. Owen & Spangler (Owen (1977)) first studied the spatial structure of the radio corona of AR~Lac, on the basis of flux curve considerations, through observations performed at 4885 MHz with 5 VLA antennas. They did not found evidence of eclipses of either component. The same results were found by Doiron & Mutel (Doiron (1984)) on the basis of VLA observations carried out at 1.48 and 4.9 GHz, using all the 27 antennas of the array in B configuration. These results suggest that the size of the emitting region is larger than the whole system.
During a VLA 3-frequencies monitoring of AR~Lac, extended over an orbital period, Walter et al. (Walter87 (1987)) detected the decay of a relative large flare. The event was not observed at 20 cm and the radio spectra seems to turn over between 2 and 6 cm.
In the present paper we present the results of a multifrequency observing campaign on the binary system AR Lacertae (HD 210334), simultaneously performed with the Very Large Array (VLA) and the Very Long Baseline Array (VLBA) 111 The Very Large Array and the Very Long Baseline Array are facilities of the National Radio Astronomy Observatory which is operated by Associated Universities, Inc. under cooperative agreement with the National Science Foundation radio interferometers in the autumn 1997. The observations cover two orbital periods and took place contemporaneously with X ray observations of the same system carried out with the SAX satellite by Rodonò et al. (Rodono (1999)).
2 Observations and data reduction

The observations were performed in 1997 in four sessions, starting each day at 20:00 UT and ending at 9:40 UT of the following day, from Oct 31 to Nov 4.
The aim of these observations was to obtain simultaneously radio spectra at five frequencies and high resolution maps of AR~Lac at 4 cm and 2 cm. The spectra were obtained with the VLA in D configuration at 5 GHz (6 cm, C band), 8.4 GHz (4 cm, X band), 15 GHz (2 cm, U band), 22 GHz (1.3 cm, K band) and 43 GHz (0.7 cm, Q band), while the high resolution VLBA observations were performed at 8.4 and 15 GHz. In order to reach the best compromise between high sensitivity for the VLBA array and the best temporal coverage for the radio spectrum, we split the VLA into two subarrays, one observing in standard interferometric mode and alternating 3 frequencies, the other in phased array mode as element of the VLBA.
2.1 VLA data
The first VLA subarray, which consisted of the 13 telescopes equipped with the 43 GHz receivers, was used to observe alternately at 43, 22 and 5 GHz, with two independent 50 MHz wide contiguous bands, in Right and Left circular polarization.
As phase calibrator we used BL~Lac, while as primary flux calibrator we used 3C286, which was observed at the begin of each session at all the 3 frequencies.
To minimize the effects of the atmosphere on the phase stability at higher frequency we observed the phase calibrator more frequently at Q and K bands than at the other frequencies. Other details of the observational strategy are given in Table 2.
Calibration and data editing were performed using the standard procedures of the AIPS package.
Since we intend to study only our radio observations taken simultaneously with the X-ray observations, which started on 1997 Nov 2, we restrict our analysis to the last two sessions, i.e. Nov 2-3 and Nov 3-4. In the first two days the source was found in an active period, with flux densities reaching about 40 mJy at 6 cm. This indicates an intrinsic high variability of the radio emission, which will be analyzed in a following paper.
2.2 VLBA data
The second subarray, consisting of all the remaining 14 antennas, was used to observe in phased-array mode at X and U band as an element of the VLBA array. The presence of half the phased VLA, corresponding to a 90 m telescope, increased the sensitivity of the VLBA.
The data from the VLA phased-array can be also analyzed as a standard interferometer, therefore total fluxes were computed for all the observed sources. The VLBA observations were performed alternating between X and U bands, with a typical scan lasting 45 minutes. For each observing frequency, we observed in dual polarization mode, with a total bandwidth of 64 MHz. Since AR~Lac has generally a low flux density (from few to some tens of mJy), we used the phase-reference technique (Beasley & Conway, Beasley (1995)), consisting of the rapid switching between a strong calibrator, close to the target source, and the source itself. In this way, in the successive analysis, phase calibration of the calibrator can be applied to the target source. We used BL~Lac ( degrees apart from AR~Lac) as reference source. The data tapes were correlated at the VLBA correlator at the Array Operation Center in Socorro (New Mexico).
As for VLA data, calibration and data editing were performed using the standard procedures of the AIPS package. The flux calibration was performed by using the measured system temperature and gain curves for VLBA telescopes and from the measurements of the ratio made on the calibrator BL~Lac for the phased-array, once the flux density of this source was determined from the VLA data. Delay and delay rate were determined for BL~Lac, which was then self-calibrated. The final map of the self-calibration was used as a model for the final global fringe fitting, whose solutions were applyed to our target. A preliminary map of AR~Lac at 8.4 GHz was made to check its position, and it was found about 14 milliarcsec (mas) away from the phase tracking center. This was due to the fact that the coordinates used at the correlator were the heliocentric ones, and the displacement of the source was due to the annual parallax. The visibilities of AR~Lac were then phase-rotated in order to bring it to the phase center. The operation makes it possible to time average the data over a relatively long time (tens of minutes) without lose signal in the longest baselines, allowing us to analyze the amplitude of the visibility as a function of the baseline length. If the source is not at the phase center a rapid change of phase would occurr at the longest baseline.
The source was successfully detected at 8.4 GHz, but not at 15 GHz, probably because of a poor phase stability at this frequency, which we could not correct with the phase referencing technique.

3 Results
3.1 Total flux and Spectra from VLA data
In order to investigate the temporal radio flux behaviour of the source and locate possible rapid flux variations, we analysed each scan with the AIPS program DFTPL. This procedure performs the direct Fourier transform of the visibility function in a limited portion of the UV plane. The results of such analysis led to the conclusion that, even if the radio flux of AR~Lac is variable, it does not change significantly on timescale shorter than 45 minutes, which is about the time length of each scan.
In Fig. 1 the flux curves, obtained by averaged flux in 20 min bins and using the new ephemeris by Marino et al. (Marino (1998)), are shown.
The source was detected at all frequencies during both sessions, except during the last session in the Q-band, where only an upper limit of 0.6 mJy for the flux density can be given. This value corresponds to the rms of the cleaned map integrated over the entire 14 hours. A clear flux variation, more evident at the lowest frequencies (up to a factor of 2 in C-band), seems to indicate the presence of inhomogeneous features on one or both of the system’s components. Unfortunately, AR Lac was not visible from the VLA during eclipses. We observed a clear flux maximum at phase 0.88, and a clear decay at the beginning of each of the two sessions, suggesting a flux modulation versus phase. No significant circular polarization at any observed frequency was detected.
Since each band was not observed continuously, it is not possible to build radio spectra with simultaneous flux measurements at all the frequencies. However the variations of the flux are slow, and it was possible to make reasonable interpolations in order to obtain the radio spectra. Six spectra corresponding to different times are shown in Fig. 2. They all show negative spectral indexes (S ), implying that the source is optically thin in the available range of frequencies ( varies from to ). There is not evidence of a turn-over frequency, which is presumable lower than 5 GHz. The spectra show the approximately same shape, and the main difference is flux density variation.
3.2 Spatial structure from VLBA data
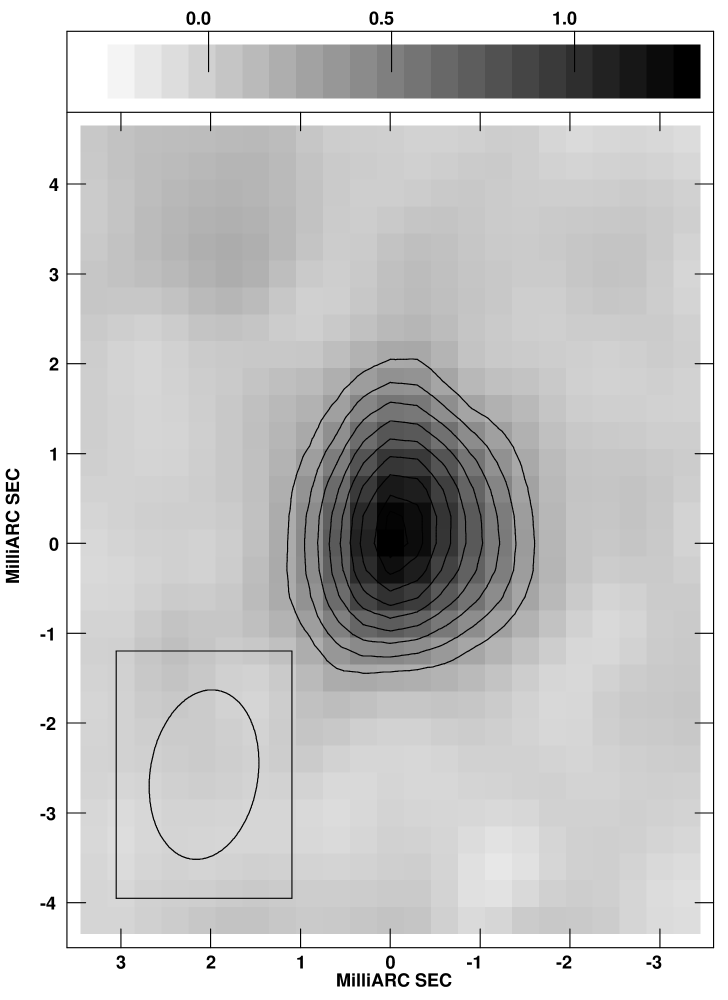
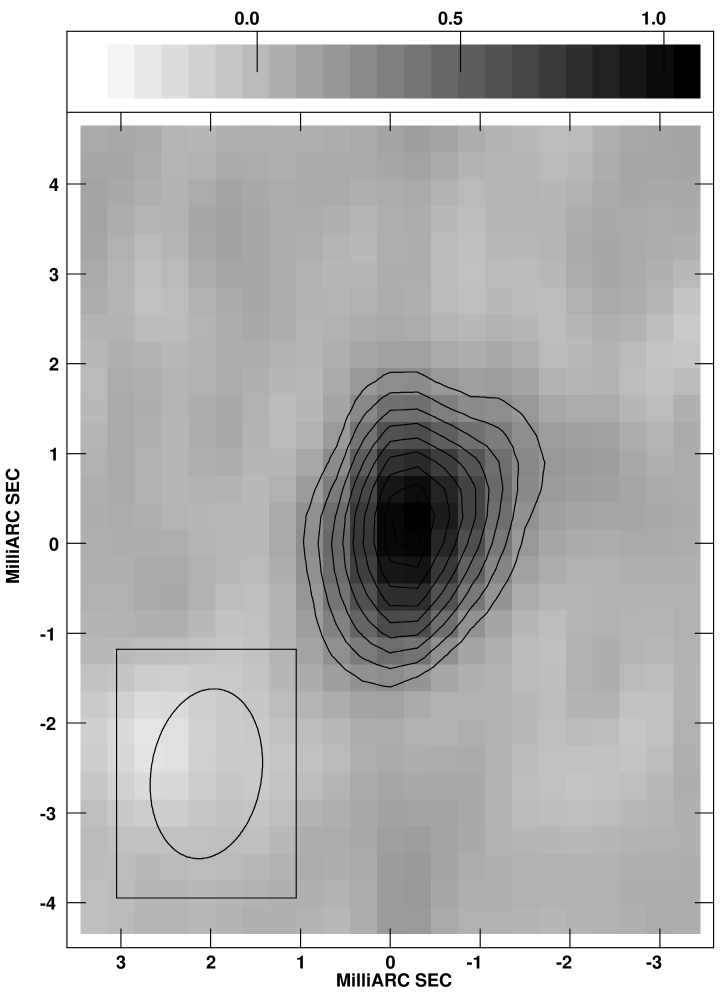


In Fig. 3 the VLBA cleaned map of AR~Lac for the two sessions, which were obtained from the phase reference calibration, are shown. The FWHMs of the beam for both the maps are mas, with a position angle of and mJy. We did not measure significant circular polarisation from the VLBA data. The source appears resolved and the two maps do not show significant changes in their structure.
The evidence of a resolved structure is confirmed by the analysis of the visibility amplitude versus the projected baseline spacing for the VLBA baselines involving VLA, which is shown in Fig. 4. The correlated flux has been first coherently averaged through the scan and then the amplitudes normalized to the zero spacing value, which was assumed to be equal to the total flux obtained from the VLA measurements in the same scan. Then, the visibility amplitudes have been averaged for each baseline, whose length variation during the observation is indicated by the horizontal bars. In order to measure the size of the emitting regions, or to derive the upper limit, we fitted the data with a two dimensional Gaussian models by using the AIPS routines UVFIT and JMFIT. The first routine gives an acceptable fit of UV-data with an elliptical Gaussian with FWHM of mas, while the second one fits the source image with a Gaussian component having FWHM of mas. The two models are then consistent each other and with a circular symmetric source. Using a circular Gaussian to fit the data, we obtain a source size of mas, corresponding to (see Table 1) or times the system separation ( mas). Our data are also compatible with two component models, where the first component is resolved, with dimension between 1.3 and 1.6 mas, while the second component is a point source. On the basis of results we cannot exclude the presence of such compact core.
| CORE | HALO | |
| [Gauss] | 200 | 30 |
| [cm-3] | ||
| Spectrum | d | d |
| [mas] | [mas] | |
| 0.16 | 1.4 | |
| 0.14 | 1.1 | |
| 0.15 | 1.3 | |
| 0.14 | 1.2 | |
| 0.16 | 1.3 | |
| 0.13 | 1.1 | |
| 0.7 | 5.4 | |
| [cm-3]† | ||
| [K]† | ||
| [cm-3] |
-
†
Rodonò et al. (Rodono (1999))
4 Discussion


The availability of both microwave spectra and spatial information at the same time gives the opportunity to model the coronae of AR~Lac. As shown in previous papers (Umana et al. Umana93 (1993), Umana et al. Umana99 (1999)), the observed flat radio spectra of Algols and RS CVn type binary systems cannot be reproduced by an homogeneous source model. VLBI observations of the close binary systems Algol and UX Arietis pointed out the existence of a two component structure in the coronal layers (Mutel et al. Mutel (1985); Lestrade et al. Lestrade (1998)): a compact core, coinciding with the active star, and a larger halo, having approximatively the size of the entire system.
We used the core-halo model developed by Umana et al. (Umana93 (1993)) to fit the observed spectra of AR~Lac, in order to check if the flux variability can be attributed to the variation of one of the parameters. Although it is not possible to derive an unique solution, we have limited the sizes of core and halo on the basis of the VLBA observations results. In particular, for the halo we assumed the size measured from the VLBA data, and for the core a size smaller than the resolution limit of the interferometer.
For the magnetic field strength we assumed , where Gauss, as derived for other RS CVn systems (Gondoin et al. Gondoin (1985), Donati et al. Donati92 (1992)).
According to these constraints, we derived the best core-halo model fit labeled a in Fig. 2.Then we used the derived values of the average magnetic field strength and energetic electron number density (), in fitting the other 5 spectra, under the hypothesis that these physical properties of the coronal emitting regions are stationary. Then we tried to fit the other spectra by varying only the structure size. The results of our analysis are summarised in Table 3 and shown in Fig. 5. For the spectra from a to d, we can get a good agreement between the observed data and a core-halo structure by assuming that the flux variations are due to structure size changes in the range of 1.1 and 1.4 times the stellar radius, corresponding a variation of 0.3 mas, which is below the errors of our measurements.
The low s/n ratio of the VLBA data does not permit to investigate the behaviour of the emitting region size for each single scan, and so as a function of the orbital phase. The source size is very close to the beam width, so it was not possible to obtain an estimate of the source size for the time ranges during which the flux density was lower then mJy. Nevertheless, the results obtained for the scans with sufficient s/n ratio, that are shown in Fig. 6 by diamond symbols, suggest that the source size remains almost constant, as the measured changes fall within errors.
On the other hand, it should be noted that the slow modulation of the modelled halo size is in good agreement with the results obtained from an independent analysis of the VLBA data and plotted in Fig. 6. To fit the spectra e and h, we had to assume an ”ageing” of the relativistic electron population and a variation of its number density from to cm-3, that is needed to explain the faster decay at the higher frequency.
If the core-halo model is suitable to account for the radio corona of AR~Lac, the visibilities of the VLBA data should fit by a two gaussian model corresponding to the core and halo. For the Nov 2-3 data, the average size of the core from the analysis of the spectra a, b, c, d is 0.15 mas, and the average flux density at 8.4 GHz is 1.21 mJy; for the halo, 1.25 mas and 1.74 mJy. For the Nov 3-4 data, the same parameters from the analysis of the spectra e and f are 0.145 mas, 1.05 mJy for the core and 1.20 mas, 1.17 mJy for the halo. We then model the normalized visibility function at 8.4 GHz with that corresponding to the core-halo model (Fig 4). It is evident that the VLBA data are consistent with the core-halo scenario derived from the analysis of the radio spectra.
VLBA data indicate a source size close to the separation of the binary components, suggesting the possibility of an emitting region located between the system components. UV emission from plasma close to the Lagrangian point in between the system components has been suggested for AR~Lac (Pagano et al. pagano (2001)) and other RS CVn-type systems (Busà et al. busa (1999)).
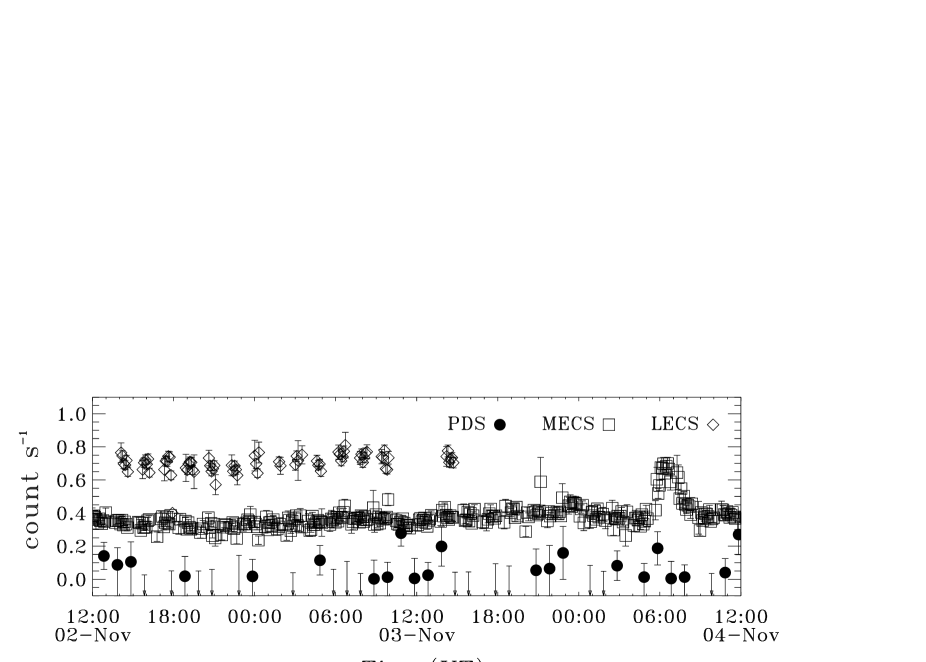
In partial overlap to our observations, X-ray observations of AR~Lac were performed with the Beppo SAX satellite (Rodonò et al. Rodono (1999)). This gave us the opportunity to determine whether the physical parameters of the radio emitting regions, derived from the comparisons between the observations and the core-halo models, are consistent with a co-spatial model for both the X-ray and radio emitting source.
Spectral analyses performed by several authors (Swank et al. Swank (1981), Singh et al. Singh (1995)) showed that the X-ray emission from close binary systems requires at least two plasma components characterised by different temperature and volumetric emission measure () to be modelled. On the basis of the first observation run, started on Nov 2 at 06:07 and ended on Nov 4 at 17:50, Rodonò et al. (Rodono (1999)) derived for the first component K and cm-3 and for the second K and cm-3.
Assuming that the higher temperature component is associated with the halo and the the lower temperature component with the core, we can check if the magnetic field, as derived from the radio data, is strong enough to contain the X-ray source. This means that , i.e. the ratio between the density of kinetic energy () to the density of magnetic energy () has to be less then unity. If the plasma density is constant over the emitting volume , , and assuming the size (radius) from the analysis of the radio data of and cm for the core and the halo respectively, we get and (see Table 3).
We obtain for the core and for the halo. The physical parameters obtained from our analysis are therefore consistent with the hypothesis of co-spatial X-ray and radio source.
We will furthermore test the possibility that the radio emission can be attributed to the same thermal electron population responsible for the observed X-ray emission. The brightness temperature of the resolved radio source at 3.6 cm, obtained from the relation
is T K and T K for the first and the second session, respectively. These values are higher of a factor of two respect to the temperature derived from the Beppo SAX data, but the order of magnitude is the same. We simulated the spectra of a core-halo structure by adopting thermal gyrosynchrotron emission and using the expression given by Dulk (Dulk (1985)) for the emission and absorption coefficients. By combining the physical parameters derived from Rodonò et al. (Rodono (1999)) for the thermal coronal plasma with our VLBA results we can fix the temperature, the thermal plasma density and the maximum size of the emitting regions. The only free parameter left is, thus, the magnetic field strength. The spectrum obtained for B=600 Gauss for the core and B=200 Gauss for the halo is plotted in Fig. 7 and compared with the spectra obtained from the VLA maps over the two sessions.

It is evident that gyrosynchrotron emission from the same thermal population responsible for the X-ray emission is not able to account for the observed spectra, unless magnetic field strength higher then 1000 Gauss are considered. Moreover, even assuming such an intense magnetic field, it is not possible to reproduce the quite flat observed spectra. Beasley & Guedel (beasley2000 (2000)) reached a similar result from simultaneous radio and X-ray observations of the RS CVn-type binary system UX~Ari during quiescence.
5 Conclusions
In this paper we presented the results of VLA multiwavelength observations and
the first 8.4 GHz VLBA images of AR~Lac we obtained in November 1997.
These
images show spatially resolved structure with a diameter of mas,
as derived from model fits. Since the source was very compact,
with dimension close to the beam size, and the flux density level was very low,
it was not viable
to derive the source diameter for each phase. Still, whenever possible,
the source size was derived (within 1–2 ).
No significant variations of the source size are apparent.
The flux density curves show a slight flux modulation, more evident at lower
frequencies, which suggests the presence of inhomogeneous structures. The
five-frequency spectra show a slightly negative spectral
index, which is
characteristic of an optically thin source.
By combining the spectral information the estimate of the source size and the results obtained from simultaneous X-ray observations (Rodonò et al. Rodono (1999)), we conclude that:
-
•
the spectral and spatial information of the radio corona of AR~Lac indicate a structured morphology, which can be modelled with a core-halo source;
-
•
the physical parameters, as derived from the fit of the observed spectra with the core-halo model, are consistent with the hypothesis of co-spatial X-ray and radio source;
-
•
the observed radio emission cannot be attributed to the same thermal electron population responsible for the observed X-ray emission.
The application of the core-halo model to the observed spectra allows us to reproduce the flux modulation observed between phases 0.7 and 0.9, by keeping fixed the physical parameters which characterise the two structures but changing just the size within the range defined from the VLBA resolution. Further observations will be able to verify the stability of the structure that can originate the modulation. In particular, since the numerous X-ray observations of this binary system seem to indicate structural changes of its corona (see Rodonò et al. Rodono (1999) for a summary) it will be extremely important to find out if this is true also for the radio corona and to check if our hypothesis of co-spatial emitting region is confirmed.
In addition, multiwavelength VLA observations to be carried out during eclipses would be a crucial test the hypothesis of an active region located in between the system components.
References
- (1) Beasley A.J., Conway J.E.,1995, in: Very Long Baseline Interferometry and the VLBA, eds. J.A.Zensus, P.J.Diamond & P.J.Napier, ASP Conf. Ser. 82, 327
- (2) Beasley A.J., Gùdel M., 2000, ApJ 529, 961
- (3) Busà I., Pagano I., Rodonò M., Neff J.E., Lanzafame A.C., 1999, A&A 350, 571
- (4) Chambliss C. R., 1976, PASP 88, 762
- (5) Doiron D J., Mutel R.L., 1984, AJ 89, 430
- (6) Donati J.F., Brown S.F., Semel M., et al., 1992, A&A 265, 682
- (7) Dulk G. A., 1985, ARA&A 23, 169
- (8) Lestrade J.F., Preston R.A., Jones D.L., Phillips R.B., Rogers A.E.E., Titus M.A., Rioja M. J., Gabuzda D.C., 1998, A&A 344, 1014.
- (9) Gondoin Ph., Giampapa M.S., Bookbinder J.A., 1985, ApJ 297, 710
- (10) Marino G., Catalano S., Frasca A., Marilli E. 1998, IBVS, 4499
- (11) Mutel R.L., Lestrade J.F., Preston R.A., Phillips R.B. 1985, ApJ. 289, 262
- (12) Ottmann R., Schmitt J.H.M.M., Kurster M., 1993, ApJ 413, 710
- (13) Owen F.N., Spangler S.R., 1977, ApJ 217, L41
- (14) Pagano I., Rodonò M., Linsky J.L., Neff J.E., Walter F.M., Kövari Zs., Matthews L.D., 2001, A&A 365, 128
- (15) Perryman M.A.C., The HIPPARCOS Science Team, 1997, ESA SP-1200, Vol.1-12, ESA Pubblication Division, c/0 ESTEC, Noorrdwijk, The Netherlands
- (16) Rodonò M., Pagano I., Leto G., Walter F., Catalano S., Cutispoto G., Umana G., 1999, A&A 346,811
- (17) Singh K.P., Drake S.A., White N.E., 1995, Ap.J. 445, 840
- (18) Swank J.H., White N.E., Holt S.S., Becker R.H., 1981, ApJ 246, 208
- (19) Umana G., Trigilio C., Hejellming R. M., Catalano S., Rodonò M., 1993, A&A 267, 126
- (20) Umana G., Leto P., Trigilio C., Hejellming R.M., Catalano S., 1999, A&A 342, 709
- (21) Walter F.W., Gibson D.M., Basri G.S., 1983, ApJ 267, 665
- (22) Walter F.W., Neff J.E., Gibson D.M., Linsky J.L., Rodonò M., Gary D.E., Butler C.J., 1987, A&A 186, 241
- (23) White N.E., Shafer R.A., Horne K., Parmar A.N. and Culhane J.L., 1990, ApJ 350, 776