The nature of the emission components in the quasar/NLS1 PG1211+143
Abstract
We present the study of the emission properties of the quasar PG1211+143, which belongs to the class of Narrow Line Seyfert 1 galaxies. On the basis of observational data analyzed by us and collected from the literature, we study the temporal and spectral variability of the source in the optical/UV/X–ray bands and we propose a model that explains the spectrum emitted in this broad energy range. In this model, the intrinsic emission originating in the warm skin of the accretion disk is responsible for the spectral component that is dominant in the softest X–ray range. The shape of reflected spectrum as well as Fe K line detected in hard X–rays require the reflecting medium to be mildly ionized (). We identify this reflector with the warm skin of the disk and we show that the heating of the skin is consistent with the classical prescription, while option is at least two orders of magnitude too low to provide the required heating. We find that the mass of the central black hole is relatively small (), which is consistent with the Broad Line Region mapping results and characteristic for NLS1 class.
1 Introduction
The quasar PG1211+143 (; Marziani et al. 1996) is one of the prototypes of AGN with particularly strong hard optical spectrum and profound steep soft X–ray emission (Elvis, Wilkes, & Tananbaum 1985). It has been frequently argued that the optical/UV and soft X–ray emission form a single Big Blue Bump component which extends across the unobserved XUV band (Bechtold et al. 1987), and strongly dominates the bolometric luminosity.
However, the nature of the soft X–ray emission – in particular, the spectral component that exhibits a very soft spectrum and often is seen in many quasars and Seyfert 1 galaxies only below keV – is still not determined unambiguously. There are arguments both in favor and against the origin of this emission component being the tail of the optical/UV Big Blue Bump. This is because any interpretation relies on extrapolating the spectrum over a decade in frequency through the unobserved XUV band.
The strong arguments in favor of the Big Blue Bump (BBB) extending up to the soft X–ray range are statistical in their nature. There is a strong, almost linear correlation between the luminosity of an object at 2500 Å and the soft X–ray luminosity in the ROSAT spectral band both in a large sample of Seyfert 1 galaxies (Walter & Fink 1993) and in radio quiet quasars (Yuan et al. 1998) suggesting a relatively uniform spectral shape of the BBB. Spectral analysis of both high redshift and low redshift quasars (Laor et al. 1997) allowed for a “shrinking” of the unobserved band and such spectra appear to cover smoothly the entire optical/UV/soft X–ray band.
Arguments against the soft X–ray emission being a direct tail of the optical / UV component are also mostly statistical. It is rather surprising from the theoretical point of view why the extension of the BBB should be the same in all objects having a range of black hole masses and luminosities. Instead, it was suggestive of some atomic processes (e.g. Czerny & Życki 1994). Also the normalized variability amplitude in the UV band is usually smaller than in the X–ray band (see e.g. Ulrich et al. 1997). A close look at the UV spectra of some sources frequently suggests a slight decline on diagram in the far UV (Malkan 1983; Magdziarz et al. 1998 for NGC 5548). This does not really allow for this component to extend far enough into XUV range to make it observable in the soft X–ray band, even if a certain amount of unsaturated Comptonization is taken into account.
| Instr. | Date | F(0.2 - 2)a | F(2 - 10)a |
|---|---|---|---|
| EINSTEIN | 1979Dec05 | 52.1 | 7.3 |
| EINSTEIN | 1980Dec11 | 75.0 | 10.5 |
| EXOSAT | 1985Jun13 | 59.7 | 9.9 |
| EXOSAT | 1986Jan28 | 41.2 | 6.4 |
| EXOSAT | 1986Jan09 | 18.9 | 5.8 |
| GINGA | 1985May06 | 8.5 | |
| ROSATa | 1991Dec17 | 16.1 | |
| ROSATb | 1992Jun17 | 21.9 | |
| ROSATc | 1992Jun28 | 30.6 | |
| ROSATd | 1992Jun28 | 34.2 | |
| ROSATe | 1993Jun02 | 20.5 | |
| ROSATf | 1993Jun25 | 19.0 | |
| ASCA | 1993Jun03 | 8.5 | 3.7 |
| RXTE | 1997Aug16 | 12.9 |
Detailed analysis of the broad band spectra of Seyfert 1 galaxy NGC 5548 (Magdziarz et al. 1998) led to a conclusion that the optical/UV spectrum is well modeled by an accretion disk, and the hard X–rays are reproduced by standard thermal Comptonization. However, an additional component is needed to model the soft X–ray source: the most viable candidate here is another, optically thick Comptonizing medium possibly associated with the transition between the disk and the hot plasma. This component would contain a major part of the source bolometric luminosity. Such a model also supports the scenario including a strong and extended Big Blue Bump with Comptonization playing a major role in formation of this component.
In this paper we study in detail the quasar PG1211+143. Our goal is to investigate (i) if a similar model also applies to this source, which is representative both for quasars and for Narrow Line Seyfert 1 galaxies, (ii) if this model is unique and (iii) what is the physical basis and possible observational consequences of such a phenomenological model.
The choice of object was motivated by the availability of considerable amount of observational data available, which span the last two decades. The object can be considered as a typical, although rather faint quasar, with at 5100 Å about erg s-1 (Kaspi et al. 2000) for the Hubble constant km s-1 Mpc-1. The broad band index measured between 2500 Å and 2 keV is 1.16 (Corbin & Boroson 1996) while for a typical quasar, it is 1.5 (Yuan et al. 1998). The soft X–ray slope measured in the ROSAT band is (Walter & Fink 1993) while typical quasar value is 2.58 (Yuan et al. 1998). Its optical emission lines are narrow, with the FWHM of line is km s-1 (Kaspi et al. 2000; see also Corbin & Boroson 1996; Wilkes et al. 1999) implying a classification of this object as a Narrow Line Seyfert 1 galaxy.
In Section 2 we describe the observational data that we analyzed, and how we supplement these with the data available from the literature. In Section 3 we give the results of the variability and spectral studies of PG1211+143. We discuss the physical processes that may lead to the observed behavior of the source in Section 4 and summarize the results in Section 5.
2 Observations and data analysis
First spectral X–ray data for PG1211+143 were obtained from the EINSTEIN observatory (see Table 1). Strong soft X–ray emission seen in EINSTEIN was described by Bechtold et al. (1987), and it was subsequently reanalyzed by Elvis et al. (1991). We determine the 0.2 - 2 keV and 2 - 10 keV intrinsic fluxes (i.e. corrected for Galactic reddening) in the second observation from the fits provided by Bechtold et al. (1987). The quality of the first observation was much lower, so we determined the soft and hard fluxes in this data by rescaling the Bechtold et al. (1987) results with the IPC count rate ratios 0.695 between the two observations, as given by Elvis et al. (1991).
Subsequent observations were performed by EXOSAT on three occasions (Elvis et al. 1991; Saxton et al. 1993). We determine the 2 - 10 keV intrinsic fluxes through the spectral fitting of publicly available ME data to a simple broken power law model with fixed galactic absorption. The 0.2 - 2 keV flux was calculated from the results of spectral fitting to LE data presented in Saxton et al. (1993).
On one occasion the source was observed by GINGA. We take the 2 - 10 keV flux from Lawson & Turner (1997).
PG1211+143 has been observed six times by the ROSAT satellite with the PSPC detector. One of the ROSAT pointings was simultaneous with ASCA observations. The ROSAT and ASCA spectral data were reduced using the standard software package, where for ASCA, we used data from all four detectors (SIS0/1 and GIS2/3) fitted simultaneously. Preliminary results based on these data were presented by Yaqoob et al. (1994) but we repeat their analysis, using the updated, current version of the ASCA response matrices. The ASCA observation was sufficiently long (88 ksec) to attempt a study of the light curve within this single data set, so we could also determine the variability on short time scales.
The Rossi X–ray Timing Explorer (RXTE) observations of PG1211+143 are new, conducted as a part of optical / X–ray monitoring program. The object was monitored roughly every 5 days for 6 months; the results of this program will be reported elsewhere (Netzer, Madejski, Kaspi, et al., in preparation). Here, we use the spectrum derived from the summed RXTE Proportional Counter Array (PCA) data analyzed in a standard manner (including the background subtraction), using the ftool script rex. The source was detected to at least 12 keV, beyond which the signal - to - noise ratio was becoming very low. There was no significant detection with the RXTE’s High Energy X–ray Timing Experiment (HEXTE).
All analysis of the spectral X–ray data was done using the XSPEC software package, version 10.0 (Arnaud 1996). We adopt a redshift 0.0809 to this source after Marziani et al. (1996) instead of 0.085 used in most previous papers (e.g. Bechtold et al. 1987; Yaqoob et al. 1994) since the new determination seems to be convincing. Whenever we fix the Galactic column density, we adopt the value of cm-2 after Elvis, Wilkes, & Lockman (1989) although another value (cm-2) was used by Lawson & Turner (1997); we note that the exact value of makes essentially no difference in our analysis.
The optical/UV spectrum of this source was determined by Bechtold et al. (1987). We use the broad band data of Elvis et al. (1994) and we compare them with the HST observations of Bechtold et al. (2000), performed on April 13 and 16, 1991.
3 Results
3.1 Time variability
3.1.1 Short timescales in the X–ray band
We study the short timescale variability in the hard and soft X–ray bands on the basis of the longest sequence from ASCA (June 3 - 4, 1993, s), and accompanying ROSAT (June 2 - 4, 1993, s). We analyzed the ASCA lightcurve binned into 128 s bins for two SIS and two GIS instruments separately, in the entire energy band. As an example, we show the GIS-2 lightcurve in Figure 1.

The source is clearly variable in both energy bands. The rms amplitude in ASCA and ROSAT bands are given in Table 2. Such values are comparable to those measured in X–rays in other AGN, e.g. 16% in MCG–6-30-15 on timescales shorter than s (Nowak & Chiang 2000). The count rate in ASCA is dominated by 1 - 2 keV energy band, where both the contribution of the soft X–ray excess and hard X–ray power law are important. We therefore compared the rms value derived above with the rms value measured from the light curve for photons above 2 keV. We used only the data from GIS instruments as those data are more reliable for time-series analysis than SIS data for PG 1211+143. This is because the PG 1211+143 ASCA observation was conducted in a 4-CCD mode of the SIS instrument, and the source image fell close to the gap between the CCD chips. Since the satellite attitude can change somewhat during the observation, some unknown fraction of photons may fall in the space between the chips, resulting in an apparent but erroneous variability. Both GIS2 light curves (whole energy band, and above 2 keV) were rebinned into 512 s bins to increase statistics; the two observations yield rms values of 0.095 and 0.171, respectively. This suggests that the observed variations at the time scales of minutes-hours are predominantly due to the hard X–ray power law. This is confirmed by the fact that rms value measured in the ROSAT band is much smaller during the 40 ksec observation than in the ASCA data.
The data from ASCA and ROSAT satellites are exactly simultaneous; nonetheless, the presence of gaps due to the Earth occultation of the source makes an attempt to use the Fourier analysis rather difficult, although there are methods which allow to overcome this problem for high quality observations (e.g. Done et al. 1992a). However, even the available ASCA data are not of sufficient quality to perform this kind of analysis. Therefore, here we adopt a complementary method based on a nonlinear prediction, which is described in Czerny & Lehto (1997). We analyzed the light curve binned into 128 s bins for two SIS and two GIS instruments separately, in the entire energy band. Such analysis reveals that the shape of the power density spectrum (hereafter PDS) is basically described as a power law, with the slope 1.5. Errors in determination of those values are substantial, and systematic errors dominate, since the existence of the signal in the data is marginal (the correlation coefficient itself is 0.62 and 0.67, i.e. below 0.8, which would be necessary for reliable results).
Such a value of the PDS slope is typical for Seyfert galaxies at high frequencies. Yaqoob (1997) obtained the high frequency slope of MCG–6-30-15 of 1.4, Edelson & Nandra (1999) determined the slope to be 1.74 in NGC 3516 at frequencies above Hz, and Nowak & Chiang (2000) as well as Chiang et al. (2000) give the slope of 1.0 at intermediate frequencies and a slope of 2.0 at high frequencies in MCG–6-30-15 and NGC 5548, respectively.

We conclude that the variability properties of PG1211+143 are rather typical of a Seyfert galaxy. Unfortunately, neither quasars nor Narrow Line Seyfert 1 galaxies were studied with equal accuracy as normal Seyfert 1 galaxies, so it is not known whether there are any systematic differences in variability apart from scaling with mass (e.g. Leighly 1999; Piasecki et al. 2000). Results for PG1211+143 may indicate that the variability pattern is universal.
| Timescale | F(0.2 - 2)a | rms | F(2 - 10)a | rms |
|---|---|---|---|---|
| 17.9 | 0 | |||
| 3.96 | 0.09 | |||
| 18.2 | 0.06 | |||
| 23.7 | 0.25 | |||
| 36.5 | 0.62 | 7.44 | 0.30 | |
| 8.12 | 0.34 |
3.1.2 Trends of long-term variability in the X–ray band
Available archival data for PG1211+143 include six ROSAT pointings as well as historical observations from EINSTEIN, EXOSAT, GINGA, and ASCA; with those, we can also study the long time variability patterns of the source. The ROSAT observations cover a period of 1.5 years, allowing for a reliable measurement with the same instrument. We determine the observed fluxes in 0.2 - 2 keV band assuming a simple spectral model of a broken power law, with the second (hard X–ray) power law photon index fixed at 2.0 and the Galactic absorption fixed at the assumed value as given above. The ROSAT sequences and obtained on the same day were both fitted separately and combined (see Table 3). Since the errors in separate fits are large, we use only the combined set in further analysis. All flux measurements are summarized in Table 1.
The variability during the period of ROSAT observations is moderate, roughly by a factor 2. More precisely, the rms value measured on the timescale of s is only 0.25, which is not much higher than the rms variability on short time scales, within a single ASCA data set.
However, at the timescales of years the trend reverses, and the soft X–ray variability amplitude becomes higher than the hard X–ray variability on the same time scale. Analyzing the entire period of twenty years of observations, we measure the rms in 0.2 - 2 keV band which is higher than in 2 - 10 keV band (see Table 2). It is consistent with the trends shown by the Big Blue Bump in other AGN (e.g. Clavel et al. 1992 for NGC 5548 and Clavel, Wamsteker & Glass 1989 for Fairall 9).
The most dramatic change happened during the end of 1985/beginning of 1986 but this period is covered by only 3 EXOSAT observations (see Figure 3). Large changes in the soft X–ray emission are accompanied by the changes in the hard X–ray flux but not with comparable amplitude (see Figure 4).
Since the analysis of ASCA data allows us to estimate the slope of the PDS at high frequencies, we can reconstruct the total PDS from the values of rms on time scales of s and s. We assume the slope of 1.5 at high frequencies and a slope 0.0 below certain frequency . Using the integral conditions connecting the PDS and rms at a given frequency (see e.g. Czerny, Schwarzenberg-Czerny, & Loska 1999) we obtain the flattening frequency Hz, corresponding to a timescale of s. This is again comparable to the results for most Seyfert galaxies: the flat part of the PDS starts at timescales s for MCG–6-30-15 (Nowak & Chiang 2000), s for NGC 5548 (Chiang et al. 2000) and s for NGC 3516 (Edelson & Nandra 1999).


3.1.3 Black hole mass determination from variability
X–ray variability time scales have been successfully used to estimate the mass of the central black hole in active galaxies (e.g. Barr & Mushotzky 1986; Wandel & Mushotzky 1986), although a more robust method is the measurement of features in the PDS (see, e.g., Edelson & Nandra 1999). Convenient and powerful method based on the normalization of the high frequency tail of the power density spectrum was recently developed by Hayashida et al. (1998) and Hayashida (2000). Here we use a modified version of this method (Piasecki et al. 2000) which is based on comparison of the shape of the PDS with independent mass determination for the Seyfert 1 NGC 5548, an AGN; for the purpose of the mass estimate, this is likely to be more appropriate than scaling the normalization of Cyg X-1, an accreting binary system, used in Hayashida et al. 1998. The data discussed in previous section are not of sufficient quality to perform Fourier analysis. However, having the rms determined for a few time scales, we can reconstruct the power density spectrum assuming its shape in advance and using the integral connection between the power density spectrum and rms (see e.g. Czerny et al. 1999).
Here we assume that the PDS is flat below certain frequency and has a slope 1.5 above it, as determined in Section 3.1.1. As data points for this method, we use the GIS rms measurement for the s time scale and multi-instrument measurements on the s time scales. Extension of the measurements afforded by the RXTE observations only confirms that the break frequency is at timescales below s; if this timescale is above s, the rms would saturate. With this, we determine the break frequency to be at Hz, corresponding to timescales of s. The error on this value is large, since the uncertainty of the GIS rms measurement is already a factor 5.
This simple approach gives the value of the black hole mass log = 7.0 0.7 [], if the error in determination of the rms in GIS data (0.3) is taken into account. The mass of PG1211+143 is thus definitely rather small for a quasar, and more typical for Seyfert galaxies. High luminosity of the object has to be related to a relatively high accretion rate, close to the Eddington value. Small mass is consistent with the measurements of Kaspi et al. (2000) based on the properties of the Broad Line Region: , .
| Data | Flux(0.2 - 2)a | |||||
|---|---|---|---|---|---|---|
| a | 3.45 | 3.09 | 1.83 | 2.0 | 39.0/36 | 16.13 |
| b | 3.46 | 3.33 | 2.0b | 2.0 | 39.6/36 | 21.94 |
| c | 3.36 | 3.22 | 2.0 | 2.0 | 30.3/36 | 30.61 |
| d | 3.33 | 3.17 | 1.41 | 2.0 | 48.2/36 | 34.25 |
| cd | 3.20 | 3.11 | 1.67 | 2.0 | 48.5/36 | 30.92 |
| e | 3.65 | 3.38 | 2.0 | 2.0 | 53.2/36 | 20.53 |
| f | 3.50 | 3.18 | 1.78 | 2.0 | 62.3/36 | 18.99 |
| Model | Par1a | Par2b | Par3c | Par4d | Par5e | |
|---|---|---|---|---|---|---|
| A bknpower | 3.54 | 3.25 | 2.0 | 306/192 | ||
| B power | 3.53 | 3.25 | 306/191 | |||
| C bbody+power | 1.31 | 0.107 | 2.0 | 331/191 | ||
| D comptt | 2.83 | 0.39 | 10.4 | 294/191 | ||
| E comptt+power | 2.83 | 0.24 | 2.0 | 14.6 | 290/190 |
3.1.4 Spectral variability in the soft X–ray band


While the overall X–ray spectral variability as discussed above can be interpreted as a relative change of the intensity of the soft vs. the hard component, we also aim to determine if the soft component alone of the total spectrum of PG1211+143 has a variable shape. To this end, we fit the ROSAT data with a spectral model consisting of a cold absorber and a broken power law. The results are shown in Table 3. We also searched for the presence of an ionized absorber in this source by adding an absori XSPEC model in the case of the data set , which shows the worst . The fit was only marginally improved (, with 34 d.o.f. instead of 36) and the best fit value of the column of the ionized gas was cm-2 (between 1.5 and 13.0), with a temperature K and , where both and are only weakly constrained.
The data sets clearly show the variability of the flux of the soft component, as discussed in the previous section. Those variations, however, are not accompanied by significant changes in the spectral shape. There is a slight trend in the variations of the model value of with the total flux. However, no such trend is visible in the photon index. Formal analysis of the relation shows that the two parameters are best represented by a linear fit shown in Fig. 5 but a constant line representation is also acceptable (, for 6 d.o.f.) since the errors in determination of are very large (see Table 3). Similar analysis of the trend confirms the visual impression that the correlation between the two quantities is insignificant - and a constant line fit gives ( for 6 d.o.f.). With this, we conclude that the shape of the soft X–ray component does not vary, within the accuracy of the available data.
3.1.5 Optical/UV variability
PG1211+143 was extensively monitored in the optical band in the period 1966 - 1982, but no variability was found within the accuracy of observations (Barbieri & Romano 1984). Bechtold et al. (1987) found the UV flux from IUE measurements in 1981 and 1982 that was systematically lower than the trend suggested by the optical data, although with a similar slope. Wit this, they grey-shifted the UV data by +0.27 in logarithmic scale to match the the optical data. More recent HST observations (Dobrzycki, private communication) give exactly the same UV flux as the grey-shifted value of Bechtold et al. (1987) (-25.68 of Dobrzycki at 1387 Å vs. -25.69 of Bechtold at 1370-1424 Å in the same logarithmic units), making it difficult to distinguish the true variability from an instrumental effect. The question was finally settled by the monitoring performed over a 7 1/2 year time span by Kaspi et al. (2000). New optical data clearly showed the variability by a factor of two, and the normalized variability amplitude at 5100 Å was determined to be 16.2%.
3.2 Spectral fitting of the broad-band data
Here, we perform spectral fits using simple phenomenological models as well as more realistic, physical models to individual data sets, and then make an attempt to fit the broad-band data simultaneously. We note that despite the changes in the normalization of each component, the shape of each spectral component varies very weakly with time. With this, we attempt to describe this shape more accurately by using the combined data for each component. We assume all model parameters are equal in all data sets apart from normalization.
3.2.1 ROSAT data
Firstly, we analyze the combined ROSAT PSPC data, which we fit simultaneously using the same spectral model with variable normalization. We fit the following phenomenological models: broken power law with a variable break energy but with fixed hard photon index of 2.0 (model A); a single power law (model B); and black body with an underlying power law of photon index 2.0 (model C). We also fit more physical models, namely: thermal Comptonization model (comptt) of Titarchuk (1994) parameterized by the soft photon temperature, hot plasma temperature and its optical depth (model D). The best fitting results are presented in Table 4.
The last model clearly provides the best description of all the ROSAT data, although the is still quite high. The soft photon temperature has only an upper limit of 0.034 keV, or K. Such temperature is consistent with the effective temperature of a standard accretion disk around a black hole with the mass inferred by us above. The hot plasma temperature is relatively low, keV or K, much lower than the plasma responsible for the formation of the hard X–ray emission, and the optical depth of the plasma is very high, . The additional power law tail added in the model does not improve this fit substantially, since the ROSAT data cannot constrain the spectral slope in hard X–rays.
We also tried to improve the quality of fits to the spectrum by including the in the model the OVIII emission line. The model parameters (model E in table 4) remained basically unchanged and the line energy was fitted to 653 eV. However, the fit was not improved (=287/189), and the line equivalent width could not be constrained ( eV).
3.2.2 Combined ROSAT/ASCA data - model without reflection
We apply our best model inferred above to ASCA/ROSAT data, which include all ROSAT pointings; in the fits we use data from all four ASCA detectors, as described previously. We supplement the comptt component with an underlying hard X–ray power law component characterized by its photon index, and assume fixed Galactic absorption with cm-2. The results are given in Table 5, and the spectra are displayed in Figure 7.

The fit to the data in the entire ROSAT/ASCA energy band is acceptable, and the Comptonizing plasma parameters are only slightly modified such that the Comptonizning plasma temperature is now lower, and the optical depth increased by a factor of 2. However, the basic picture remains qualitatively unchanged. The hard X–ray index is close to typical values for Seyfert galaxies and somewhat smaller than typically measured in quasars. In this fit the reflection component was neglected.
The results for the combined ROSAT/ASCA data differ slightly from the results obtained on the basis of the ASCA data alone by Vaughan et al. (1999). The model used by Vaughan et al. is much simpler (power law + black body). Nevertheless, it is clear that the slope of the power law in our fit is flatter than in theirs (1.88 versus 2.07) and the soft X–ray excess is relatively stronger - the ratio of the luminosity of the soft X–ray excess to that of the hard power law in the 0.6 - 10 keV ASCA band is 0.28 in our fits and 0.17 in theirs. This difference is probably caused by our inclusion of the ROSAT data and can be attributed to residual calibration uncertainties between ROSAT PSPC and ASCA, resulting in different spectral slopes (see Iwasawa et al. 1999, describing the analysis of nearly-simultaneous ROSAT PSPC and ASCA data for NGC 5548).
| 1.18 |
Note. — The model consists of the Comptonized black body, power law and Galactic absorption (fixed value).
3.2.3 ASCA data - model with reflection
The spectral fitting of the ASCA data alone were presented by Vaughan et al. (1999) for the case of a simple model consisting of a power law, a black body and a Gaussian modeling the iron line. While the description of the soft X–ray excess with a simple black body component is justified in the ASCA data - these data are not sensitive to the shape of the soft excess - the presence of X–ray reflection in the data was not adequately studied by these authors, although the detection of the iron line in the ASCA data (Yaqoob et al. 1994; Vaughan et al. 1999) clearly shows its importance.
Current models for the structure of AGN interpret the presence of the iron line resulting from the irradiation of the accretion disk surface by hard X–ray emission. Such a fluorescent line is accompanied by the presence of a reflection component which is not an independent spectral feature (see, e.g., George & Fabian 1991). Therefore, we considered the properties of the entire reflection component, i.e. reflection hump plus the iron line (Życki, Done, & Smith 1997; 1998). The reprocessed spectrum is parameterized by the ionization parameter (Done et al. 1992b) and the reflection amplitude , where is the solid angle subtended by the reprocessor as viewed from the X–ray source. We applied two versions of this model: one that does not contain the effect of relativistic smearing and another that includes this effect. The second model formally contains additional free parameters, but some of these parameters of the model were always held fixed. In our case, the power law index of the radial distribution of the incident flux was fixed at -3.0, the entire disk surface was assumed to be a reflector (i.e. , , where ), and the inclination angle was assumed to be . The effect of these studies is shown in Table 6.
Formal minimum is for the relativistically smeared neutral reflection, but the normalization of the reflection component is surprisingly high. The assumption about the model adopted for the soft X–ray excess was not essential - fitting the comptt model instead of a black body led to the same values of relativistic reflection. If the amount of reflection is fixed at 1.0 the reflection is possibly ionized () but is not well constrained. If the reflection is assumed to be neutral, the amplitude of reflection is high (). The quality of the fits is the same as before, and the for the second option is lower by 3.0.
| Refl | |||||
|---|---|---|---|---|---|
| non relat | 2.03 0.05 | 101 0.12 | - | - | 442.4/448 |
| non relat | 2.15 0.07 | 93 0.14 | 0 | 431.1/449 | |
| non relat | 2.11 0.07 | 95 0.14 | 500 | 436.4/4 49 | |
| relat | 2.18 0.08 | 91 0.15 | 1.0 | 429.2/ 449 | |
| relat | 2.28 0.07 | 85 0.14 | 0 | 425.1/449 |
Note. — The model consists of black body, power law, Galactic absorption (fixed value) and reflection component with an iron line.
3.2.4 RXTE data - reflection component
In order to put better constraints on the reflection parameters, we used the RXTE data, which nominally extend up to keV. While PG1211+143 in its flux state, as observed with the RXTE, is a relatively faint source to be studied in great detail by the RXTE’s PCA, a non-imaging instrument, the data still put some constraints on the crucial 8 - 20 keV band where the Compton reflection is important. We adopted the composite model consisting of a primary soft component (described as a Comptonized black body), power law continuum, and the Compton – reflected spectrum with the iron line included (Życki, Done & Smith 1997; 1998). The reprocessed spectrum is parameterized by , , as above. The outer disk radius, as before, was fixed at and the power law index describing the incident flux as a function of radius was fixed again at the value -3.0. However, the inclination angle and the inner radius of the reflecting disk surface were now allowed to vary. We only studied the relativistically smeared model since it is the most physical one. The iron line energy, again, is not a free parameter, but it depends on the ionization state of the reflecting medium. Its profile is connected with the assumed geometrical parameters: inner radius of accretion disc and viewing angle.

The resulting best fit parameters are given in Table 7 and presented in Figure 8. New results did not differ significantly from the ROSAT/ASCA results regarding the soft part of the spectrum, although the optical depth of the Comptonizning medium dropped somewhat, and the hard X–ray power law became softer. However, they provide an interesting insight into the geometry. The amplitude of reflection is consistent with 1.0, and the reflecting area extends down to the marginally stable orbit which means that the disk is probably not disrupted. However, its surface (at least in the inner parts dominating the reflection) is considerably ionized (), and the neutral reflection is excluded at a confidence level. For such a case, the resulting iron line energy corresponds to the domination of Fe XXII ions and its rest frame energy is keV, while the line equivalent width is eV. This supports the results of Yaqoob et al. (1994), who found a marginal evidence for an ionized iron line fitting the ASCA data. The inclination angle of the disk is low, i.e. we see the disk essentially face on.
| 1.04 |
Note. — The model consists of the Comptonized black body, power law, Galactic absorption (fixed value) and reflection component with an iron line.
3.2.5 Optical/UV/X–ray data
Finally, we include the optical/UV data into our modeling. For that purpose, we add a new model component, which essentially has a form of standard accretion disk of Shakura & Sunyaev (1973) around a non-rotating black hole. We assume that the disk, whether it is or it is not covered by the ionized skin, radiates locally as a black body. It is certainly a simplifying assumption (see e.g. Merloni, Fabian & Ross 2000) but more accurate models critically depend on the assumed details of the disk vertical structure (e.g. Nayakshin, Kazanas, & Kallman 2000; Madej & Różańska 2000b). Such assumptions are beyond the scope of the present paper.
Fits of the reflected component suggest that the disk extends down to the marginally stable orbit. However, the reflection component indicates a highly ionized hot disk surface, and thus we assume that the emission of the standard cold disk is only detectable from radii larger than certain . The gravitational energy dissipated above is directly re-emitted by the disk, while the energy dissipated below has to provide the energy source for hard X–ray emission and Comptonizing medium.
The disk parameters are therefore: the black hole mass , the mass accretion rate , and . We assume a face-on view of the accretion disk, and the distance to the source calculated assuming km s-1Mpc-1.
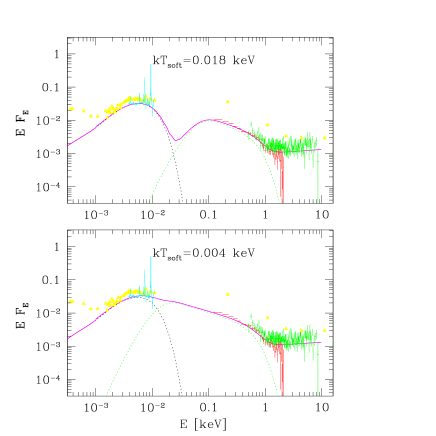
In the upper panel of the Figure 9 we plot the broad band spectrum of PG1211+143, constructed for the case of the maximum value of temperature of the seed photons undergoing Comptonization. The solid line marks the sum of the cold accretion disc spectrum and the model fitted to the X–ray data that consists of the Comptonized black body (dashed line), power law function and Galactic absorption (which is neglected in the plot).
In this case there is a clear gap between the UV and soft X–ray band, which would be seen as a local minimum in the continuum around keV. The bolometric luminosity measured between 10 000 Å and 100 keV (assuming an extrapolation of the measured hard X–ray power law) is erg s-1. The mass of the black hole is , the accretion rate is 0.4 yr-1, and . ratio in this solution is 0.05. About 50 % of the energy is dissipated in the black body component of the disk.
In the lower panel of Figure 9 we show the broad band spectrum determined under the assumption that cold disk itself provides the seed photons for Comptonization, i.e. the soft photon temperature is given by the effective temperature of the inner disk. Such a spectrum forms a continuous Big Blue Bump extending from the optical/UV to soft X–ray band. The bolometric luminosity of the source is in this case higher, erg s-1. The mass of the black hole is , the accretion rate is 0.54 yr-1, and . ratio in this solution is equal to 0.10. About 30 % of the energy is directly emitted by a black body outer disk, while 60 % is in the Comptonized component and % in the hard X–ray power law.
Both fits presented above reproduce the broad band spectral data well. We note that all intermediate solutions are also possible and at a level of pure data analysis, we cannot reject any of the above possibilities. However, a composite spectrum of quasars given by Laor et al. (1997) and the broad band spectrum of RE J1034+396 (e.g. Puchnarewicz et al. 2000) show clearly the existence of a single broad Big Blue Bump extending from optical/UV to soft X–ray band. Therefore using the analogy with these data we would favor our second solution.
The mass of the central black hole determined from the spectral analysis is somewhat higher than the value determined from the variability analysis (see Sect. 3.1.3). However, all quoted values are rather small for a quasar and comparable to the masses of the central black holes in Seyfert 1 galaxies such as NGC 5548, despite significantly higher bolometric luminosity.
4 Discussion

4.1 Determination of the black hole mass
The mass and luminosity estimates presented in this paper and those available in the literature render PG1211+143 as a relatively low-luminosity, low-mass object. Quasars constituting the sample of Laor et al. (1997) and Zhen et al. (1997) have black hole masses on average about but they have also higher luminosities, about erg s-1. An accurate measurement, however, is quite difficult to obtain. Our method based on the X–ray variability in the form of PDS measurement (see Sect. 3.1.3) gives , while the spectral fit indicates . We did not give the formal error of this second measurement since the systematic error certainly dominates any statistical error involved. Nonetheless, the error in the value of the mass determined from the spectral fitting can be roughly estimated under the assumption that the outer part of the flow is well described by a standard Keplerian disk. The fit is based on two relationships. The first one is the asymptotic shape of the disk emission in optical band
| (1) |
where is the inclination angle of the disk, is the adopted value of the Hubble constant and is the spectral correction given by the color temperature to the effective temperature ratio. The second constraint comes from the bolometric luminosity of the system
| (2) |
where is the efficiency of accretion. In our fits we adopted km s-1 Mpc-1, , and . However, if those values in reality are different from the assumed ones, the derived mass will scale as
| (3) |
This means that the departure from a black body approximation and slight inclination of the system will tend to increase the mass, although not considerably. The color to effective temperature ratio was determined to be (Shimura & Takahara 1995; Sobczak et al. 1999). Merloni, Fabian, & Ross (2000) give even larger values for Galactic sources, but in the case of AGN, efficient bound-free transitions in heavy elements reduce significantly (Różańska 2000, private communication). Therefore the upper limit for seems to be about 1.7, and the most probable inclination is , giving together an increase in the derived mass by a factor of 3. On the other hand, if there is a strong outflow close to the black hole, it will effectively decrease the standard efficiency of accretion, thus decreasing the mass. Strong outflow may give a factor of two, if it is comparable energetically to the outflows in radio-loud objects. On the grounds of this analysis, we can estimate an error in our determination from the spectral analysis as . The lower limit is still not consistent within a formal error with the determination based on variability, but in that case it is difficult to estimate the possible systematic error of the method. As for the determination of Kaspi et al. (2000), the formal errors are small: , but recent analysis of the systematic errors of methods based on BLR properties indicates a possible factor of three error in both directions, due to technical problems with sampling as well as a possible (and quite probable) flattening of the BLR (Krolik 2000).
All this implies that taking the systematic errors into account, all measurements are roughly consistent with each other, even though they are highly inaccurate. We notice, however, that if we allowed for a maximally rotating black hole as a central object, our mass based on the spectral fits would be higher by a factor of 7. This result, however, would be rather difficult to reconcile with other measurements.
4.2 Luminosity state
PG1211+143 is both a quasar, and a Narrow Line Seyfert 1 galaxy. Temporal and spectral analysis presented in Section 3 show that the mass of the central black hole is rather low () for a source of such optical/X–ray bolometric luminosity ( erg s-1). In a sample of Kaspi et al. (2000) it is on the border between normal Seyfert galaxies, NLS1 and quasars, having mass typical for a Seyfert1 but narrow line and larger luminosity than normal Seyferts. An interesting comparison can be made with Fairall 9 galaxy having broad : when PG1211+143 is faint and Fairall 9 is exceptionally bright (Clavel, Wamsteker & Glass 1989) their luminosities are nearly equal. For those cases, the luminosity in Eddington units of PG 1211+143 remains only marginally larger than for Fairall 9 (we adopted the black hole mass of Firall 9 to be twice that of PG1211+143, after Kaspi et al. 2000).
The exact value of is not determined accurately since it depends on the black hole mass and bolometric luminosity determination. Our ratio determined from spectral fits () is somewhat lower than the value of 0.29 given by Kaspi et al. (2000) due to larger black hole mass and lower bolometric luminosity than resulted from BLR study and the use of monochromatic luminosity at 5100 Å. The source is strongly variable and our fits (as well as results of Kaspi et al. 2000) are mostly representative for a relatively faint state.
This result supports the view expressed by many authors (e.g. Pounds et al. 1995; Pounds & Vaughan 2000) that Narrow Line Seyfert 1 galaxies are objects accreting at a relatively high ratio. The analysis of the Compton reflection implies that the inclination to the accretion disk surrounding the nucleus is low, which is contrary to the scenario where NLS1 galaxies are viewed at a high inclination and their variability is caused by obscuration events (Brandt & Gallagher 2000; see also Boller 2000).
Weak hard X–ray producing corona (as compared to the large luminosity of the Blue Bump) and large ratio are consistent with the prediction of the two-temperature corona model (Janiuk & Czerny 2000), and the relatively low photon index even in this source () suggests that models with strong advection cannot reproduce the observed spectrum well (Janiuk, Życki, & Czerny 2000). However, a non-accreting magnetic corona model, perhaps including some clumpiness, may well be viable, as argued by Poutanen & Fabian (1999).
4.3 Reflecting and Comptonizing medium
Our spectral analysis requires the existence of a number of various plasma zones: (1) very hot plasma, responsible for the hard X–ray emission, (2) moderately hot, moderately dense plasma responsible for Comptonization, (3) moderately hot plasma responsible for reflection and (4) a cold, dense disk. It is natural to pose the question whether the components (2) and (3) are actually the same medium but parameterized differently in the spectral fits.
Medium (2) has the temperature keV, or K, and a large optical depth, . Medium (3) has the ionization parameter . Temperatures intermediate between the black body temperature and the Inverse Compton temperature are difficult to achieve by radiatively heated plasma, since there is a rapid transition between the two solutions (Krolik, McKee & Tarter 1981). This transition happens at (see, e.g., Życki & Czerny 1994), and the relationship between the two ionization parameters is . Plasma in zones (2) and (3) should be in such a transition state. Assuming and from plasma zone (3) we obtain the temperature consistent with the temperature of plasma zone (2). This would imply that the same medium which Comptonizes the disk photons coming from below also reflects the hard X–ray photons illuminating it from above.
Such interpretation clearly simplifies the geometry of the flow. The accreting stream consists simply of the outer black body disk and an inner disk which develops very optically thick (), warm skin (K). A small fraction of energy is released in the form of hard X–ray emission above this skin. A possible schematic view of the flow is shown in Figure 10.
Similar values of the optical depth and the temperature of the “warm” plasma were derived for NGC 5548 by Magdziarz et al. (1998). However, in this source the magnitude of reflection was lower and it was not possible to locate geometrically the Comptonizing medium. Magdziarz et al. (1998) actually suggested that the radial transition zone from a classical disk to an inner ADAF-like flow is the most probable location. Another example of the presence of the warm skin was inferred from the XMM observations of PKS 0558-504 (O’Brien et al. 2000). Interestingly, numerous examples of a Comptonizing medium that modifies the shape of the spectrum in soft X–ray band were inferred from data for Galactic sources: for those, even before the effects of Comptonization, this soft component extends to higher energies as compared with AGN due to the higher disk temperature, and therefore can be more easily observed. Examples include Nova Muscae 1991 (Życki et al. 1998), Cyg X-1 (Gierliński et al. 1999), GRS 1915+105 (Vilhu & Nevalainen 1998), GS 2000+25, XTE J1550-564, GRO J1655-40 (Życki et al., in preparation), and the problem has been discussed in a review of Życki (2000).
Our results seem to indicate that, at least in sources like PG1211+143, this warm medium forms a horizontal layer. Its optical depth is only , which is rather low in comparison to the total optical depth of the classical disk. Still, about 40 - 60% of the total gravitational energy dissipated by the flow is released in this zone, while the remaining is released in the body of the disk. Roughly 10% of energy is emitted in hard X–rays and thus presumably released in the hot corona. However, this quantity is difficult to estimate due to the unobserved high energy cutoff.
4.4 Formation of the warm skin
Application of the thermal instability of the irradiated hot plasma by Krolik et al. (1981) to the vertical structure of the disk clearly shows that a warm skin, or a corona at the Inverse Compton temperature, forms above the cold disk. However, the details of the sharp transition between the disk and the Inverse Compton – heated corona are not clear (e.g. Begelman, McKee, & Shields 1983; Różańska & Czerny 1996; 2000; Nayakshin, Kazanas, & Kallman 2000; Nayakshin 2000).
Current models imply that the optical depth of this transition zone of intermediate temperature is generally very low and the total optical depth of the heated skin is never large. Results of Nayakshin et al. (2000) and Życki & Różańska (2000) allow at most for even if the X–ray radiation is released in compact regions leading to an enhancement of the irradiation under a hot spot by as much as two orders of magnitude. This is simply related to the fact thatthe X–ray heating does not penetrate deeply enough to support the high temperature of the transition zone.
Since the Comptonized component contains a significant fraction of the bolometric luminosity ( %), much larger than the fraction contained in the hard X–ray part (up to %) the Comptonizing medium cannot be heated by hard X–rays. For this reason, the discrepancy between the results quoted above and the large optical depth determined from our fits is not surprising. The dissipation must occur within this zone and we can attempt to compare the required amount of heating with most popular parametric prescription for the viscous dissipation of gravitational energy.
The properties of the reflection and Comptonization by the warm skin allow us to estimate the number density and the temperature of this medium at the optical depth of . The temperature K results directly from the comptt fit to the data. The density can be determined from the ionization parameter of reflection , assuming that the typical radius under discussion is and the bolometric luminosity in hard X–ray band is erg s-1:
| (4) |
or equivalently, g cm-3. This medium is clearly Compton-cooled, since the efficiency of bremsstrahlung for such parameters, namely
| (5) |
is two orders of magnitude lower than efficiency of Comptonization, which is
| (6) |
where the value of was estimated from the total bolometric luminosity erg s-1 and the distance of .
This large amount of cooling has to be compensated by the heating. The most popular parameterization of the heating in accretion flow is the viscosity prescription introduced by Shakura & Sunyaev (1973). Two variants are most popular: and . In the first case the amount of heating (in the context of a Keplerian flow) is given by
| (7) |
where we approximated by ; the Keplerian angular velocity was estimated at for a black hole mass. In the second case
| (8) |
where the density and the temperature were taken from the previous estimates.
We see that the variant of heating is by two orders of magnitude too small to compensate for the cooling. However, the variant is of the right order of magnitude, provided the viscosity coefficient is large. It does not explain the physical mechanism behind the heating but clearly indicates that scaling is a good phenomenological description of the process.
4.5 Consequences of the heating
There are two major consequences of the scaling favored by our analysis for the dissipation: disk instability and surface temperature gradient.
The disk models are known to be unstable under such scaling if the radiation pressure dominates, as it is the case in disks in active galaxies (Pringle, Rees, & Pacholczyk 1973; Ligthman & Eardley 1974). The disk is supposed to display strong outbursts in timescales of years, with about two orders of magnitude difference between the low and high luminosity states, as it is suggested by direct scaling of computations of the time evolution of Galactic sources (e.g. Honma et al. 1991; Szuszkiewicz & Miller 1998; Janiuk et al. 2000).
The variations of the Big Blue Bump on these timescales are observed in active galaxies in general (see Sect. 3.1.2), and the maximum variability (peak on PDS diagram) has not been determined yet for the far UV and soft X–ray band. This may be because such a peak is possibly at even longer timescales than can be inferred from observations covering a span of only 20 years. Therefore, we cannot yet determine the viscosity parameter governing the timescales of outbursts. One aspect of the current data which may be in conflict with the above scenario is that the observed variations of the source luminosity do not appear as a fraction of a global outburst with the predicted large amplitude. There are, however, various effects which may lead to the difference between the modeled outbursts and the observed time behavior. The models studied so far did not include a warm skin as that discussed in Sect. 4.4. Moreover, any strong outflow is known to suppress the outburst amplitude, if the outflow is coupled to the temporary local accretion rate (Janiuk et al. 2000), and any irregularities in this outflow lead immediately to much more complex lightcurve than simple predictions would indicate (Nayakshin, Rappaport, & Melia 2000). In addition, if the viscosity parameter depends on the amount of the radiation pressure, the amplitude of the outburst can be reduced. Testing such scenarios is more promising in case of Galactic sources because of the shorter timescalesrequired.
Another aspect of the scenario that may present a conflict with observations is connected with the broadly discussed issue of the lack of Lyman edge in the observed spectra of AGN while the presence of such an edge is predicted by most models of accretion disk atmospheres (for a review, see Koratkar & Blaes 1999). Those studies, however, never included such a strong heating close to the surface as well as the accompanying Comptonization. Strong heating leads to a more isothermal atmosphere, as already argued by Laor & Netzer (1989), and Comptonization is also quite efficient in removing the edge, as stressed by Czerny & Zbyszewska (1991). Some of the recent papers already made a step towards reducing the predicted edge (Różańska et al. 1999; Madej & Różańska 2000a; Hubeny & Hubeny 1998) but most likely the issue cannot be fully resolved until heating is properly included in computations of the disk atmosphere.
4.6 Future observational tests
High resolution spectroscopy in soft X–ray band available now through Chandra and XMM data may provide an independent test of the physical conditions in the reflecting/Comptonizing warm skin. This region is not completely ionized so it is a source of intense emission lines, mostly of the hydrogen-like Ly lines from CNO as well as Si, Mg, S and Ne. The presence of such lines has been possibly detected in the MCG–6-30-15 spectrum taken with the XMM (Branduardi-Raymont et al. 2000).
Computations of the irradiated slab predict the existence of such lines (Ross, Fabian, & Young 1999). Dumont et al. (2000) performed the radiative transfer in an irradiated slab under constant pressure, with the spectral slope of the incident radiation and the high energy cut-off of 100 keV. In this case the equivalent width of the Ly CVI, NVII and OVIII lines were equal to 1.6 eV, 2.3 eV and 7.4 eV for the ionization parameter (at the surface) of 300, and 1.3 eV, 2.8 eV and 11.5 eV for . Those values are quite similar to the EW measured in the X–ray spectrum of MCG–6-30-15 (Branduardi-Raymont et al. 2000). However, since in those considerations the slab was only radiatively heated from the outside, the high temperature zone was relatively thin (Thompson depth of 0.1 and 0.3, correspondingly). The optical depth of the Comptonizing medium determined by the data was on the order of 10. With this, it is difficult to predict if the additional heating in the interior of the warm skin interior may change these results.
On the other hand, the theoretical computations performed for a constant density irradiated medium, with harder incident flux (, extending up to 280 keV) indicated much larger EW, of order of 50 eV for (Czerny & Dumont 1998) which suggests that EW of the soft X–ray lines is sensitive to the structure of the warm skin. Clearly, more detailed theoretical studies together with observational constraints on the line intensity and its profiles may help to resolve the problem of the formation of such warm skin. The models should include both the effect of Comptonization and kinematical/gravitational broadening of the line profiles, as both processes lead to development of red wings in emission lines, and may be difficult to differentiate.
5 Conclusions
The Narrow Line quasar PG1211+143 is considered to be a very good candidate to study the broad band emission and variability properties due to a rich sample of observational data available for this object. In this work, we considered the physical mechanisms which may be responsible for the optical, UV and X–ray emission and variability of this source, and we found that the following model can give a satisfactory explanation of the observations:
-
•
The central object powering the source is a supermassive black hole with a mass and the luminosity to Eddington luminosity ratio is in the range of 5 - 40 %. Despite large errors both quantities are consistent with the explanation of the phenomenon of Narrow Line Seyfert galaxies based on a relatively low mass of the black hole and a high accretion rate.
-
•
The emitted radiation originates in the cold accretion disk responsible for the optical/UV spectrum. Inner disk region develops a warm, optically thick skin, which produces the profound “soft excess” observed in the X–ray spectrum and is well modeled with a Comptonized black body emission. However, from the spectral analysis alone, it cannot be determined whether the source of seed photons for Comptonization is the cold accretion disk or a somewhat hotter plasma, and both explanations are possible.
-
•
The warm disk skin is also responsible for the reflection of hard X–rays, which are emitted in the accretion disk corona. The latter has the form of active flares rather than forming a continuous medium.
-
•
Both accretion disk and its warm skin are heated by the viscous dissipation process, which can be parameterized by prescription. This may lead to the source luminosity variations resulting from the presence of regions where the radiation pressure is dominant.
-
•
Measurements of the soft X–ray emission lines possible in the Chandra and XMM data and their comparison with theoretical models may help to test the warm skin structure.
Acknowledgments. We thank Piotr Życki and Asia Kuraszkiewicz for helpful discussions, and to Jill Bechtold, Adam Dobrzycki and their coauthors for supplying us with their HST spectrum of PG121+143 prior to publication. In the course of our research, we used data obtained through the HEASARC on-line service, provided by NASA/GSFC. This work was supported in part by grant 2P03D01519 of the Polish State Committee for Scientific Research. GM acknowledges support by NASA RXTE Observing Grant via the ADP program.
References
- (1) Arnaud K.A., 1996, ASP Conf. Series, vol. 101, p. 17
- (2) Barbieri C., Romano G., 1984, Acta Astr. 34, 117
- (3) Barr P., Mushotzky R.F., 1986, Nat., 320, 421
- (4) Bechtold J., Czerny B., Elvis M., Fabbiano G., Green R.F., 1987, ApJ, 314, 699
- (5) Bechtold J., Dobrzycki A., Wilden B., Morita M., Scott J., Dobrzycka D., Tran K.-V., Aldcroft T.L., 2000, to be submitted to ApJ.
- (6) Begelman M.C., McKee C.F., Shields G.A., 1983, ApJ, 271, 70
- (7) Boller T., 2000, NewAR, 44, 387
- (8) Brandt W.N., Boller S.C., 2000, NewAR, 44, 461
- (9) Branduardi-Raymont G., Sako M., Kahn S.M., Brinkman A.C., Kaastra J.S., Page M.J., 2000, A&A (in press; astro-ph/0011167)
- (10) Clavel J., et al., 1992, ApJ, 393, 113
- (11) Clavel J., Wamsteker W., Glass I.S., 1989, ApJ, 337, 236
- (12) Corbin M., Boroson T.A., 1996, ApJS, 107, 69
- (13) Czerny B., Lehto H., 1997, MNRAS, 285, 365
- (14) Czerny B., Dumont A.-M., 1998, A&A, 338, 386
- (15) Czerny B., Schwarzenberg-Czerny A., Loska Z., 1999, MNRAS, 303, 148
- (16) Czerny B., Zbyszewska M. 1991, 249, 634
- (17) Czerny B., Życki P.T., 1994, ApJ, 431, L5
- (18) Chiang J., et al., 2000, ApJ, 528, 292
- (19) Done C., Madejski G.M., Mushotzky R.F., Turner T.J., Koyama K., Kunieda H., 1992a, ApJ, 400, 138
- (20) Done C., Mulchaey J.S., Mushotzky R.F., Arnaud K.A., 1992b, ApJ, 395, 275
- (21) Dumont A.-M., Abrassart A., Collin S., 2000, A&A, 357, 823
- (22) Edelson R., Nandra K., 1999, ApJ, 514, 682
- (23) Elvis M., Wilkes B., Lockman F.J., 1989, AJ, 97, 777
- (24) Elvis M., Wilkes B., Giommi P., McDowell J., 1991, ApJ, 378, 537
- (25) Elvis M., Wilkes B., Tananbaum H. 1985, ApJ, 292, 357
- (26) Elvis M. Wilkes B., McDowell J.C., Green, R. F., Bechtold J., Willner S. P., Oey M. S., Polomski E., Cutri R., 1994, ApJS, 95, 1.
- (27) George I. M., Fabian A. C., 1991, MNRAS, 249, 352
- (28) Gierliński M., et al., 1999, MNRAS, 309, 496
- (29) Hayashida K., Miyamoto S., Kitamoto S., Negoro H., 1998, ApJ, 500, 642
- (30) Hayashida K., 2000, astro-ph/0005128
- (31) Honma F., Kato S., Matsumoto R., 1991, PASJ, 43, 147
- (32) Hubeny I., Hubeny V., 1998, ApJ, 505, 558
- (33) Iwasawa K., Fabian A.C., Nandra K., 1999, MNRAS, 307, 611
- (34) Janiuk A., Czerny B., 2000, New Astr., 5, 7
- (35) Janiuk A., Czerny B., Siemiginowska A., 2000, ApJL, 542, 33
- (36) Janiuk A., Życki P.T., Czerny B., 2000, MNRAS, 314, 364
- (37) Kaspi S., Smith P.S., Netzer H., Maoz D., Jannuzzi B.T., Giveon U., 2000, ApJ, 533, 631
- (38) Koratkar A., Blaes O., 1999, PASP, 111, 1
- (39) Krolik J.H., McKee C.F., Tarter C.B., 1981, ApJ, 249, 422
- (40) Laor A., Fiore F., Elvis M., Wilkes B., McDowell J.C., 1997, ApJ, 477, 93
- (41) Laor A., Netzer H., 1989, MNRAS, 238, 897
- (42) Lawson A.J., Turner M.J.L., 1997, MNRAS, 288, 920
- (43) Lightman A.P., Eardley D.M., 1974, ApJ, 187, L1
- (44) Leighly K., 1999, ApJS, 125, 317
- (45) Madej J., Różańska A., 2000a, A&A, 356, 654
- (46) Madej J., Różańska A., 2000b, A&A, in press
- (47) Magdziarz P., Blaes O.M., Zdziarski A.A., Johnson W.N., Smith D.A., 1998, MNRAS, 301, 179
- (48) Malkan M.A., 1983, ApJ, 268, 582
- (49) Marziani P., Sulentic J.W., Dultzin-Hacyan D., Calvani M., Moles M., 1996, ApJS, 104, 37
- (50) Merloni A., Fabian A.C., Ross R.R., 2000, MNRAS, 313, 193
- (51) Nayakshin S., 2000, ApJ, 534, 718
- (52) Nayakshin S., Kazanas D., Kallman T.R., 2000, ApJ, 537, 833
- (53) Nayakshin S., Rappaport S., Melia F, 2000, ApJ, 535, 798
- (54) Nowak M., Chiang J., 2000, ApJ, 531, L13
- (55) Piasecki M., Czerny B., Kuraszkiewicz J., Nikolajuk M., 2000, submitted to MNRAS
- (56) O’Brien P.T., et al., 2000, A&A, in press, (astro-ph/0010386)
- (57) Pounds K., Done ., Osborne J., 1995, MNRAS, 277, L5
- (58) Pounds K., Vaughan S., 2000, astro-ph/0005132
- (59) Poutanen J., Fabian A.C., 1999, MNRAS, 306, L31
- (60) Pringle J.E., Rees M.J., Pacholczyk A.G., 1873, A&A, 29, 179
- (61) Puchnarewicz E., Mason K.O., Siemiginowska A., Fruscione A., Comastri A., Fiore F., Cagnoni I., 2000, ApJ, in press (astro-ph/0011389)
- (62) Ross R.R., Fabian A.C., Young A.J., 1999, MNRAS, 306, 461
- (63) Różańska A., Czerny B., 1996, Acta Astr., 46, 233
- (64) Różańska, Czerny B., Życki P.T., Pojmański G., 1999, MNRAS, 305, 481
- (65) Różańska A., Czerny B., 2000, MNRAS, 316, 473
- (66) Saxton R.D., Turner M.J.L., Williams O.R., Stewart G.C., Ohashi T., Kii T., 1993, MNRAS, 262, 63
- (67) Shakura N.I., Sunyaev R.A., 1973, A&A, 24, 337
- (68) ShimuraT., Takahara F., 1995, ApJ, 445, 780
- (69) Sobczak G.J., McClintock J.E., Remillard R.A., Bailyn C.D., Orosz J.A., 1999, ApJ, 520, 776
- (70) Szuszkiewicz E., Miller J., 1998, MNRAS, 298, 888
- (71) Titarchuk L., 1994, ApJ, 434, 570
- (72) Ulrich M.-H., Maraschi L., Urry C.M., 1997, ARA&A, 35, 445
- (73) Vaughan S., Reeves J., Warwick R., Edelson R., 1999, MNRAS, 309, 113
- (74) Vilhu O., Nevalainen J., 1998, ApJ, 508, L85
- (75) Walter R., Fink H.H., 1993, A&A, 274, 105
- (76) Wandel A., Mushotzky, R.F., 1986, ApJ, 306, L61
- (77) Wilkes B., Kuraszkiewicz J., Green P.J., Mathur S., McDowell J.C., 1999, ApJ, 513, 76
- (78) Yaqoob T., Serlemitsos, P., Mushotzky, R., Madejski, G., Turner, T.J., Kunieda, H., 1994, PASJ, 46, L173
- (79) Yaqoob T., 1997, AAS, 190, 51.03
- (80) Yuan W., Brinkman W., Siebert J., Voges W., 1998, A&A, 330, 108
- (81) Zheng, W., Kriss, G.A. Telfer, R.C., Grimes, J.P., Davidsen, A.F., 1997, ApJ, 475, 469
- (82) Życki P.T., Czerny B., 1994, MNRAS, 266, 653
- (83) Życki P.T., 2000, in Proceedings of COSPAR confrence, Advances in Space Research, in press
- (84) Życki P.T., Done C., Smith D.A., 1997, ApJ, 488, L113
- (85) Życki P.T., Done C., Smith D.A., 1998, ApJ, 496, L25
- (86) Życki P.T., Różańska A., 2000, MNRAS (submitted)