86 GHz Very Long Baseline Polarimetry of 3C 273 and 3C 279
with the Coordinated Millimeter VLBI Array
Abstract
86 GHz Very Long Baseline Polarimetry probes magnetic field structures within the cores of Active Galactic Nuclei at higher angular resolutions and a spectral octave higher than previously achievable. Observations of 3C 273 and 3C 279 taken in April 2000 with the Coordinated Millimeter VLBI Array have resulted in the first total intensity (Stokes ) and linear polarization VLBI images reported of any source at 86 GHz. These results reveal the 86 GHz electric vector position angles within the jets of 3C 273 and 3C 279 to be orthogonal to each other, and the core of 3C 273 to be unpolarized. If this lack of polarization is due to Faraday depolarization alone, the dispersion in rotation measure is 90000 rad m-2 for the core of 3C 273.
1 Introduction
Magnetic fields trace the flows of relativistic plasma ejected from the cores of Active Galactic Nuclei (AGN) in the form of powerful jets. Ordering of the jet magnetic fields by shocks (e.g. Hughes, Aller, & Aller 1985, Marscher & Gear 1985) or shear (Wardle et al., 1994) occurs within a fraction of a parsec (pc) from the jets’ points of origin. Though synchrotron theory predicts sources may exhibit up to 75% fractional linear polarization () in the optically thin regime, this level of polarization has never been observed in AGN cores. It is likely that the modest observed in AGN cores at centimeter wavelengths results from disordered magnetic fields, depolarization, and high optical depths. 86 GHz (mm) Very Long Baseline Polarimetry (VLBP) should be sensitive to intrinsic field order and may reveal the first instances of magnetic field ordering mechanisms, for the effects of Faraday rotation () and depolarization are reduced at high frequencies.
2 Observations and Calibration
Images of 3C 273 and 3C 279 were produced from data taken with four antennas (Fort Davis, Los Alamos, Pie Town, Kitt Peak 12-m) during the Coordinated Millimeter VLBI Array (CMVA)111CMVA operations and correlation at Haystack are conducted under support from the National Science Foundation. program CA01 over 7 hours on 2000 April 17 (epoch 2000.30). The data were recorded at 86 GHz with a total bandwidth of 64 MHz. This four station subset of the complete CMVA run was correlated on the NRAO222The National Radio Astronomy Observatory is a facility of the National Science Foundation, operated under a cooperative agreement by Associated Universities, Inc. correlator as a certification test of the Haystack Mark IV correlator system. Approximately total integration were devoted to each source leading to a theoretical RMS noise of mJy beam-1. The complete, eight station, 24 hour CMVA run, providing full tracks on both 3C 273 and 3C 279 with a global array of mixed single- and dual-polarization antennas, will be correlated at Haystack later in 2001.
Calibration and hybrid imaging were done using the NRAO AIPS and Caltech DIFMAP packages. Total intensity is notated as , and linear polarization is represented by the complex quantity , where is the polarized intensity, and is the electric vector position angle (EVPA). Explanations of VLBP calibration and imaging may be found in Cotton (1993), Roberts, Wardle, & Brown (1994), and Attridge (1999a).
The calibration process for 86 GHz VLBI data must account for complexities not present in lower frequency data (Attridge, Greve, & Krichbaum, 1999b). For example, coherence times at 86 GHz are typically only seconds, severely limiting choice of solution interval in many AIPS tasks. Many antennas succumb to pointing problems at 86 GHz, primarily due to wind-loading. The impact of these problems escalates when considering that 86 GHz data is lower (by a factor of ) in SNR than 43 GHz data.
Of primary concern was calibration of the instrumental polarization (D-terms). Careful tests were performed to determine the veracity of the results. First, the sources were imaged with no D-term solution applied. Resulting images have scattered polarization throughout the fields of both 3C 273 and 3C 279. Next, the D-terms were calculated individually for each source using the AIPS task LPCAL, applied to the data, and then the data were imaged. The maps presented in this paper are derived from these individual applications of LPCAL. As a test of the LPCAL results, the D-terms for 3C 273 were then applied to 3C 279 and vice versa with no apparent change in the maps. The task PCAL was run on 3C 279333PCAL algorithms are restricted to very simple source structure, and therefore could not be applied to the extended structure of 3C 273. and the resulting D-terms were applied to both sources, again with no change in the maps.
For 3C 273, the D-terms range from , and for 3C 279, from , resulting in a typical value of . These ranges represent the same set of D-terms offset by a vector constant, arising from the special case of the four antennas having effectively the same parallactic angle coverage (Conway & Kronberg, 1969; Roberts et al., 1994).
3 Results
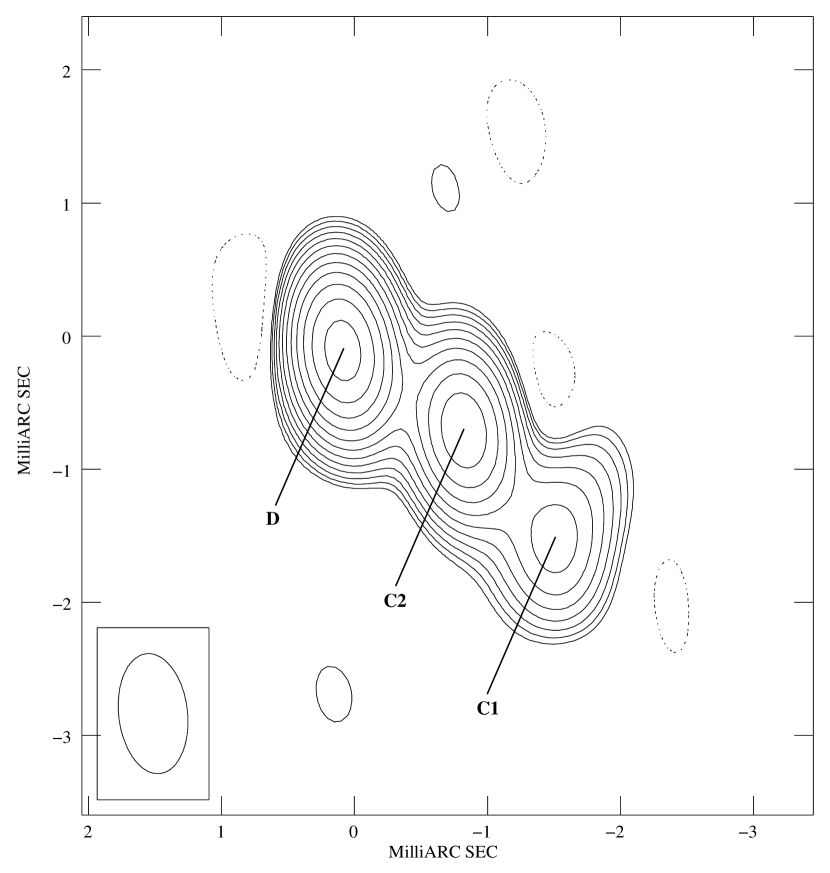
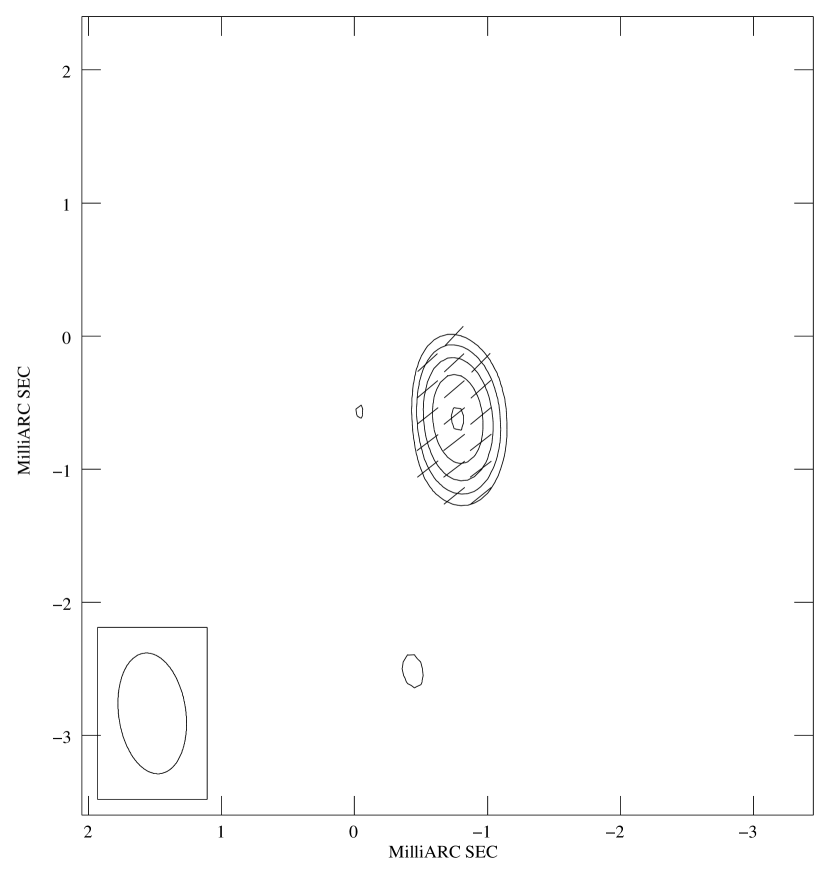
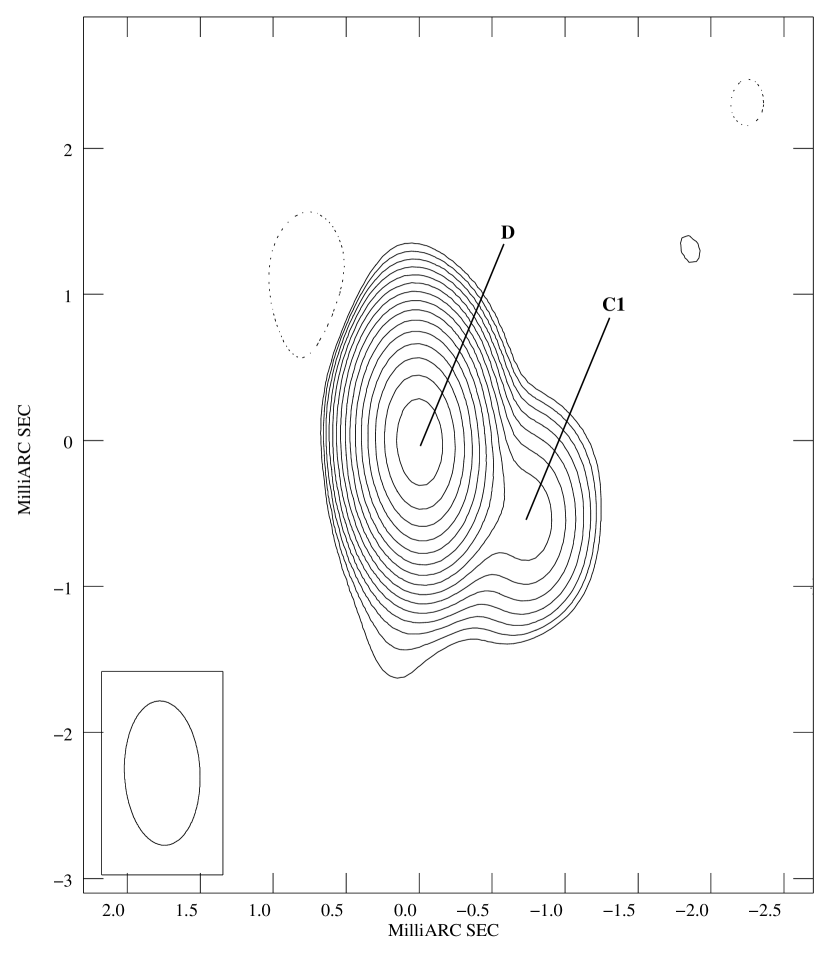
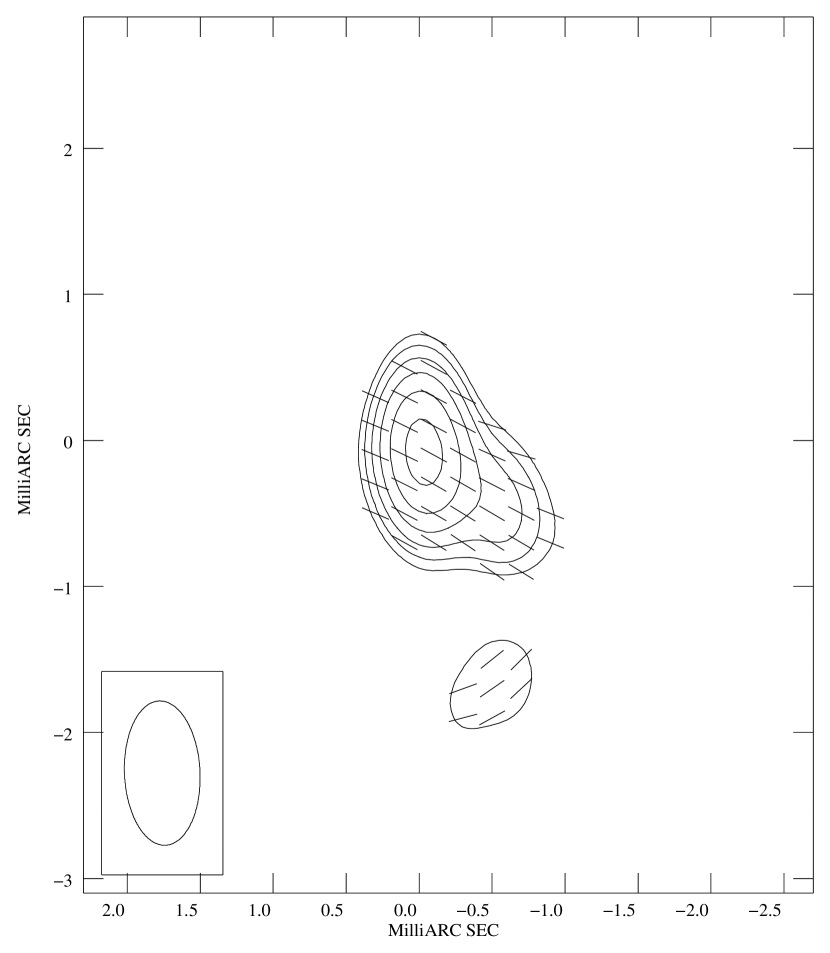
Naturally weighted images in and are presented in Figures 1 and 2. These images are the first 86 GHz VLBI Stokes and images presented for any source. Currently, there is no known calibrator by which to register absolute EVPAs at 86 GHz; therefore sticks in the images represent the orientation of the electric field vectors assigned an arbitrary instrumental position angle, rotated through an adopted 90∘ EVPA calibration constant as explained in §4.2. Note that the EVPAs of the two sources relative to each other are correctly registered.
The images presented in Figures 1 and 2 have dynamic ranges of 100:1, and the Fourier transforms of the clean components represented by the images result in the best matches to the data among many trials of hybrid mapping and self-calibration, down to time scales of thirty seconds in phase, and two minutes in amplitude. DIFMAP’s “modelfit” routine was used to fit individual components in , , and . Because and positions were restricted to the locations of the peaks, resultant values of do not necessarily represent the true maximum of a component. Model fits for both 3C 273 and 3C 279 are presented in Table 1.
3.1 3C 273
3C 273 (J1229+0203) is a low optical polarization quasar (LPQ) with (Strauss et al., 1992), corresponding to pc/mas.444 km s-1 Mpc-1 and are assumed in all calculations. A typical core-jet source, 3C 273 contains a bright component to the east which is resolved in the north-south direction, and a jet extending to the west-southwest. The image shown in Figure 1 displays linear polarization only in the jet component (C2) adjacent to the core (D); the core itself is unpolarized to a limit of . Model fits to the data (Table 1) show that C2 has .
Historically, at frequencies lower than 86 GHz 3C 273 displays very low levels of fractional core polarization with increasing levels further down the jet. 3C 273’s variable nature and the differing resolutions provided by images at other frequencies, make temporal and spatial comparisons of all but the core quite difficult. The most recent, published VLBI values of for 3C 273 are presented by Taylor (1998) and Lister & Smith (2000) (hereafter L&S). At 15 GHz (epoch 1997.07), 3C 273 displayed in the core (Taylor, 1998). At 22 GHz (epoch 1999.03), L&S found a maximum core polarization of ; 43 GHz results, also at epoch 1999.03, reveal a maximum core polarization of .
3.2 3C 279
3C 279 (J1256-0547) is a compact source with a jet extending to the west-southwest. It is a high optical polarization quasar (HPQ) with (Marziani et al., 1996), corresponding to pc/mas.44footnotemark: 4 In the image of Figure 2, both the core (D) and the jet component (C1) are linearly polarized. In fact, C1 is highly polarized, displaying , while the core displays (Table 1).
The 3C 279 results presented here are consistent with past high frequency VLBI observations of the source. Taylor (1998, 2000) found 15 GHz fractional polarization of in the core of 3C 279 at epoch 1997.07, and at epoch 1998.59 - an increase of 90%.5553C 279 experienced a significant outburst at 37 GHz (Wehrle et al., 2000) and 90 GHz in late-1997 (M. Tornikoski 2000, private communication), and at 15 GHz in mid-1998 (http://www.astro.lsa.umich.edu/obs/radiotel/umrao.h-tml). L&S found upper limits on the core polarizations to be 3.9% at 22 GHz, and 6.6% at 43 GHz; both at epoch 1999.03. Epoch 1997.58 VLBA observations at 43 GHz show in the core of 3C 279 (A. P. Marscher et al. 2001, in preparation).
4 Discussion
4.1 Proper Motion Extrapolation
Using an average proper motion of 1 mas/yr for 3C 273 as derived from six epochs of dual-frequency data by Homan et al. (2001), extrapolation of jet components from epoch 1999.03 (L&S) to the 86 GHz epoch of 2000.30 was performed. L&S’s component H evolves to a distance of 2.1 mas from the core, coincident with 86 GHz component C1. Two intermediate components from L&S, i and j, are located at 1.4 and 1.6 mas, respectively, from the core. These two components lie between components C1 and C2 of the 86 GHz data.
Similarly, a proper motion of 0.2 mas/yr, also from Homan et al. (2001), was used to extrapolate L&S’s epoch 1999.03 3C 279 jet components to epoch 2000.30. After extrapolation, L&S’s component F falls at a distance of 0.9 mas from the core, consistent with 86 GHz component C1. Component F/C1 reveals high levels of polarization at 22 GHz (), 43 GHz () and 86 GHz (). High levels of fractional polarization () are not unique, and have been seen in a number of sources; e.g. 32% in OJ 287 (Gabuzda & Gómez, 2001), 20% in BL Lacertae (Denn, Mutel, & Marscher, 2000), and 29% in 3C 454.3 (Cawthorne & Gabuzda, 1996). Note that the peak in 3C 279 is located 0.85 mas from the core; between the core and C1.
4.2 Electric Vector Position Angles
As previously stated, no absolute EVPA () calibration can yet be performed on the 86 GHz data. Nonetheless, the EVPAs of the two sources may be compared to each other, and to values measured at other frequencies.
If , then is the difference between the EVPAs of 3C 273 and 3C 279 at 86 GHz. Similarly, single dish data from the James Clerk Maxwell Telescope (JCMT) results in at 270 GHz, epoch 1995.98 (Nartallo et al., 1998), and at 350 GHz, epoch 2000.26 (J. A. Stevens 2001, private communication). Epoch 1999.03 VLBI observations at 43 GHz show (L&S). The 86 GHz results are thus consistent with values at adjacent frequencies. Comparing the values of 3C 273 and 3C 279 at 86 GHz with those at 43 GHz suggests an offset between the two frequencies of . This comparison is reasonable, as L&S’s 43 GHz data is closest in resolution to and is only one spectral octave off from the 86 GHz data. It would therefore be reasonable to assume that the proper EVPA calibration constant at 86 GHz is . This estimated 90∘ calibration constant has been applied to the images shown in Figures 1 and 2.
It is well known that the EVPAs of AGN jets are closely related to their jet position angles, (e.g. Cawthorne et al. 1993). VLBI observations at many frequencies generally show the EVPA of 3C 273 to be transverse () to the VLBI jet axis, and the EVPA of 3C 279 to be longitudinal () to the VLBI jet axis (e.g. 15 GHz: Homan & Wardle 1999; 22 and 43 GHz: L&S; 43 GHz: A. P. Marscher et al. 2001, in preparation). Aligning the EVPAs measured in single dish measurements at 270 GHz (Nartallo et al., 1998) and 350 GHz (J. A. Stevens 2001, private communication) with the VLBI jet position angle of a lower frequency produces the same results: 3C 273 displays and 3C 279 displays . The 86 GHz images presented in Figures 1 and 2 reveal 3C 273’s EVPA to be transverse to the jet direction, and 3C 273’s to be longitudinal to the jet direction, consistent with results at adjacent frequencies. This suggests that application of the estimated 90∘ EVPA calibration constant suggested above is appropriate.
4.3 Rotation Measures and Faraday Screens
Taylor (1998, 2000) and L&S derive absolute Faraday rotation measures (RMs) in excess of 1000 rad m-2 in the cores of many quasars, including 3C 273 and 3C 279. Beyond projected distances of parsecs from the core, RMs in the jets of quasars drop to rad m-2(Taylor, 1998). The presence of large RMs suggests that parsec-sized Faraday screens with organized magnetic fields will be found near the cores of quasars (L&S).
As Faraday rotation is , RMs are expected to diminish at high frequencies. The observations presented here challenge this expectation by showing the cores of 3C 273 and 3C 279 to have low levels of polarization even at 86 GHz. The core of 3C 273 is unpolarized in VLBP observations up through 43 GHz, and the addition of the 86 GHz results () show that this trend continues at higher frequencies. It is interesting to explore the case where depolarization of 3C 273’s core is attributed to Faraday depolarization alone. Assuming that is the standard deviation of a Gaussian distribution of many RMs over a finely spaced grid (Burn, 1966), and that of the jet represents a purely undepolarized state, must be 90000 rad m-2 for the core of 3C 273.
Alternatively, the magnetic field in the core of 3C 273 may be initially tangled, becoming ordered somewhere between the core (D) and the adjacent polarized jet component (C2). The degree of order of the magnetic field may be calculated assuming the magnetic field in the unshocked jet fluid contains a small-scale tangled component plus a uniform component aligned perpendicular to the line of sight. The resulting fraction of magnetic energy in the tangled component in 3C 273 is then (Burn, 1966; Wardle et al., 1994).
5 Conclusions
The CMVA results presented here validate 86 GHz VLBP as a practical and potent new tool to probe magnetic field properties of AGN cores. With only 86 GHz observations, it is impossible to distinguish between the depolarizing effects of a Faraday screen, and a tangled magnetic field. Future simultaneous, multi-frequency VLBP observations, including ones at 86 GHz, are crucial in testing various depolarization mechanisms in the cores of 3C 273 and 3C 279. With the addition of new 86 GHz antennas, particularly those that provide long baselines, resolutions much higher than those currently attainable at 43 GHz should be achieved. High resolution observations should set limits on the sizes of Faraday screens in both 3C 273 and 3C 279 by resolving the cores of these objects into smaller components, thereby testing the discussion of §4.3.
References
- Attridge (1999a) Attridge, J. M. 1999a, Ph.D. thesis, Brandeis Univ.
- Attridge, Greve, & Krichbaum (1999b) Attridge, J. M., Greve, A., & Krichbaum, T. P. 1999b, in 2nd Millimeter-VLBI Science Workshop, ed. A. Greve & T. P. Krichbaum (Grenoble: IRAM), 13
- Burn (1966) Burn, B. J. 1966, MNRAS, 133, 67
- Cawthorne & Gabuzda (1996) Cawthorne, T. V., & Gabuzda, D. C. 1996, MNRAS, 278, 861
- Cawthorne et al. (1993) Cawthorne, T. V., Wardle, J. F. C., Roberts, D. H., & Gabuzda, D. C. 1993, ApJ, 416, 519
- Conway & Kronberg (1969) Conway, R. G., & Kronberg, P. P. 1969, MNRAS, 142, 11
- Cotton (1993) Cotton, W. D. 1993, AJ, 106, 1241
- Denn, Mutel, & Marscher (2000) Denn, G. R., Mutel, R. L., & Marscher, A. P. 2000, ApJS, 129, 61
- Gabuzda & Gómez (2001) Gabuzda, D. C., & Gómez, J. L. 2001, MNRAS, 320, 49
- Homan et al. (2001) Homan, D. C., Ojha, R., Wardle, J. F. C., Roberts, D. H., Aller, M. F., Aller, H. D., & Hughes, P. A. 2001, ApJ, in press, astro-ph/0009301
- Homan & Wardle (1999) Homan, D. C., & Wardle, J. F. C. 1999, AJ, 118, 1942
- Hughes, Aller, & Aller (1985) Hughes, P. A., Aller, H. D., & Aller, M. F. 1985, ApJ, 298, 301
- Lister & Smith (2000) Lister, M. L., & Smith, P. S. 2000, ApJ, 541, 66 (L&S)
- Marscher & Gear (1985) Marscher, A. P., & Gear, W. K. 1985, ApJ, 298, 114
- Marziani et al. (1996) Marziani, P., Sulentic, J. W., Dultzin-Hacyan, D., Calvani, M., & Moles, M. 1996, ApJS, 104, 37
- Nartallo et al. (1998) Nartallo, R., Gear, W. K., Murray, A. G., Robson, E. I., & Hough, J. H. 1998, MNRAS, 297, 667
- Roberts et al. (1994) Roberts, D. H., Wardle, J. F. C., & Brown, L. F. 1994, ApJ, 427, 718
- Strauss et al. (1992) Strauss, M. A., Huchra, J. P., Davis, M., Yahil, A., Fisher, K. B., & Tonry, J. 1992, ApJS, 83, 29
- Taylor (1998) Taylor, G. B. 1998, ApJ, 506, 637
- Taylor (2000) Taylor, G. B. 2000, ApJ, 533, 95
- Wardle et al. (1994) Wardle, J. F. C., Cawthorne, T. V., Roberts, D. H., & Brown, L. F. 1994, ApJ, 437, 122
- Wehrle et al. (2000) Wehrle, A. E., Piner, B. G., Unwin, S. C., Zook, A. C., Xu, W., Marscher, A. P., Teräsranta, H., & Valtaoja, E. 2000, ApJS, in press, astro-ph/0008458
| Major Axis | Minor Axis | ||||||||
|---|---|---|---|---|---|---|---|---|---|
| Source | Component | (mas) | (deg) | (Jy) | (%) | (deg) | (mas) | (mas) | (deg) |
| (1) | (2) | (3) | (4) | (5) | (6) | (7) | (8) | (9) | (10) |
| 3C 273 | D | ||||||||
| C2 | |||||||||
| C1 | |||||||||
| 3C 279 | D | ||||||||
| C1 |
Note. — Columns are as follows: (1) source name; (2) component name; (3) distance from easternmost feature D; (4) position angle of separation from D; (5) total intensity; (6) fractional linear polarization; (7) uncalibrated orientation of the linear polarization position angle; (8) major axis of the model component; (9) minor axis of the model component; (10) orientation of the major axis.