HST/NICMOS detection of a partially embedded, intermediate-mass pre-main-sequence population in the 30 Doradus Nebula
Abstract
We present the detection of an intermediate-mass pre-main-sequence population embedded in the nebular filaments surrounding the 30 Doradus region in the Large Magellanic Cloud (LMC) using HST/NICMOS. In addition to four previously known luminous Class I infrared “protostars,” the NICMOS data reveal 20 new sources with intrinsic infrared excess similar to Galactic pre-main sequence stars. Based on their infrared brightness, these objects can be identified as the LMC equivalent of Galactic pre-main sequence stars. The faintest LMC Young Stellar Objects in the sample have colors similar to T Tauri and have about the same brightness as T Tauri if placed at the distance of the LMC. We find no evidence for a lower-mass cut-off in the initial mass function. Instead, the whole spectrum of stellar masses from pre-main sequence stars with 1.5 M⊙ to massive O stars still embedded in dense knots appears to be present in the nebular filaments. The majority of the young stellar objects can be found to the north of the central starburst cluster R136. This region is very likely evolving into an OB association.
The observations provide further evidence that star formation in the 30 Doradus region is very similar to Galactic star formation, and confirm the presence of sequential star formation in 30 Doradus, with present-day star formation taking place in the arc of molecular gas to the north and west of the starburst cluster.
Subject headings:
(galaxies:) Magellanic Clouds — galaxies: stellar content — stars: formation — stars: pre-main sequence1. Introduction
The study of extragalactic star formation began 20 years ago with the identification of the first candidate protostar in N159 in the Large Magellanic Cloud (LMC) by Gatley et al. (1981). It was subsequently expanded by the identification of other candidate “protostars”, in particular in the 30 Doradus region (Hyland et al. 1992). 30 Doradus is the most luminous giant HII region in the Local Group (Kennicutt 1984). The starburst region consists of multiple stellar generations ranging from 2 Myr old Wolf-Rayet and O3 main-sequence stars to evolved blue and red supergiants with ages up to 25 Myr (Walborn & Blades 1997; de Koter et al. 1998; Massey & Hunter 1998; Grebel & Chu 2000; and references therein). The stellar population has been studied with high spatial resolution with the Hubble Space Telescope (HST) in the optical down to 2.8 M⊙ (Hunter et al. 1995) and with adaptive optics in the near-infrared (Brandl et al. 1996). Recently, Sirianni et al. (2000) extended the study of the initial mass function down to 1.35 M⊙. Infrared and radio observations reveal that molecular gas and warm dust is concentrated in an arc to the north and west of the central starburst cluster in 30 Doradus (Werner et al. 1978; Johansson et al. 1998; Rubio et al. 1998). Three early O-type stars embedded in dense nebular knots (Walborn & Blades 1987, 1997), four luminous infrared “protostars” (Hyland et al. 1992) as well as numerous infrared sources associated with ongoing star formation (Rubio et al. 1992, 1998) have been identified in the arc. Using HST/NICMOS (Thompson et al. 1998), we studied the embedded IR sources in the nebular filaments and their environment in a multi-color survey, aiming at a better understanding of the extent of triggered star formation, the nature of the embedded stellar population, and its luminosity function (see Walborn et al. 1999 for first results). The results of a complementary HST/NICMOS program, which aimed at establishing a deep H-band luminosity function for stars in the central starburst cluster, are reported elsewhere (Zinnecker et al. 1999, and in prep.).
Section 2 gives an overview on the observations. Section 3 details the identification of pre-main sequence stars. In Section 4, the new results are discussed with respect to previous studies of young stellar objects in the LMC, and Section 5 presents a brief summary.
2. Observations and data reduction
2.1. Ground-based near-infrared imaging
Ground-based near-infrared imaging observations in the J-, H-, and K-band were carried out on 1993 February 15 with the ESO/MPI 2.2m telescope and the IRAC-2a camera (Moorwood et al. 1992) at La Silla, Chile. IRAC-2a was equipped with a NICMOS3 array, and a pixel scale of 049 pixel-1 was chosen. The data were obtained as a 33 mosaic covering an area of approximately 350′′ 350′′. Integration times were 60s per position and filter, and the seeing was 10 to 12.
The data were reduced in the standard way, used to identify embedded red objects, and — combined with the data obtained by Rubio et al. (1998) — helped to plan the HST/NICMOS observations. Figure 1 shows a 200′′ 225′′ subset of the K-band mosaic centered on 30 Doradus.
2.2. Space-based near-infrared imaging
| Name | Alias | (2000) | (2000) | J | J–H | H–Ks |
|---|---|---|---|---|---|---|
| [hms] | [∘ ′ ′′] | [mag] | [mag] | [mag] | ||
| 30Dor-NIC08a | 5 38 29.87 | -69 06 11.3 | 16.950.06 | 0.440.07 | 0.550.14 | |
| 30Dor-NIC07a | 5 38 33.14 | -69 06 11.1 | 18.680.12 | 1.840.15 | 1.750.11 | |
| 30Dor-NIC07b | 5 38 33.78 | -69 06 15.4 | 20.030.11 | 0.860.14 | 0.790.14 | |
| 30Dor-NIC03a | [HJ91] P311footnotemark: , IRSW-3022footnotemark: | 5 38 34.57 | -69 05 58.2 | 15.230.09 | 2.160.10 | 2.050.05 |
| 30Dor-NIC02a | 5 38 36.72 | -69 06 21.0 | 18.400.09 | 0.830.11 | 0.780.08 | |
| 30Dor-NIC01a | 5 38 40.12 | -69 06 37.4 | 19.280.09 | 0.360.13 | 0.650.17 | |
| 30Dor-NIC01b | 5 38 40.21 | -69 06 33.2 | 19.210.07 | 0.780.09 | 0.670.06 | |
| 30Dor-NIC09a | 5 38 43.47 | -69 07 00.7 | 19.970.10 | 0.620.13 | 0.580.13 |
| Name | Alias | (2000) | (2000) | J | J–H | H–Ks |
|---|---|---|---|---|---|---|
| [hms] | [∘ ′ ′′] | [mag] | [mag] | [mag] | ||
| 30Dor-NIC16a | [HJ91] P21 | 5 38 41.62 | -69 03 54.7 | 15.380.05 | 2.110.10 | 1.560.12 |
| 30Dor-NIC13a | 5 38 44.65 | -69 05 01.6 | 18.030.06 | 0.600.07 | 0.570.05 | |
| 30Dor-NIC13b | 5 38 45.00 | -69 04 57.9 | 18.900.06 | 0.710.08 | 1.130.06 | |
| 30Dor-NIC13c | 5 38 45.10 | -69 04 54.9 | 19.460.08 | 0.740.11 | 0.790.09 | |
| 30Dor-NIC11a | 5 38 45.96 | -69 05 17.0 | 20.050.13 | 0.620.17 | 0.740.14 | |
| 30Dor-NIC11b | 5 38 46.57 | -69 05 20.1 | 17.650.04 | 0.640.05 | 1.220.04 | |
| 30Dor-NIC12a | 5 38 46.99 | -69 05 08.3 | 19.460.08 | 1.050.10 | 1.550.07 | |
| 30Dor-NIC12b | [HJ91] P111footnotemark: , IRSN-12222footnotemark: | 5 38 47.11 | -69 05 06.1 | 17.460.09 | 2.160.11 | 2.090.08 |
| 30Dor-NIC12c | 5 38 47.24 | -69 05 03.4 | 19.860.12 | 1.340.14 | 1.090.12 | |
| 30Dor-NIC12d | [HJ91] P111footnotemark: , IRSN-12622footnotemark: | 5 38 47.25 | -69 05 02.3 | 17.150.06 | 2.830.07 | 2.540.04 |
| 30Dor-NIC15a | 5 38 48.30 | -69 04 10.3 | 19.010.08 | 0.770.10 | 0.670.09 | |
| 30Dor-NIC15b | [HJ91] P411footnotemark: , IRSN-13422footnotemark: | 5 38 48.45 | -69 04 12.0 | 17.060.07 | 1.820.08 | 1.760.04 |
| 30Dor-NIC14a | 5 38 48.76 | -69 04 47.6 | 19.160.09 | 0.610.11 | 0.640.12 | |
| 30Dor-NIC14b | 5 38 48.82 | -69 04 47.1 | 19.910.12 | 0.920.16 | 0.970.17 | |
| 30Dor-NIC12e | 5 38 48.87 | -69 05 02.2 | 20.300.14 | 0.790.18 | 0.890.16 | |
| 30Dor-NIC10a | 5 38 55.55 | -69 05 25.8 | 16.350.03 | 0.360.04 | 0.410.03 |
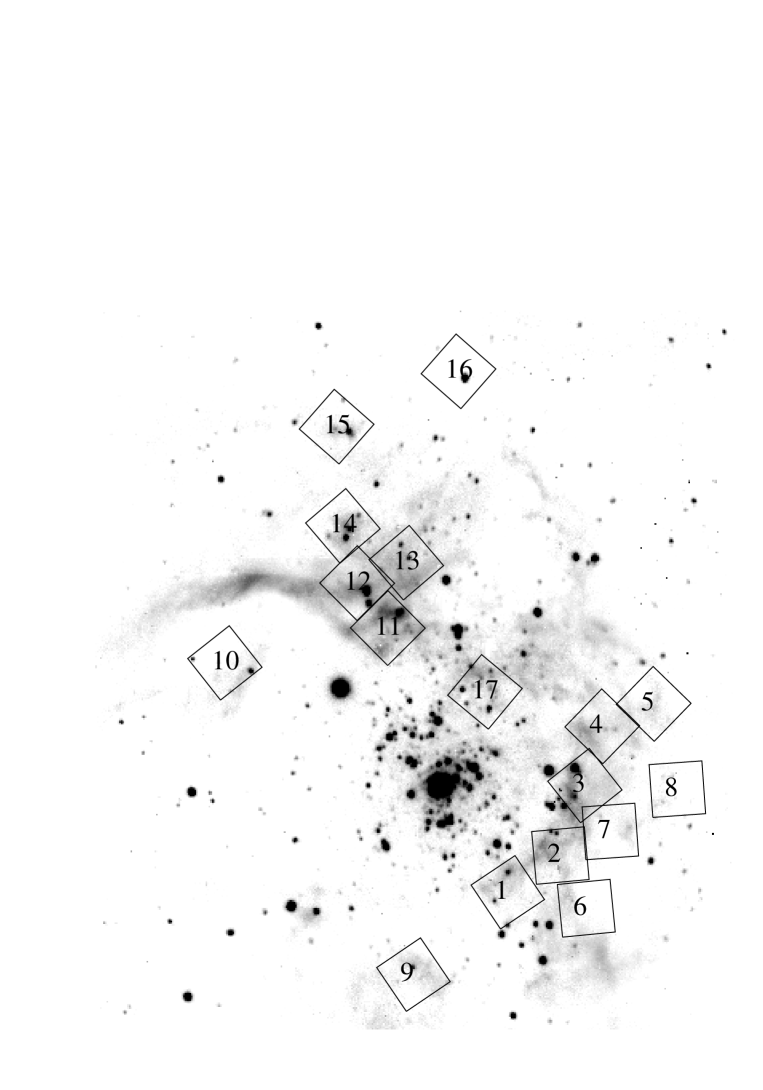
Observations of 17 fields centered on infrared sources and one background field (“sky”) were obtained with HST/NICMOS (NIC2) in Feb. and Mar. 1998. 14 of the fields were observed in the filters F110W (320s), F160W (384s), and F205W (448s). Field 17 was only observed in selected narrow-band filters, i.e., F187N (Pa), F212N (H2), F215N (cont.), and F216N (Br), while observations of fields 4 and 5 were only partially executed due to instrument problems (NICMOS suspended due to a particle hit). The location and orientation of the individual NIC2 fields are outlined in Figure 1. In the present paper, we focus on the photometric analysis of the broad-band data.
The data were reduced using synthetic darks customized for the appropriate detector temperature. The observations of the background field in F205W were combined to produce a sky frame. This “sky” was subtracted from the on-source observation in F205W in order to remove the thermal emission of the telescope. Source identification and photometry were carried out with the IRAF implementation of DAOPHOT. The uncertainties quoted in Tables 1 to 3 are DAOPHOT fitting uncertainties. Transformations from the HST system to ground-based photometry were computed by a comparison of HST/NICMOS observations of stars from the NICMOS list of stars for photometric transformations (NICMOS Data Handbook Version 4) to photometry of the same stars as presented in the 2MASS point source catalog (see also Skrutskie et al. 1997; Beichman et al. 1998). We derived the following color transformations (in units of [mag]):
The color transformations are derived for standard stars with J–H colors ranging from 0.2m to 2.0m and H–Ks colors ranging from 0.1m to 0.9m. The color transformations from F110W and F160W to ground-based J and H magnitudes are within the uncertainties in good agreement with the color transformations presented by Origlia & Leitherer (2000). Transformations from the HST NICMOS system to the CTI/CTIO photometric system, and possible complications due to spectral features which are not in common between standard stars and program stars, are discussed by Stephens et al. (2000).
We estimate the absolute photometric uncertainty to be of the order of 01. The brightness limit for sources detected in all three broad-band filters is mK 198 for a signal-to-noise ratio of 7. Relative photometric uncertainties for individual sources are quoted in Tables 1 to 3.
Positions of individual sources are based on the astrometric information in the FITS file headers. The relative astrometric uncertainty in the position of individual sources within one NICMOS frame should be of the order of 002, whereas the absolute positional uncertainty might be as large as 1′′.
3. Identification of pre-main sequence stars


Near infrared (NIR) color-color diagrams can be used to separate stars with infrared excess due to extinction from stars with intrinsic infrared excess. Intrinsic infrared excess can be attributed to the presence of circumstellar material, and thus is a sign of youth. As pointed out by Lada & Adams (1992), different types of objects occupy well-defined, distinct regions in NIR color-color diagrams. Many young stellar objects lie outside the normal reddening band. Infrared “protostars” (Class I sources) typically are highly reddened (AV = 10m to 40m) and have both J–H and H–K colors +15. Herbig AeBe stars tend to have J–H and H–K colors between +08 and +15. Classical (CTTS) and weak-line T Tauri stars (WTTS) occupy a region characterized by lower extinction (AV 10m). CTTS cluster around J–H +10 and H–K +08, whereas WTTS typically fall within the reddening band. Classical Be stars on the other hand can be found near the blue end of the main-sequence. They show less intrinsic reddening than Herbig AeBe or T Tauri stars and tend to have J–H colors between 02 and +03 and H–K colors between 04 and +03.
Variability of individual sources and other effects like, e.g., source geometry make it difficult to determine the physical properties of individual young stellar objects. The evolutionary nature of a population of young stellar objects can, however, be deduced on a statistical basis from their location in a J–H vs. H–K color-color diagram. Tables 1 and 2 list all sources which were detected in all three bands and which exhibit intrinsic IR excess (i.e., they lie within the photometric uncertainties clearly outside the standard reddening band).

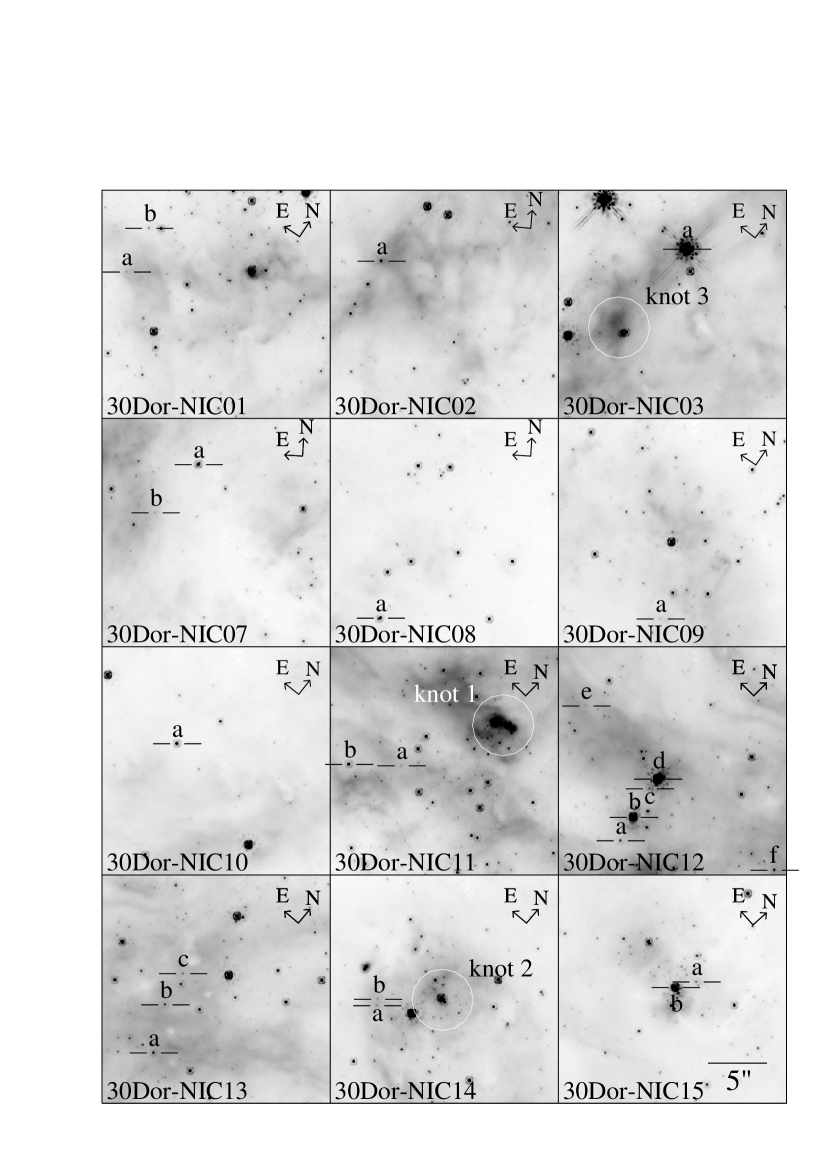
Figure 2, top, shows NIR color-color diagrams of two fields centered approximately 30′′ and 50′′ to the west of R136a. In addition to stars with intrinsic colors close to the colors of unreddened dwarf and giant stars, some stars show clear evidence of IR excess. The majority of the stars with IR excess are located in the area of the normal reddening band, and their IR excess is very likely due to enhanced (foreground) extinction of AV = 5m to 10m.
Figure 2, bottom, shows the color-color diagrams for two of the fields located to the north of R136a. These fields (30Dor-NIC 11, 12, 13, 14, and 15) house a relatively large number of stars with intrinsic NIR excess. Based on their locations in the NIR color-color diagram, the objects appear to be Class I “protostars” and Herbig AeBe stars or T Tauri stars (see Lada & Adams 1992). Figure 3 shows a color-magnitude diagram for the objects listed in Tables 1 to 3. The faintest stars in the sample have J200. According to the 2MASS point source catalog (Second Incremental Data Release, Cutri et al. 2000), T Tauri itself has J=726, J–H=102, and H–K=091. If moved from its location in the Taurus T association (distance 140 pc) to the distance of the LMC (distance 50 kpc), T Tauri would have J=200. Thus the faintest objects listed in Table 1 and 2 could actually be LMC counterparts to T Tauri.
The other fields to the west of the cluster (30Dor-NIC 7, 8) have very few stars with intrinsic NIR excess. The same is the case around 30Dor-NIC 10, which is located NE of the cluster within the arc, and NIC 6 and 9, which are located to the south and south-west of the cluster.
Thirteen of the fourteen fields with broadband observations in all three bands house at least one source with intrinsic NIR excess (see Tables 1 and 2). Twelve of these fields are shown in Figure 4 with the NIR excess sources identified.
The number of candidate sources identified is very likely a lower limit to the total number of young stars in the nebular arc as we required candidates to be detected in all three bands, and as not all young stellar objects exhibit strong intrinsic IR excess. With six detections, the 30DOR-NIC12 field exhibits the highest incidence of intrinsic IR excess sources. This is probably due to the fact that the location of 30DOR-NIC12 coincides with one of the density peaks (“pillar”) in the arc.
The comparison with ground-based photometry is restricted to the objects which are in common between our study and the studies by Hyland et al. (1992) and Rubio et al. (1998): the four “protostars” P1 to P4 and four objects resolved in knots 1 to 3. The aperture size of 5′′ as used by Hyland compared to our diffraction limited resolution of 01 (F110W) to 02 (F205W) makes a comparison not very meaningful. The seeing limited observations by Rubio et al. (1998) have a better resolution of 1′′, but are still by about a factor of 6 to 10 lower spatial resolution than the HST NICMOS observations. Hence a number of fainter background sources contribute to the integrated photometry presented by Rubio et al. (1998), which are not included in our photometry due to the higher spatial resolution.
A direct comparison to the photometry presented by Rubio et al. (1998) does not yield any evidence for large, systematic differences. The scatter in the photometric measurements for individual sources can be explained by the differences in spatial resolution, the non-standard HST NICMOS passbands (in particular F205W), and last but not least by intrinsic variability of individual YSOs.
4. Comparison to previous work on Young Stellar Objects in the 30 Doradus region
4.1. Early O-type stars embedded in nebular knots
| Name | Alias11footnotemark: | (2000) | (2000) | J | J–H | H–Ks |
| [hms] | [∘ ′ ′′] | [mag] | [mag] | [mag] | ||
| Knot 1a | IRSN-101 | 5 38 45.37 | -69 05 08.9 | 14.670.08 | 0.190.09 | 0.030.05 |
| Knot 1b | IRSN-96 | 5 38 45.20 | -69 05 08.2 | 15.340.06 | 0.220.07 | 0.200.06 |
| Knot 1c | IRSN-96 | 5 38 45.11 | -69 05 08.1 | 16.630.10 | 0.380.14 | 0.580.19 |
| Knot 2a | IRSN-135 | 5 38 48.05 | -69 04 43.5 | 14.820.06 | 0.310.07 | 0.070.04 |
| Knot 2b | 5 38 48.00 | -69 04 43.5 | 17.010.09 | 0.310.12 | -0.140.14 | |
| Knot 2c | 5 38 47.96 | -69 04 43.6 | 22footnotemark: | |||
| Knot 3ab33footnotemark: | IRSW-29 | 5 38 34.55 | -69 06 07.2 | 15.610.17 | 0.230.24 | 0.010.21 |
| Knot 3c | 5 38 34.51 | -69 06 06.9 | 16.990.05 | 1.150.07 | 0.280.05 |
Based on optical spectroscopy, Walborn & Blades (1987, 1997) identified three early O-type stars associated with nebular knots (knots 1 to 3, see Figure 4) in the north-east and the west of 30 Doradus as a first evidence for ongoing star formation in the 30 Doradus region. Similar to knot 2, which was originally resolved into individual IR sources by Rubio et al. (1992), the HST/NICMOS observations revealed also knots 1 and 3 as compact multiple systems, very much like the Trapezium system in the Orion cluster (Walborn et al. 1999). Photometry and positions of the brightest components of the multiple systems are summarized in Table 3. The near infrared colors corroborate the identification of the subcomponents as early-type stars seen through a moderate amount of foreground extinction.
Assuming that the ratios of projected separations are representative for their
true separations, we find the following ratios (separation of close pair divided
by separation to third component):
Knot 1: 1:2.7 (0.13 pc vs. 0.35 pc)
Knot 2: 1:1.8 (0.054 pc vs. 0.097 pc)
Knot 3: 1:2.8 (0.033 pc vs. 0.090 pc)
For comparison, the four central stars in the Trapezium cluster in Orion have projected separations between 0.02 pc and 0.04 pc. Thus similar to the Trapezium system, the three early-type triple systems in the 30 Doradus Nebula appear non-hierarchical. Since non-hierarchical multiple systems are dynamically unstable (e.g, Mirzoian & Salukvadze 1985; Sterzik & Durisen 1998; Orlov & Petrova 2000; and references therein), the close associations of early-type stars in the 30 Doradus Nebula provides further evidence for their youth.
As already noted by Walborn et al. (1999), the multiple early-type systems in knots 1 and 2 are associated with a larger number of fainter stars, and might thus constitute very young open clusters. A third cluster of faint, extincted stars can be found around 30Dor-NIC15b (see Figure 2 and 4). The on average somewhat larger physical separation of the early type stars in the center of these open clusters compared to the Orion cluster might indicate that the former already started to disperse gradually (see, e.g., Kroupa et al. 2001). Alternatively, the physical conditions which led to the formation of the 30 Doradus young open clusters might have been different (less extreme?) than the conditions which led to the birth of the Orion cluster. A more detailed discussion of the stellar populations in the association and the young open cluster candidates will be presented in a forthcoming paper (Grebel et al., in prep.).
4.2. Evidence for a low-mass cut-off among pre-main sequence stars in 30 Doradus?
In their near infrared survey of the 30 Doradus region, Hyland et al. (1992) found four infrared candidate “protostars” with K magnitudes brighter than 123, and masses in the range of 15 M⊙ to 20 M⊙ (as deduced from the bolometric luminosities of the infrared sources). Based on the lack of objects with strong infrared excess and K-magnitudes between 123 and 133 (the latter being the brightness limit of their survey), Hyland et al. (1992) suggested that there might be a lower-mass cut-off below 15 M⊙ in the initial mass function for the present-day star formation in 30 Doradus.
The color-magnitude diagram (Figure 3) reveals that the population of sources with intrinsic IR excess extends down to the sensitivity limits of our observations. The candidate pre-main sequence stars listed in Tables 1 & 2 have near-infrared colors (and considering the distance to the LMC, brightness) quite similar to Galactic Herbig AeBe and T Tauri stars with masses in the range from 1.5 M⊙ to 7 M⊙. Furthermore, [HJ 91] P1 is resolved into two red objects (30Dor-NIC12b and d, see Figure 4) with the fainter one having mK = 132 (see also Rubio et al. 1998). Thus our HST/NICMOS survey gives no evidence for a cut-off in the present-day initial mass function possibly down to at least 1.5 M⊙ assuming the infrared excess sources have properties similar to Galactic pre-main sequence stars.
4.3. The low-mass IMF in the central starburst cluster
Sirianni et al. (2000) analyzed archived WFPC2 data of the 30 Dor region. The identification of pre-main sequence stars with masses down to 1.35 M⊙ close to the center of the R136 cluster by Sirianni et al. (2000) is based on the assumption that there is very little differential reddening towards 30 Doradus. Only then can pre-main sequence star candidates be identified exclusively by their position in a color magnitude diagram.
Of the NIC2 fields studied by us, only the fields to the west of R136a overlap with the HST wide field CCD data (though not the planetary camera data) studied by Sirianni et al. (2000). The NICMOS data clearly reveal the presence of substantial differential redding in the overlapping fields. Variable extinction close to the cluster center was reported by Brandl et al. (1996) in their multi-wavelength study of the initial mass function of the starburst cluster, and is also evident in the data presented by Rubio et al. (1998) and Scowen et al. (1998). This indicates that a certain fraction of the purportedly pre-main-sequence stars in the HST/WFPC2 sample by Sirianni et al. (2000) might actually be main-sequence stars viewed through 5m to 10m of visual extinction. An accurate initial mass function can hence only be derived by applying extinction corrections to individual sources, which in turn requires multi-color photometry or spectroscopy of individual stars (see also, e.g., Selman et al. 1999; Panagia et al. 2000).
The scarcity of sources with intrinsic infrared excess inside the 30 Dor nebular arc, however, does not rule out the presence of more pre-main sequence stars. The early-type stars in the 30 Doradus cluster create an intense radiation field, which has an adverse effect on circumstellar disks. Observations of Galactic HII regions like Orion or NGC 3603 revealed that externally illuminated circumstellar disks get photo-evaporated and disperse on short time scales of typically 104 to 105 yr (e.g., Henney & O’Dell 1999, Brandner et al. 2000a, Richling & Yorke 2000).
4.4. Overluminous Herbig AeBe stars?
Based on data obtained by the EROS project, Lamers et al. (1999) identified a group of irregular variable stars in the bar of the LMC with spectral characteristics similar to Galactic Herbig AeBe stars. The majority of these stars, however, appear to be more luminous than Galactic Herbig AeBe stars, and are located above the birthline (Palla & Stahler 1993) of Galactic Herbig AeBe stars. Lamers et al. (1999) argue that the higher luminosity might be either due to higher overall accretion rates or due to the fact that pre-main sequence stars in the LMC become optically visible at an earlier phase than their Galactic equivalents (smaller dust-to-gas ratio in the LMC). Alternatively, Lamers et al. (1999) propose that they might detect the high end of the luminosity function of pre-main sequence stars in the LMC.
In order to test if the infrared luminous “protostars” from the work by Hyland et al. (1992) could be representatives of this group of “overluminous” pre-main-sequence stars, we compare their near infrared photometry to the Galactic Herbig AeBe star Z CMa. Z CMa has a J-magnitude of 579, a J–K color of 225, and is located at a distance of 1150 pc (e.g., Leinert et al. 1997). If placed at the distance of the LMC, Z CMa would have mJ=140 and mK=117, i.e. quite in the range of brightness values observed for the “protostars” from Hyland et al. (1992). The redder J–K colors of the candidate “protostars” identified by Hyland et al. (1992) compared to Z CMa could be due to differences in the geometry of circumstellar material. Edge-on circumstellar disk sources in Galactic star forming regions can have J–K colors 7m (e.g. Brandner et al. 2000b, Table 1). Thus again we find no strong evidence that star formation in 30 Doradus might be different from Galactic star formation. This is also in agreement with the study of pre-main sequence candidates around SN 1987A in 30 Dor C by Panagia et al. 2000, who do not find evidence for a large population of overluminous pre-main sequence stars (e.g., Fig. 4 in their paper).
These findings do not exclude, however, that star formation in lower metallicity environments, like the bar region of the LMC, might be different.
5. Summary
We analyzed HST/NICMOS data and groundbased infrared imaging obtained with the ESO/MPI 2.2m telescope and IRAC2 of the 30 Doradus region. We find clear evidence for ongoing, extended star formation in a 10 pc 15 pc region to the north of the central starburst cluster. This region is part of the arc of molecular gas and warm dust around 30 Doradus. Star formation in this region may have been triggered by the starburst cluster. The fainter IR-excess sources have colors and brightness similar to Herbig AeBe and T Tauri stars with masses possibly in the range of 1.5 M⊙ to 7 M⊙, and could thus be LMC equivalent of Galactic low- to intermediate-mass pre-main sequence stars. The present-day initial mass-function apparently shows no cut-off down to the mass (resp. magnitude) limit of our study. The whole spectrum of stellar masses from pre-main sequence stars with masses 1.5 M⊙ to massive O stars still embedded in dense knots might be present in the nebular filaments.
The spatial extent of pre-main-sequence stars in the region to the north of 30 Doradus suggests that we are witnessing the birth of an OB association including a small number of open clusters. Similar older associations, in part with low-density clusters, are seen throughout the 30 Doradus region (e.g., Walborn & Blades 1997; Grebel & Chu 2000). Star formation to the west and south appears to be less intense than in the large scale, nascent OB association to the north of the cluster. This might be indicative of a different, more isolated mode of star formation. Present day star formation activity in 30 Doradus coincides with the spatial distribution of the densest features of the molecular gas, or their interfaces with the central cavity being evacuated by the R136 cluster.
Follow-up near infrared spectroscopy of the pre-main sequence candidates is required in order to confirm their youth and to study their physical properties, such as spectral types or accretion rates.
References
- (1) Beichman C.A., Chester, T.J., Skrutskie, M., Low, F.J., Gillet, F., 1998, PASP, 110, 480
- (2) Brandl, B., Sams, B.J., Bertoldi, F., Eckart, A., Genzel, R. et al. 1996, ApJ 466, 254
- (3) Brandner, W., Grebel, E.K., Chu, Y.-H., Dottori, H., Brandl, B., Richling, S., Yorke, H.W., Points, S.D., Zinnecker, H. 2000a, AJ 119, 292
- (4) Brandner, W., Sheppard, S., Zinnecker, H., Close, L., Iwamuro, F., Krabbe, A., Maihara, T., Motohara, K., Padgett, D.L., Tokunaga, A. 2000b, A&A 364, L13
- (5) Cutri, R.M., Skrutskie, M.F., Van Dyk, S., Chester, T., Evans, T., Fowler, J. et al. 2000, Explanatory Supplement to the 2MASS Second Incremental Data Release, published in electronic form
- (6) de Koter, A., Heap, S.R., Hubeny, I. 1998, ApJ 509, 879
- (7) Gatley, I., Becklin, E.E., Hyland, A.R., Jones, T.J. 1981, MNRAS 197, 17
- (8) Grebel, E.K., Chu, Y.-H. 2000, AJ 119, 787
- (9) Henney, W.J., O’Dell, C.R. 1999, AJ 118, 2350
- (10) Hunter, D.A., Shaya, E.J., Holtzman, J.A., Light, R.M., O’Neil, E.J., Lynds, R. 1995, ApJ 448, 179
- (11) Hyland, A.R., Jones, T.J. 1991, IAU Symp. 148, eds. Haynes, R., Milne, D., p. 202
- (12) Hyland, A.R., Straw, S., Jones, T.J., Gatley, I. 1992, MNRAS 257, 391
- (13) Johansson, L.E.B., Greve, A., Booth, R.S., Boulanger, F. et al. 1998, A&A 331, 857
- (14) Kennicutt, R.C., Jr. 1984, ApJ 287, 116
- (15) Kroupa, P., Aarseth, S., Hurley, J. 2001, MNRAS 321, 699
- (16) Lada, C.J., Adams, F.C. 1992, ApJ 393, 278
- (17) Lamers, H.J.G.L.M., Beaulieu, J.P., de Wit, W.J. 1999, A&A 341, 827
- (18) Leinert, C., Richichi, A., Haas, M. 1997, A&A 318, 472
- (19) Massey, P., Hunter, D.A. 1998, ApJ 493, 180
- (20) Mirzoian, L.V., Salukvadze, G.N. 1985, Ap&SS 110, 153
- (21) Moorwood, A., Finger, G., Biereichel, P., Delabre, B., van Dijsseldonik, A. et al. 1992, The Messenger (ESO) 69, 61
- (22) Origlia, L., Leitherer, C. 2000, AJ 119, 2018
- (23) Orlov, V.V., Petrova, A.V. 2000, Astronomy Letters 26, 250
- (24) Palla, F., Stahler, W., 1993, ApJ 418, 414
- (25) Panagia, N., Romaniello, M., Scuderi, S., Kirshner, R.P. 2000, ApJ 539, 197
- (26) Richling, S., Yorke, H.W. 2000, ApJ 539, 258
- (27) Rubio, M., Roth, M., García, J. 1992, A&A 261, L29
- (28) Rubio, M., Barbá, R.H., Walborn, N.R., Probst, R., García, J., Roth, M.R. 1998, AJ 116, 1708
- (29) Scowen, P.A., Hester, J.J., Sankrit, R., Gallagher, J.S., Ballester, G.E. et al. 1998, AJ 116, 163
- (30) Selman, F., Melnick, J., Bosch, G., Terlevich, R. 1999, A&A 341, 98
- (31) Sirianni, M., Nota, A., Leitherer, C., De Marchi, G., Clampin, M. 2000, ApJ 533, 203
- (32) Skrutskie, M., et al., 1997, in The Impact of Large-Scale Near IR Sky Surveys, ed. F. Garzon et al. (Dordrecht: Kluwer), 25
- (33) Stephens, A.W., Frogel, J.A., Ortolani, S., Davies, R., Jablonika, P., Renzini, A., Rich, R.M. 2000, AJ 119, 419
- (34) Sterzik, M.F., Durisen, R.H. 1998, A&A 339, 95
- (35) Thompson, R.I., Rieke, M., Schneider, G., Hines, D.C., Corbin, M.R. 1998, ApJ 492, L95
- (36) Walborn, N.R., Barbá, R.H., Brandner, W., Rubio, M., Grebel, E.K., Probst, R. 1999, AJ 117, 225
- (37) Walborn, N.R., Blades, J.C. 1987, ApJ 323, L65
- (38) Walborn, N.R., Blades, J.C. 1997, ApJS 112, 457
- (39) Werner, M.W., Becklin, E.E., Gatley, I., Ellis, M.J., Hyland, A.R., Robinson, G., Thomas, J.A. 1978, MNRAS 184, 365
- (40) Zinnecker, H., Brandl, B., Brandner, W., Moneti, A., Hunter, D. 1999, IAU Symp. 190, eds. Chu, Y.-H. et al., p. 222