Sloan Digital Sky Survey Multicolor Observations of GRB010222
Abstract
The discovery of an optical counterpart to GRB010222 (detected by BeppoSAX; Piro 2001) was announced 4.4 hrs after the burst by Henden (2001a). The Sloan Digital Sky Survey’s 0.5m photometric telescope (PT) and 2.5m survey telescope were used to observe the afterglow of GRB010222 starting 4.8 hours after the GRB. The 0.5m PT observed the afterglow in five, 300 sec band exposures over the course of half an hour, measuring a temporal decay rate in this short period of . The 2.5m camera imaged the counterpart nearly simultaneously in five filters (), with at 12:10 UT. These multicolor observations, corrected for reddening and the afterglow’s temporal decay, are well fit by the power-law with the exception of the band UV flux which is 20% below this slope. We examine possible interpretations of this spectral shape, including source extinction in a star forming region.
1 Introduction
Gamma Ray Bursts (GRBs) were first detected over three decades ago by the Vela satellites (Klebesadel et al., 1973), and the first search for optical counterparts started nearly immediately with W. A. Wheaton’s use of the Prairie Network (Grindlay & Wright, 1974). These searches were fruitless until very recently; positions accurate to a few arcminutes were not available for days, after the bursts had decayed substantially, placing afterglows beyond the reach of the few large telescopes searching for them. BATSE’s near-real-time coordinates had several degree positional errors (Paciesas et al., 1999) allowing only specialized wide field instruments to respond to its triggers (Krimm et al., 1995; Lee et al., 1997; Akerlof et al., 1999). The BeppoSAX satellite (Scarsi, 1993) was the first to provide arcminute accuracy within a few hours of a GRB. With the early announcements of those accurate positions, beginning in 1997, large telescopes could join the search and discovered GRB afterglows starting with GRB970228 (Groot et al., 1997; van Paradijs et al., 1997).
The following work describes observations of GRB010222 with the Sloan Digital Sky Survey’s (SDSS; York et al. 2000) telescopes. The SDSS is a project to image 10,000 of the Northern Galactic Cap in five different filters () to a depth of and to perform followup spectroscopy of the brightest galaxies and quasars found in the photometry. The SDSS is designed to be on the photometric system described in Fukugita et al. (1996) which is an system where flat spectrum objects () have zero colors (Fukugita et al., 1996). The magnitudes in this paper are quoted on the preliminary system which may differ by at most a few percent from the system of Fukugita et al. (1996). The dedicated survey instruments, a 2.5m survey telescope and a 0.5m photometric telescope (PT), are located at Apache Point Observatory (APO) in Sunspot, New Mexico.
2 Observations
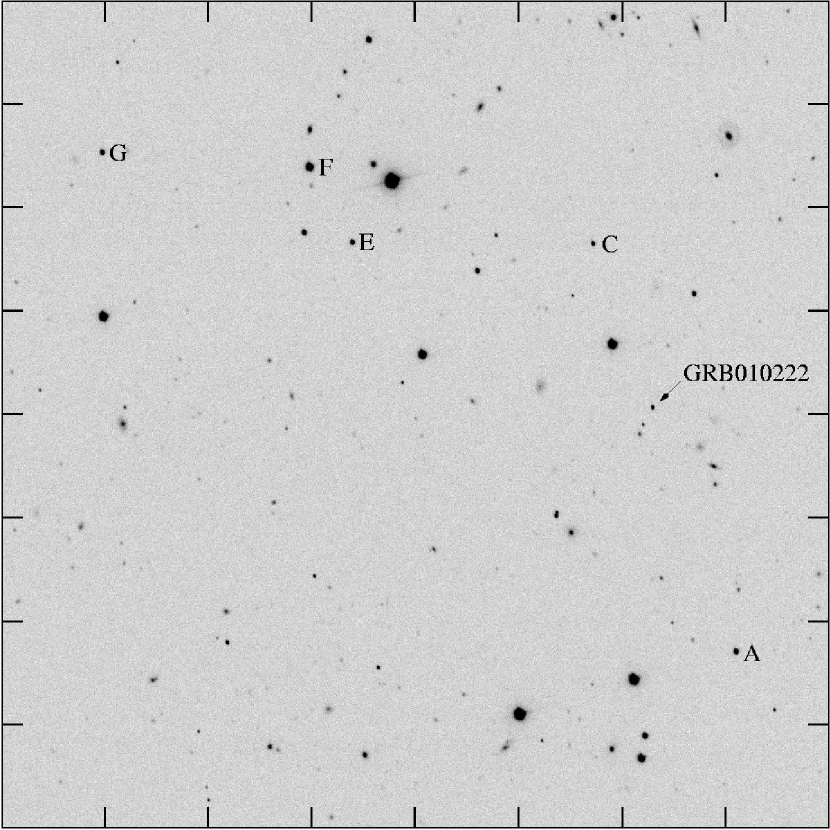
GRB010222 was detected by BeppoSAX on 2001 February 22 at 07:23:30 U.T. in both the Gamma Ray Burst Monitor (GRBM; 40-700 keV) and the Wide Field Camera Unit 1 (WFC1; 2-28 keV) instruments, and was “possibly the brightest (GRB) ever observed by BeppoSAX” (Piro, 2001). The coordinates of the BeppoSAX detection were distributed via the GRB Coordinates Network (GCN; Barthelmy et al. 1998) at 10:36 UT (Piro, 2001), and Henden (2001a) reported the discovery of an optical counterpart at 11:48 UT, 4.4 hours after the trigger. (See finding chart, Figure 1.) At this time conditions at APO were not ideal for SDSS survey imaging as clouds were approaching, and the time remaining in the night did not allow for a switch to spectroscopy; thus SDSS observers decided to follow up the counterpart with both the 0.5m PT and the 2.5m survey telescope. Fortunately for these observations the cloud passed before GRB imaging began and conditions were more photometric after the cloud than before.
2.1 0.5m Photometric Telescope Observations
The photometric telescope is an f/8.8, 0.5m telescope equipped with filters. The single SITe CCD camera has a field of view. The PT took a series of five, 300 second observations in band centered on the reported GRB010222 location, following the afterglow for approximately 30 minutes before ending operations for the night (see Table 1). Normally, the photometric telescope and the associated reduction software are used on objects with . Since the GRB exposures were unusually long and the counterpart was relatively dim (the Poisson error limit is ) photometry was performed within a smaller than standard aperture to improve the relative photometry of faint objects. The counterpart magnitudes were then corrected using a sigma clipped mean of the magnitude offsets in each frame from the mean magnitude across the five frames of well measured stars (); corrections were at most 0.005 mag, indicating conditions were photometric over the 30 minute timespan.
2.2 2.5m Survey Telescope Observations
The 2.5m survey telescope is an f/5, 3 field of view telescope designed and constructed for the SDSS. The telescope has two interchangeable instruments, an imaging camera and a fiber-fed spectrograph. The imaging camera (Gunn et al., 1998) includes an array of 30 CCDs in six columns of five CCDs each, one CCD for each of the 5 filters. The camera operates in a drift scan mode, scanning the sky in great circles at sidereal rate. Astronomical objects are imaged for 53.9 seconds in each CCD in the order . Because of the gaps between columns the telescope must observe a second such interleaved strip to make a complete stripe.
For GRB010222 the 2.5m telescope observed two short interleaved strips covering a roughly square region. The GRB010222 counterpart was found in the second strip, field 22 of camera column 3, run 2143. The images were processed through the normal SDSS data processing pipelines and calibrated against two 0.5m PT secondary fields (hereafter, patches) of the GRB field observed March 14 and 17. These patches in turn were calibrated against a system of standard stars (Smith et al., in preparation) which the 0.5m PT observes several times throughout the night to measure extinction and determine photometric zeropoints. Our diagnostic tests of the location of the stellar locus and number counts of various classes of objects, as compared with the approximately 1000 of sky observed already in the survey, indicate the relative calibrations are no worse than 2% in any filter. The zeropoints also agree to within 1% with a second indirect calibration based on other 2.5m data from the same night and four secondary patches from two previous nights. Thus we are confident the relative (absolute) errors are no greater than the standard SDSS values of 3%(5%) for , , and , and 2%(3%) for and (where the absolute errors include possible differences between the SDSS preliminary photometric system and the system of Fukugita et al. 1996). The calibrated 2.5m magnitudes are shown in Table 1 along with 0.5m PT observations. Table 2 includes magnitudes for eleven reference stars in field 22, including the reference star “A” listed in McDowell et al. (2001). All stars have been selected from unsaturated and non-interpolated (for cosmic ray correction) stars with with the exception of the reference star “A” from McDowell et al. (2001). This star was interpolated in band, but the correction was within the quoted errors and visual inspection revealed no problems.
3 Results
The fading of GRB optical afterglows is often well fit by a power-law decay of with although decay rates from slightly less than this to (Groot et al., 1998) and breaks to steeper power-laws have been observed in some afterglows. GRB010222 appears to be best fit by broken power-law models (Holland et al., 2001; Masetti et al., 2001) with early decay rates of to and steeper later time decays of with the break occurring around 0.5 days after the GRB. Considering the short time span and the limiting errors, measurements of the decay rate with the 0.5m PT observations were difficult. The error weighted least squares fit to the five points gives (see Figure 2), which is consistent with other early decay rates measured for this burst (Price et al., 2001; Fynbo et al., 2001; Stanek et al., 2001b; Holland et al., 2001; Masetti et al., 2001).
The spectral shape of GRB afterglows is also well fit by a power-law, with typical values of . In order to derive a power-law fit for our 2.5m observations we first corrected for the local Galactic extinction with the dust map of Schlegel, Finkbeiner, & Davis (1998) which gives extinction values of = 0.118, = 0.087, = 0.063, = 0.048, and = 0.034 at the reported location , (J2000; Henden & Vrba 2001b). We next wished to correct for the small effect of fading over the few minutes between exposures in the individual bands at 4.8 hours after the burst. Because of the large errors in our own decay rate measurement we instead used a least squares fit to a single power-law for all reported band data points within 8 hours after the burst (and before the day break; see McDowell et al. 2001; Stanek et al. 2001a; Watanabe et al. 2001; Holland et al. 2001) with magnitudes adjusted to the calibration of Henden (2001c) where necessary. The resulting fit to the published band data is , consistent with values reported by Holland et al. (2001). We applied decay corrections relative to of [-0.0035, -0.0066, -0.010, -0.013] to .
Once these corrections were applied, the least squares fit to all five filters is . However, a much better fit can be obtained by excluding the filter; the remaining non-UV filters have a least squares fit of (see Figure 3). This second value agrees closely with the spectral slope of observed by Jha et al. (2001b) in a spectrum observed 4.92 hours after the burst, shortly after the 2.5m observations. Our magnitude, at an effective wavelength of 3565Å, is approximately 20% lower than the power-law fit to the other bands. A similar deficit was seen in the band observations of Masetti et al. (2001) one and two days after the burst, and Jha et al. (2001b) may see the beginning of this steepening in their last binned spectra point near 4000Å. (After this work was submitted similar band results were reported by Stanek et al. (2001c) for observations from 0.2 to 2 days after the burst.) These independent observations indicate this spectral feature remained constant for at least two days.
We propose that the break in the spectrum at may be an indication of one of two possibilities: either the Ly forest or extinction at the source. The first possible explanation for the deficit is that the counterpart is at a redshift near 2 rather than at the redshift 1.477 absorption system reported by Garnavich et al. (2001); Jha et al. (2001a); Bloom et al. (2001); Castro et al. (2001); Jha et al. (2001b) and Masetti et al. (2001). For an object without detected emission lines such as GRB010222, an absorption line system can only provide a lower z limit to the source redshift. The spectrum of Jha et al. (2001b) does not extend far past 4000Å, thus no upper limit is imposed until . For observed QSOs the Ly forest enters at redshifts slightly above , but the 20% depression observed here would not occur unless the redshift were (Cristiani et al., 1993). However Jha et al. (2001b) convincingly argue that given the strength of the absorber the GRB source is almost certainly at that redshift. Thus a true GRB source redshift of would seem to be an unlikely explanation.
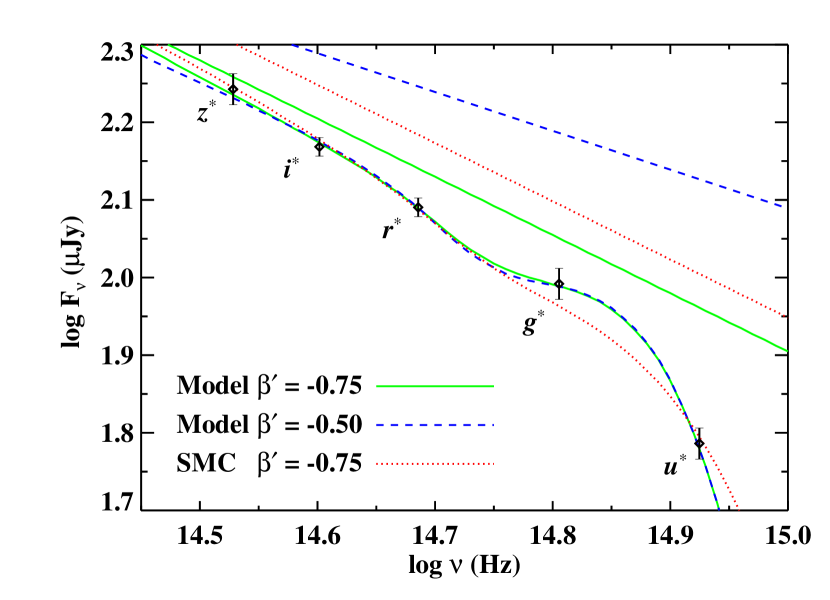
A second, more probable, explanation is that the counterpart may reside in a star-forming region at similar to the Large Magellanic Cloud (LMC) or Small Magellanic Cloud (SMC) and be extincted at the source. Dust in front of the GRB could cause the extinction of the afterglow and the gas would explain the large equivalent widths in the absorption system (York et al., 1986). To examine this possibility we have fit the full extinction curve model of Reichart (2001) to the SDSS data. Acceptable fits can be found for a wide range of intrinsic power-law spectra (with index ). We present two possibilities, and . These choices for are motivated as follows: under the models of Sari, Piran, & Narayan (1998) and Sari, Piran, & Halpern (1999) the afterglow is described in terms of synchrotron emission from a decelerating relativistic shell or jet colliding with the surrounding ISM. The resulting spectrum can be expressed as four power-laws broken at three time-dependent frequencies, the synchrotron self-absorption frequency , the cooling frequency , and the frequency corresponding to the minimum Lorentz factor of accelerated electrons . If the shock evolves adiabatically in a constant density medium, the break in the light curve at days (Holland et al., 2001; Masetti et al., 2001) might be explained by a jet if the observed and , and . If the shock instead evolves radiatively, the break in the light curve might be explained by passing through the optical at days if , and . For , we find that the best fits in the Reichart (2001) model are the source extinction (0.13) mag, the slope of the UV linear component (1.34), the strength of the UV bump (2.7), and the strength of the FUV non-linear component (6.9). These curves are shown in Figure 4 which includes a typical SMC-like extinction curve for a source spectrum with and source extinction = 0.10. For the case there is a strong degeneracy between and the parameters and such that only and can be constrained; and can be increased to any value by decreasing , thus statistically we can only set lower bounds. For , mag () and at the confidence level; ; at the confidence level; and , at the confidence level. Further, (higher than any observed value) at the confidence level. For the degeneracy is not as stong, and we can place the following limits: mag and at the confidence level; ; at the confidence level and (); at the confidence level, at the confidence level, and (). The Reichart (2001) fits to the two GRB models are approximately equally likely (with the model fit only 1.4 times more probable than the model fit).
The Reichart (2001) best fit values of and the second value of are typical of that observed in the LMC. Given the errors, the first value of is not inconsistent with this interpretation. However, for both afterglow models the values of , required to extinguish relative to the other bands, are about an order of magnitude greater than those found in the LMC or SMC. Waxman & Draine (2000) and Galama & Wijers (2001) propose that the optical flash (e.g., Akerlof et al. 1999) and the burst may sublimate and fragment dust in the circumburst environment. If small (radius 300 ) graphite grains, which may be responsible for the FUV non-linear component (Draine & Lee, 1984), survive in greater numbers in this environment, this value of is not unreasonable. Alternatively, the large value and band deficit could be due to absorption by molecular hydrogen (Draine, 2000) which would span the entire band at ; however the expected feature at Å redshifted to Å is not obvious in the published spectra.
4 Conclusions
The serendipitous 2.5m survey telescope observations of GRB010222 occurred in this case because of the very fortunate timing of a counterpart discovery announcement towards the end of a night when conditions did not favor normal survey operations. The 2.5m camera is an unwieldy instrument for rapid followup observations; nonetheless this observation has shown the value of early five filter observations. In addition to the measurement of the spectral slope (), the break to a steeper slope in (also seen in the band observations of Masetti et al. 2001 and Stanek et al. 2001c) was not predicted or seen in spectra, and may indicate an alternate source redshift, source extinction in a star forming region modified by the GRB or its progenitor, or something else entirely.
The 0.5m PT is an automated telescope and in general much better suited for GRB followup observations than the 2.5m survey telescope. In this case the same timing that was so fortunate for the 2.5m was disadvantageous for the PT, which was only able to observe the burst near its limit and for a short period before shutting down for the night. Due to an afterglow’s rapid decay, typical BeppoSAX delays of several hours place afterglows near the detection limit of smaller telescopes. HETE-2, launched in October of 2000, will soon provide arcminute positions for GRBs within minutes of the trigger, potentially allowing telescopes such as the PT to measure both the spectral and temporal behavior of a burst in the first few hours.
Acknowledgments
We would like to thank Scott Barthelmy and everyone who has made the GCN possible, as well as the BeppoSAX team who provided the localization so crucial to this work. We would also like to thank Bruce Woodgate for his help in these observations.
The Sloan Digital Sky Survey (SDSS) is a joint project of The University of Chicago, Fermilab, the Institute for Advanced Study, the Japan Participation Group, The Johns Hopkins University, the Max-Planck-Institute for Astronomy (MPIA), the Max-Planck-Institute for Astrophysics (MPA), New Mexico State University, Princeton University, the United States Naval Observatory, and the University of Washington. Apache Point Observatory, site of the SDSS telescopes, is operated by the Astrophysical Research Consortium (ARC).
Funding for the project has been provided by the Alfred P. Sloan Foundation, the SDSS member institutions, the National Aeronautics and Space Administration, the National Science Foundation, the U.S. Department of Energy, Monbusho, and the Max Planck Society. The SDSS Web site is http://www.sdss.org/.
References
- Akerlof et al. (1999) Akerlof, C. et al. 1999, Nature, 398, 400
- Barthelmy et al. (1998) Barthelmy, S. et al. 1998, in AIP Conf. Proc. 428, 99
- Bloom et al. (2001) Bloom, J. S., Djorgovski, S. G., Halpern, J. P., Kulkarni, S. R., Galama, T. J., Price, P. A., & Castro, S. M. 2001, GCN Circ. 989
- Castro et al. (2001) Castro, S., Djorgovski, S. G., Kulkarni, S. R., Bloom, J. S., Galama, T. J., Reichart, D. E., & Price, P. A. 2001, GCN Circ. 999
- Cristiani et al. (1993) Cristiani, S., Giallongo, E., Buson, L. M., Gouiffes, C. & La Franca, F. 1993, A&A, 268, 86
- Draine (2000) Draine, B. T. 2000, ApJ, 532, 273
- Draine & Lee (1984) Draine, B. T. & Lee, H. M. 1984, ApJ, 285, 89
- Fukugita et al. (1996) Fukugita, M., Ichikawa, T., Gunn, J. E., Doi, M., Shimasaku, K., & Schneider, D. P. 1996, AJ, 111, 1748
- Fynbo et al. (2001) Fynbo, J. P. U. et al., 2001, GCN Circ. 975
- Galama & Wijers (2001) Galama, T. J., & Wijers, R. A. M. J. 2001, ApJ, 549, 209L
- Garnavich et al. (2001) Garnavich, P. M., Pahre, M. A., Jha, S., Calkins, M., Stanek, K. Z., McDowell, J., & Kilgard, R. 2001, GCN Circ. 965
- Grindlay & Wright (1974) Grindlay, J. E., & Wright, R. E. 1974, ApJ, 192, 113L
- Groot et al. (1997) Groot, P. J. et al., 1997, IAU Circ.6584
- Groot et al. (1998) Groot, P. J. et al., 1998, ApJ, 502, 123L
- Gunn et al. (1998) Gunn, J. E. et al. 1998, AJ, 116, 3040
- Henden (2001a) Henden, A. 2001a, GCN Circ. 961
- Henden & Vrba (2001b) Henden, A. & Vrba, F. 2001b, GCN Circ. 967
- Henden (2001c) Henden, A. 2001c, GCN Circ. 987
- Holland et al. (2001) Holland, S., Fynbo, J., Gorosabel, J., Henden, A., Hjorth, J., Jensen, B., & Pedersen, H. 2001, GCN Circ. 1002
- Jha et al. (2001a) Jha, S., Matheson, T., Calkins, M., Pahre, M. A., Stanek, K. Z., McDowell, J., Kilgard, R., & Garnavich, P. M. 2001, GCN Circ. 974
- Jha et al. (2001b) Jha, S. et al. 2001, ApJ, submitted (astro-ph/0103081)
- Klebesadel et al. (1973) Klebesadel, R. W., Strong , I. B., & Olson, R. A. 1973, ApJ, 182, 85L
- Krimm et al. (1995) Krimm, H. A., Vanderspek, R. K., & Ricker, G. R. 1995, AIP Conf. Proc. 384, 661
- Lee et al. (1997) Lee, B. et al. 1997, ApJ, 482, 125L
- Masetti et al. (2001) Masetti, N. et al. 2001, A&A, submitted (astro-ph/0103296)
- McDowell et al. (2001) McDowell, J., Kilgard, R., Garnavich, P. M., Stanek, K. Z., & Jha, S. 2001, GCN Circ. 963
- Paciesas et al. (1999) Paciesas, W. S. et al. 1999, ApJS, 122, 465
- Piro (2001) Piro, L. 2001, GCN Circ. 959
- Price et al. (2001) Price, P. A., Gal-Yam, A., Ofek, E., Yost, S., Bloom, J. S., Galama, T. J., Harrison, F., & Kulkarni, S. R. 2001, GCN Circ. 973
- Reichart (2001) Reichart, D. E. 2001, ApJ, in press, astro-ph/9912368
- Sari, Piran, & Halpern (1999) Sari, R., Piran, T., & Halpern, J. P. 1999, ApJ, 519, L17
- Sari, Piran, & Narayan (1998) Sari, R., Piran, T., & Narayan, R. 1998, ApJ, 497, L17
- Scarsi (1993) Scarsi, L. 1993, Astronomy & Astrophysics Supplement Series, 97, 371
- Schlegel, Finkbeiner, & Davis (1998) Schlegel, D. J., Finkbeiner, D. P., & Davis, M. 1998, ApJ, 500, 525
- Stanek et al. (2001a) Stanek, K. Z., Jha, S., McDowell, J., Kilgard, R., Roll, J., Garnavich, P. M., & Kaluzny, J. 2001a, GCN Circ. 970
- Stanek et al. (2001b) Stanek, K. Z., Challis, P., Jha, S., Kilgard, R., McDowell, J., & Garnavich, P. M. 2001b, GCN Circ. 983
- Stanek et al. (2001c) Stanek, K. Z., et al. 2001c, ApJ, submitted (astro-ph/0104329)
- van Paradijs et al. (1997) van Paradijs, J., et al., 1997, Nature, 386, 686
- Watanabe et al. (2001) Watanabe, J., Kinoshita, D., Fuse, T., Komiyama, Y., Fujihara, G., Potter, B., & Harasawa, S. 2001, GCN Circ. 993
- Waxman & Draine (2000) Waxman, E. & Draine, B. T. 2000, ApJ, 537, 796
- York et al. (1986) York, D. G., Dopita, M., Green, R. & Bechtold, J. 1986, ApJ, 311, 610
- York et al. (2000) York, D. G. et al. 2000, AJ, 120, 1579
| UTCaaExposure start time, 2001 Feb 22. | telescope | band | exposure (sec) | magnitudebbStatistical errors; absolute photometry errors for the 2.5m may be as large as 5% for , , and , 3% for and . |
|---|---|---|---|---|
| 12:09:35 | 2.5m | 54 | ||
| 12:10:47 | 2.5m | 54 | ||
| 12:11:59 | 2.5m | 54 | ||
| 12:13:10 | 2.5m | 54 | ||
| 12:14:22 | 2.5m | 54 | ||
| 12:13:15 | 0.5m | 300 | ||
| 12:19:36 | 0.5m | 300 | ||
| 12:25:58 | 0.5m | 300 | ||
| 12:32:19 | 0.5m | 300 | ||
| 12:38:41 | 0.5m | 300 |
| bbBecause of the non-standard orientation and short length of this stripe the astrometric errors are unusually large, approximately . | bbBecause of the non-standard orientation and short length of this stripe the astrometric errors are unusually large, approximately . | ||||||
|---|---|---|---|---|---|---|---|
| GRB | |||||||
| A | |||||||
| B | |||||||
| C | |||||||
| D | |||||||
| E | |||||||
| F | |||||||
| G | |||||||
| H | |||||||
| I | |||||||
| J | |||||||
| K |