Calibration of the CH and CN Variations Among Main Sequence Stars in M71 and in M1311affiliation: Based partially on observations obtained at the W.M. Keck Observatory, which is operated jointly by the California Institute of Technology and the University of California
Abstract
An analysis of the CN and CH band strengths measured in a large sample of M71 and M13 main sequence stars by Cohen (1999a,b) is undertaken using synthetic spectra to quantify the underlying C and N abundances. In the case of M71 it is found that the observed CN and CH band strengths are best matched by the identical C/N/O abundances which fit the bright giants, implying: 1) little if any mixing is taking place during red giant branch ascent in M71, and 2) a substantial component of the C and N abundance inhomogeneities is in place before the main sequence turn-off. The unlikelihood of mixing while on the main sequence requires an explanation for the abundance variations which lies outside the present stars (primordial inhomogeneities or intra-cluster self enrichment). For M13 it is shown that the 3883Å CN bands are too weak to be measured in the spectra for any reasonable set of expected compositions. A similar situation exists for CH as well. However, two of the more luminous program stars do appear to have C abundances considerably greater than those found among the bright giants thereby suggesting deep mixing has taken place on the M13 red giant branch.
keywords:
globular clusters: general — globular clusters: individual (M71, M13) — stars: evolution — stars: abundances1 INTRODUCTION
By virtue of their large populations of coeval stars, the Galactic globular clusters present us with a unique laboratory for the study of the evolution of low mass stars. The combination of their extreme ages, compositions and dynamics also allows us a glimpse at the early history of the Milky Way and the processes operating during its formation. These aspects become even more significant in the context of the star-to-star light element inhomogeneities found among red giants in every cluster studied to date. The large differences in the surface abundances of C, N, O, and often Na, Mg, and Al have defied a comprehensive explanation in the three decades since their discovery.
Proposed origins of the inhomogeneities typically break down into two scenarios: 1) As C, N, O, Na, Mg, and Al are related to proton capture processes at CN and CNO-burning temperatures, material cycled through a region above the H-burning shell in evolving cluster giants may be brought to the surface with accompanying changes in composition. While standard models of low mass stars do not predict this “deep mixing”, several theoretical mechanisms have been proposed (e.g., the meridional mixing of Sweigart & Mengel 1979, and turbulent diffusion, Charbonel 1994, 1995) with varying degrees of success. Moreover, there is ample observational evidence that deep mixing does take place during the red giant branch (RGB) ascent of metal-poor cluster stars (the works here are far too numerous to list - see the reviews of Kraft 1994 and Pinsonneault 1997 and references therein). 2) It has also become apparent that at least some component of these abundance variations must be in place before some cluster stars reach the giant branch. Spectroscopic observations of main sequence turn-off stars in 47 Tuc (Hesser 1978; Hesser & Bell 1980; Bell, Hesser, & Cannon 1983; Briley, Hesser, & Bell 1991; Briley et al.1994, 1996; Cannon et al. 1998) and NGC 6752 (Suntzeff & Smith 1991) have shown variations in CN and CH-band and Na line strengths consistent with patterns found among the evolved giants of these clusters. The assumption that these low mass cluster stars are incapable of both deep dredge-up and significant CNO nucleosynthesis while on the main sequence leads to the possibility that the early cluster material was at least partially inhomogeneous in these elements or that some form of modification of these elements has taken place within the cluster. Suggested culprits include mass-loss from intermediate mass asymptotic giant branch stars, novae, and supernovae ejecta (see Smith & Kraft 1996, and Cannon et al. 1998 for an excellent discussion of these possibilities).
Thus the observed light element inhomogeneities imply that there is some aspect of the structure of the evolving cluster giants which remains poorly understood (the deep mixing mechanism), that the early proto-clusters may have been far less homogeneous, that intermediate mass stars may have played a greater role in setting the composition of the present day low mass stars than previously thought, etc. Indeed, the evidence sited in the reviews above have lead many investigators to suggest that a combination of processes are responsible, i.e., many clusters contain star-to-star inhomogeneities established early in their histories which have been further altered by deep mixing during RGB ascent. This of course greatly exacerbates the problem as a knowledge of the composition of the more easily observed bright red giants will not tell the whole story of their chemical history - one must also understand the makeup of the main sequence stars.
Cohen (1999a,b) measured CH and CN indices for a large sample of main sequence stars in each of M71 and M13. In the case of M71, clear variations of both indices were seen at a fixed luminosity among the main sequence stars which are significantly larger than the observational uncertainties. Cohen found that these indices are each to first order bimodal and they are anti-correlated. There are approximately equal numbers of CN weak/CH strong and CN strong/CH weak main sequence stars in M71. At least qualitatively, these patterns are very similar to those observed among the bright M71 red giants. In the case of M13, which is metal poor compared to M71 by a factor of , the observed indices are much weaker, and variability from star to star was not clearly detected in either the CH or the CN index.
The purpose of the present paper is to determine the range of C and N abundances which will reproduce the behavior observed in the M71 main sequence stars and to compare this with the range in abundances found on the giant branch of M71 by Briley, Smith & Claver (2001). For M13, we examine the detectability of star-to-star variations in the observed CH and CN indices for the sample of main sequence stars of Cohen if the behavior of C, N and O is similar to that found among its giants and attempt to constrain the allowed range of C, N, and O abundances.
The approach adopted here is to represent the sample of globular cluster main sequence stars by a series of model atmospheres taken from isochrones appropriate for M13 and for M71 across the relevant luminosity range. We demonstrate the validity of the models by comparing colors generated using them to the observed color magnitude diagrams (CMDs). These models are then used to generate synthetic spectra from which CH and CN indices are measured. The model C, N, and O abundances are then adjusted in an attempt to reproduce the behavior of the observed stars.
2 THE ADOPTED MODELS AND VERIFICATION OF THEIR VALIDITY
The first step in our analysis is to demonstrate that the adopted model points are a satisfactory match to the observed stars in the region of the main sequence turnoff for M13 and for M71. The isochrones used here are from the O-enhanced grid of Bergbusch & VandenBerg (1992).
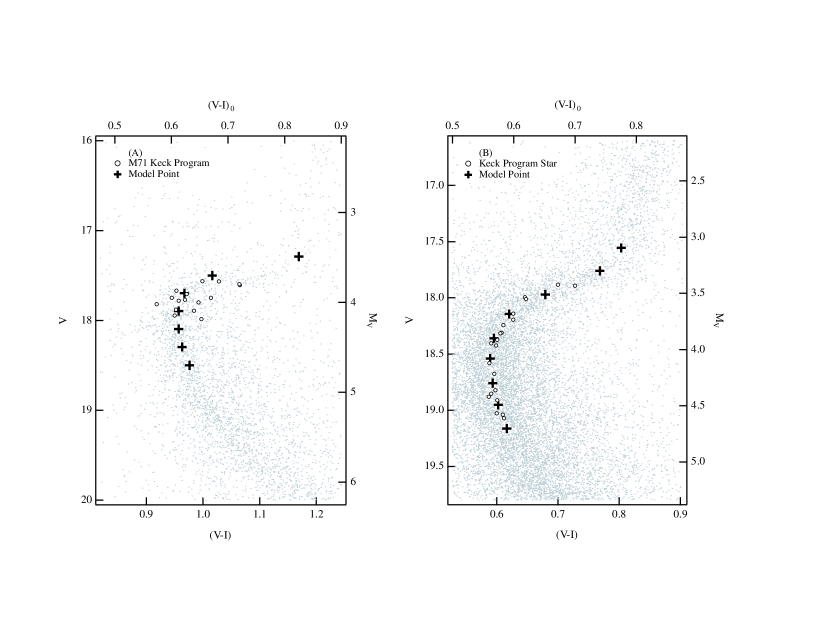
Assuming a metallicity of = 0.80 for M71 (Sneden et al. 1994), seven /log g points were chosen from the 14 Gyr = 0.78 isochrone spanning a range in luminosity of . Model atmospheres were calculated for each of these points using the MARCS program (Gustafsson et al. 1975) which were then fed into the synthetic spectrum generating program SSG (Bell & Gustafsson 1978; Gustafsson & Bell 1979; Bell & Gustafsson 1989; Bell, Paltoglou, & Tripicco 1994) using the linelist of Tripicco & Bell (1995). Each synthetic spectrum was initially computed from 3,000 to 12,000Å in 0.1Å intervals and convolved with filter curves as described in Gustafsson & Bell (1979) and Bell & Gustafsson (1989) to yield colors appropriate to each model. These colors are listed in Tables 1 and 2. Figure 1(a) compares the isochrone colors with the , photometry (corrected for reddening) of Stetson (2000) of 4000 stars with in M71. A distance of 3.9 kpc and a reddening of E() = 0.25 mag was assumed from the on line compilation of Harris (1996).
A similar approach was followed in the case of M13 where a metallicity of = 1.51 (Kraft et al. 1992) was assumed. Model points were chosen from the 16 Gyr = 1.48 grid. The corresponding colors are given in Table 2 and plotted in Figure 1(b) with the , photometry of Stetson (2000). For M13 a distance of 7.2 kpc and a reddening of E() = 0.02 was used (Harris 1996), however, an additional 0.11 magnitudes in (i.e., a 5% increase in distance) was required for the best fit to the observed CMD.
Also plotted in both panels of Figure 1 are the locations of the Keck program stars in the cluster CMDs. The isochrones and models adopted for M71 and M13 are shown to be a good match, with the spread about the isochrone consistent with observational errors in the case of M13. For M71, the spread is broader, but still consistent with a combination of observational errors, reddening variations at a level of 10% of the total reddening (see Cohen & Sleeper 1995), and possibly a few non-members.
3 THE OBSERVED CN AND CH INDICES
The I(uvCN) index employed by Cohen (1999a,b) measured the flux removed by the 3883Å CN feature as a fraction relative to a nearby single-side continuum bandpass. Unfortunately, the observed spectra are not flux calibrated and therefore include the signature of the instrumental response. The affect of this is to cause offsets in one-sided indices such as I(uvCN) (although we note that for comparisons between stars of similar luminosities, this is not an issue as they all share similar offsets).
To facilitate removal of this signature and for comparisons with synthetic spectra, we have re-measured the uv CN feature using the S(3839) index (Norris et al. 1981). Because S(3839) is the logarithm of the ratio between a comparison bandpass and a CN “feature” bandpass, slopes induced by instrumental response result in constant zero-point shifts in the indices which can be quantified and removed. For the present observations, the shift in the index was measured using the continuum fitting routine of IRAF’s “splot” package. Each spectrum was fitted with a third order cubic spline and the S(3839) index computed from each fit. The resulting offset was 0.1800.008 and 0.1780.007 for the M71 and M13 spectra, respectively. For the double sided I(CH) (Cohen 1999a), a much smaller shift of 0.0090.003 was found in the case of M71 and 0.0040.006 in M13. As the fits also include the actual stellar continua, the same procedure was adopted for the synthetic spectra as well (we are essentially comparing indices of flattened spectra). One sigma errors in S(3839) were also calculated from Poisson statistics in the feature and continuum bandpasses.
4 THE COMPUTATION OF THE CN AND CH INDICES FROM SYNTHETIC SPECTRA
For each of the model /log g points taken from the isochrones, high resolution synthetic spectra were generated using the SSG code. Scaled solar abundances based on the metallicities above were adopted with differing C/N/O abundances (discussed below). These spectra were computed from 3,000 to 6,000Å at a wavelength step size of 0.02Å and a microturbulent velocity of 1.5 km/s. They were then convolved with a Gaussian of width 8Å to match the resolution of the observed spectra. S(3839) and I(CH) indices were measured from the smoothed spectra and are given in Tables 1 and 2. As with the observed spectra, the smoothed synthetic spectra were imported into IRAF and the continuum fitted with the splot routine. Indices measured from the resulting fits yielded a zero point shift of 0.0250.001 in S(3839) for both M71 and M13 spectra.
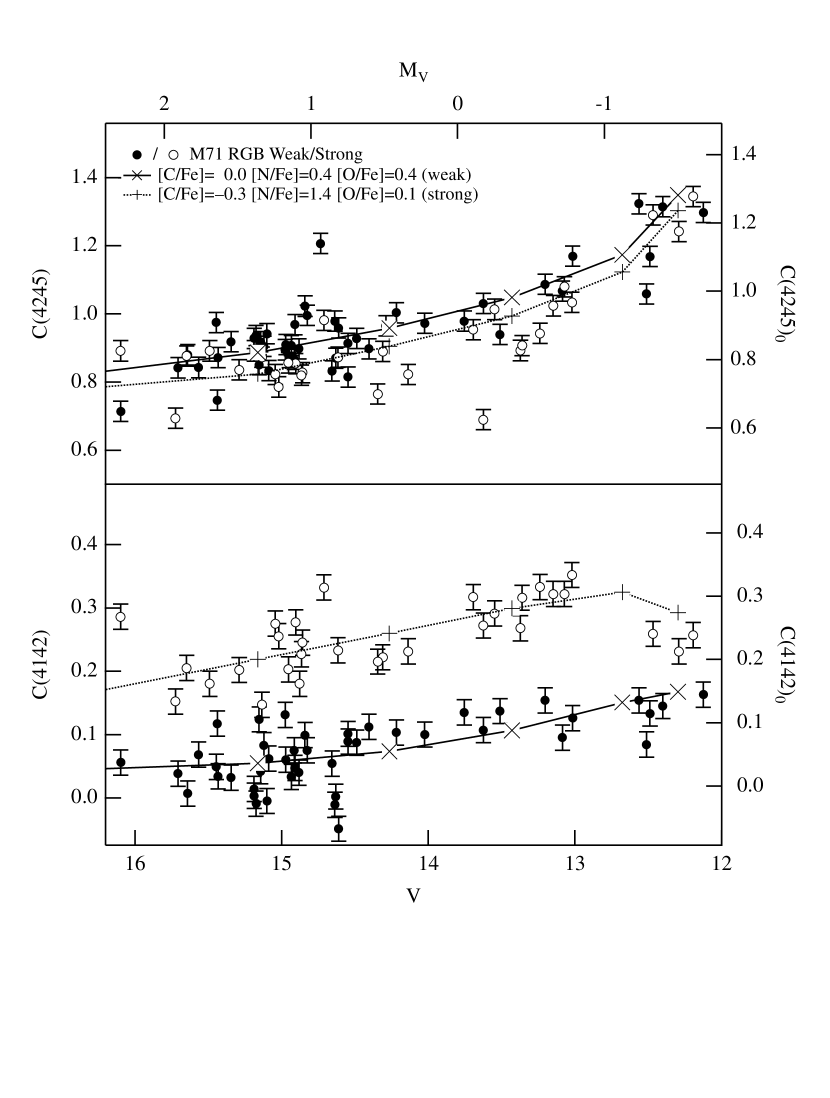
The C/N/O abundances used in the calculation of synthetic spectra for M71 are based on abundances used by Briley et al. (2001) in a DDO photometric study of M71 bright giants. Using CN sensitive C(4142) and CH sensitive C(4245) colors it was found that the locus of CN-weak giants of M71 were best fit by =0.0, =+0.4, =+0.4 and by =0.3, =+1.4, =+0.2 for the CN-strong stars. To aid in comparison with the present main-sequence stars, their results are shown in Figure 2.
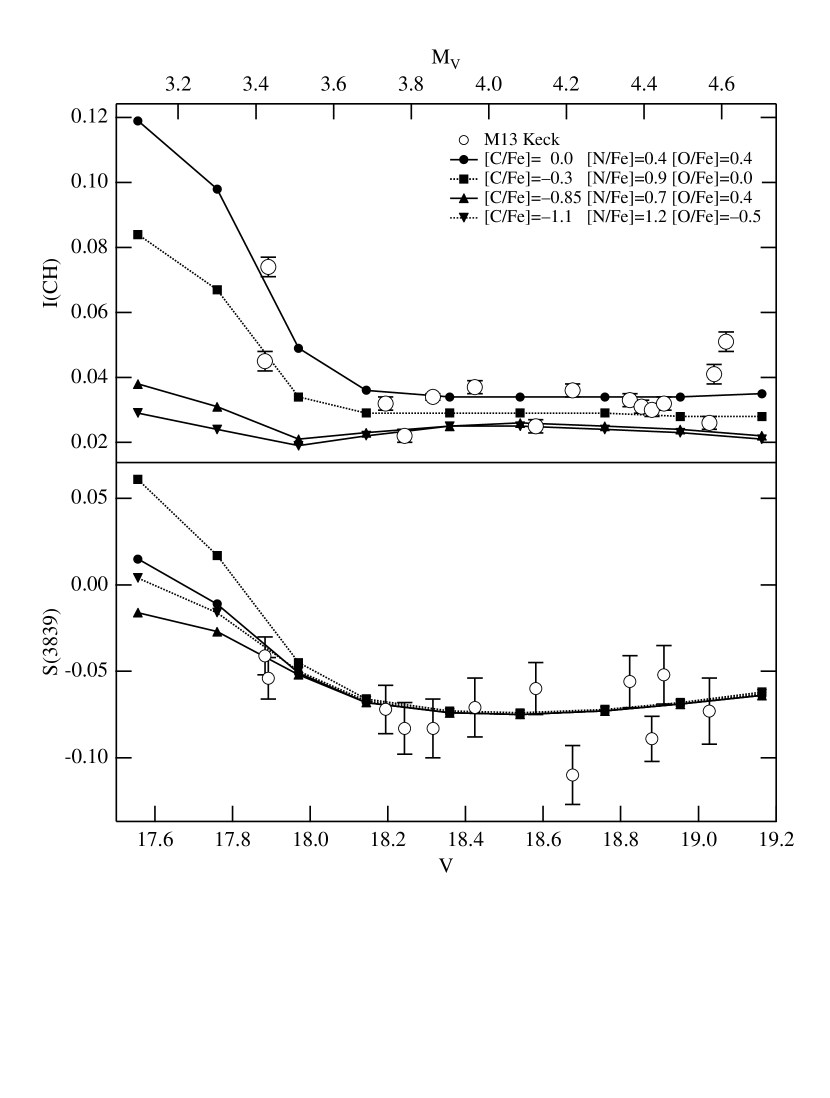
For M13, Smith et al. (1996) performed an analysis of CN and CH band strengths in eleven of the cluster’s bright giants. Their resulting abundances centered roughly about =0.85, =+0.7, =+0.4 and =1.1, =+1.2, =0.5 for the CN-weak and strong giants respectively and a set of models with these compositions have been calculated here. However, the low [C/Fe] abundances of the evolved giants also suggests a deep mixing process may have altered the initial C/N/O abundances of these stars. As a test of this possibility, we have also calculated a set of models assuming arbitrary “pre-mixing” abundances of =0.0, =+0.4, =+0.4 and =0.3, =+0.9, =0.0 (with the requirement that the total number of C/N/O atoms remain constant).
5 DISCUSSION
5.1 M71
The observed CN and CH band strengths for 77 M71 main-sequence stars are plotted against their brightness in (see Cohen 1999b) in Figure 3. The stars have arbitrarily been divided into CN-weak and strong groups based on their S(3839) indices. As was pointed out by Cohen (1999b), the sample falls into a bimodal distribution with a pronounced CN/CH anticorrelation. This pattern is evident among the more luminous giants of the cluster as well (see Figure 2). Moreover, the relative numbers of CN-weak and strong stars are remarkably similar: for the bright giants, 48 are CN-weak and 30 are strong. Among the main-sequence stars, 44 are weak and 31 are strong. Three stars marked as diamonds in Figure 3 have anomalously large CN indicies. Based on radial velocities from higher dispersion spectra to be presented in a later paper, one of these three stars (star 1951333+184107) is not a member of M71 and star 1951311+183525 is probably not a member.
Also plotted in Figure 3 are the indices measured from the synthetic spectra described above using the same set of C/N/O abundances which fit the giants in Figure 2 (the zero point shifts in the indices have been applied). The agreement between the fits of the CN and CH sensitive indices in both the giants and main-sequence stars is remarkably good, suggesting similar C and N abundances in the two samples and little change in these abundances over the six magnitudes observed.
Similar results have also been found among the giants and main-sequence stars of 47 Tucanae, a nearby cluster of comparable metallicity to M71. The C/N/O abundances used here are very close to those used by Briley (2001) to fit the CN and CH band strengths of 283 giants, the only difference being an of +0.45 assumed for both CN-weak and CN-strong giants in 47 Tuc. Among the main-sequence stars, spectroscopic abundance studies have also yielded C and N abundances similar to those found among the 47 Tuc giants (see Briley et al. 1994 and Cannon et al. 1998).
Thus both M71 and 47 Tuc, two relatively metal-rich clusters, appear to show little evidence of change in C/N/O abundances from the upper main-sequence through the bright giants. This is in striking contrast to the significant (factor of ten) C depletions with luminosity seen among the more metal-poor clusters such as M92, M15, and NGC 6397 (see references in the reviews mentioned above). While at first appearing contradictory, the difference may well be the result of the higher H-burning shell temperatures and smaller mean molecular weight gradients found in more metal-poor stars (as discussed by Sweigart & Mengel 1979, Charbonnel 1995, Cavallo et al. 1996, 1998, and others) which should lead to increasingly significant C/N/O abundance changes due to dredge-up with decreasing metallicity. The present results then do not rule out the operation of deep dredge-up in evolving cluster giants, particularly in metal-poor stars.
However, it is clear the process responsible for the C and N inhomogeneities in M71 and 47 Tuc cannot be deep mixing during the ascent of the RGB: the bulk of the inhomogeneities are in place at the main sequence turn-off. Moreover, the shallow convective zones and low rates of CN-cycle processing in low mass cluster main sequence stars make mixing on the main sequence an unlikely scenario. One is then left with the possibilities of a primordial inhomogeneity or some pollution mechanism operating early in the cluster histories. In this regard, M71 provides an interesting data point as it is almost four magnitudes fainter in luminosity than 47 Tuc (Harris 1996) and would be required to be considerably more massive in the past (not an unlikely scenario given M71’s low galactic latitude) if the observed inhomogeneities are indeed due to retained gas from intermediate mass AGB stars.
5.2 M13
The situation in M13 is considerably different from M71. With its lower metallicity, both the hotter main-sequence turn-off and lower numbers of both C and N atoms conspire to greatly reduce CN formation. This can be seen in Figure 4 where the S(3839) indices of the program stars with V photometry of Stetson (2000) are plotted against the indices from the synthetic spectra. Despite significant differences in the C and N abundances used in the models, the 3883Å CN band is in all cases too weak to be detected and cannot be used to constrain N abundance variations among the M13 main-sequence stars. There does appear to be some CH formation, however the band is too weak to be useful at the signal level of our spectra at depletions of or greater at the main sequence turn-off.
We do note the two more luminous M13 stars (at = 17.9) which do apparently exhibit a 0.3 dex difference in . Their C abundances are also substantially greater than C abundances found among eleven bright M13 giants by Smith et al. (1996) which averaged near This result, although only based on two stars, is consistent with an episode of deep mixing taking place on the M13 RGB as has also been suggested by the high resolution Na study of Pilachowski et al. (1996).
Acknowledgements.
We are very grateful to Peter Stetson for providing access to his photometric database. We also wish to express our thanks to Roger Bell whose SSG code was instrumental in this project. Partial support was provided by a Theodore Dunham, Jr. grant for Research in Astronomy and the National Science Foundation under grant AST-9624680 to MMB and grant AST-9819614 to JGC.6 APPENDIX: COORDINATES FOR THE M13 AND M71 MAIN SEQUENCE STARS
During the course of this work, the coordinates published in Cohen (1999a,b) for the main sequence stars were checked against a set of coordinates tied to the USNO APM survey (Monet et al. 1999). For M71, the published coordinates are within 1.5 arcsec of the astrometric coordinates. For M13, the published coordinates for objects in Field 2 are of comparable accuracy. However, the coordinates published in Cohen (1999a) for main sequence stars in field 1 of M13 are 0.3 sec of time West and 7 arc sec South of the astrometric coordinates.
References
- (1) Bell, R. A. & Gustafsson, B. 1978, A&AS, 34, 229
- (2) Bell, R. A. & Gustafsson, B. 1989, MNRAS, 236, 653
- (3) Bell, R. A., Hesser, J. E., & Cannon 1983, ApJ, 269, 508
- (4) Bell, R. A., Paltoglou, G., & Tripicco, M. J. 1994, MNRAS, 268, 771
- (5) Bergbusch, P. A & Vandenberg, D. A., 1992, ApJS, 81, 163
- (6) Briley, M. M., Hesser, J. E. & Bell, R. A. 1991, ApJ, 373, 482
- (7) Briley, M. M., Hesser, J. E., Bell, R. A., Bolte, M, & Smith, G H. 1994 AJ, 108, 2183
- (8) Briley, M. M., Smith, G. H., & Claver, C. F. 2001, AJ, in press
- (9) Briley, M. M., Smith, V. V., Suntzeff, N. B., Lambert, D. L., Bell, R. A. & Hesser, J. E. 1996, Nature, 383, 604
- (10) Cannon, R.D., Croke, B.F.W., Bell, R.A., Hesser, J.E. & Stathakis, R.A., 1998 MNRAS, 298, 601
- (11) Cavallo, R. M., Sweigart, A. V. & Bell, R. A. 1996, ApJ, 464, L79
- (12) Cavallo, R. M., Sweigart, A. V. & Bell, R. A. 1998, ApJ, 492, 575
- (13) Charbonnel, C., 1994 A&A, 282, 811
- (14) Charbonnel, C., 1995 ApJ, 453, L4
- (15) Cohen, J. G., 1999a AJ, 117, 2428
- (16) Cohen, J. G., 1999b AJ, 117, 2434
- (17) Cohen, J. G. & Sleeper, E. C. 1995, AJ, 109, 242
- (18) Gustafsson, B., & Bell, R. A. 1979, A&A, 74, 313
- (19) Gustafsson, B., Bell, R. A., Eriksson, K., & Nordlund, Å 1975, A&A, 42, 407
- (20) Harris, W. E. 1996, AJ, 112, 1487
- (21) Hesser, J. E. 1978, ApJ, 233, L117
- (22) Hesser, J. E. & Bell, R. A. 1980, ApJ, 238, L149
- (23) Kraft, R. P. 1994, PASP, 106, 553
- (24) Kraft, R. P., Sneden, C., Langer, G. E., & Prosser, C. F. 1992, AJ, 104, 645
- (25) Monet, D. et al. 1999, USNO-A2.0 Catalog
- (26) Norris, J., Cottrell, P. L., Freeman, K. C., & Da Costa, G. S. 1981, apj, 244, 205
- (27) Pinsonneault, M. 1997, ARA&A, 35, 557
- (28) Smith, G. H., & Kraft, R. P. 1996, PASP, 108, 344
- (29) Smith, G. H., Shetrone, M. D., Bell, R. A., Churchill, C. W., & Briley, M. M. 1996, AJ, 112, 1511 Sneden, C., Kraft, R. P., Langer, G. E., Prosser, C. F., & Shetrone, M. D. 1994, /aj, 107, 1773
- (30) Stetson, P. B. 2000, PASP, 112, 925
- (31) Suntzeff, N. B, & Smith, V. V. 1991, ApJ, 381, 160
- (32) Sweigart, A. V. & Mengel, J. G. 1979, ApJ, 229, 624
- (33) Tripicco, M. J., & Bell, R. A. 1995, AJ, 110, 3035
| Log g | aa=0.0, =+0.4, =+0.4 | S(3839)aa=0.0, =+0.4, =+0.4 | bb=0.3, =+1.4, =+0.2 | S(3839)bb=0.3, =+1.4, =+0.2 | ||||
|---|---|---|---|---|---|---|---|---|
| 6010 | 4.40 | 4.698 | 0.632 | 4.387 | 0.150 | 0.023 | 0.104 | 0.189 |
| 6062 | 4.34 | 4.495 | 0.619 | 4.191 | 0.137 | 0.015 | 0.095 | 0.160 |
| 6084 | 4.28 | 4.295 | 0.613 | 3.994 | 0.131 | 0.011 | 0.091 | 0.145 |
| 6077 | 4.20 | 4.096 | 0.613 | 3.795 | 0.129 | 0.011 | 0.090 | 0.144 |
| 6024 | 4.11 | 3.898 | 0.623 | 3.592 | 0.137 | 0.018 | 0.095 | 0.166 |
| 5813 | 3.96 | 3.700 | 0.672 | 3.369 | 0.180 | 0.062 | 0.124 | 0.276 |
| 5235 | 3.66 | 3.490 | 0.825 | 3.078 | 0.257 | 0.253 | 0.192 | 0.491 |
| Log g | aa=0.0, =+0.4, =+0.4 | S(3839)aa=0.0, =+0.4, =+0.4 | bb=0.3, =+0.9, =+0.0 | S(3839)bb=0.3, =+0.9, =+0.0 | cc=0.85, =+0.7, =+0.4 | S(3839)cc=0.85, =+0.7, =+0.4 | dd=1.1, =+1.2, =-0.5 | S(3839)dd=1.1, =+1.2, =-0.5 | ||||
|---|---|---|---|---|---|---|---|---|---|---|---|---|
| 6189 | 4.42 | 4.703 | 0.590 | 4.420 | 0.042 | -0.088 | 0.035 | -0.086 | 0.029 | -0.088 | 0.028 | -0.087 |
| 6247 | 4.36 | 4.493 | 0.576 | 4.217 | 0.041 | -0.093 | 0.035 | -0.092 | 0.031 | -0.093 | 0.030 | -0.093 |
| 6286 | 4.30 | 4.299 | 0.567 | 4.027 | 0.041 | -0.097 | 0.036 | -0.096 | 0.032 | -0.097 | 0.031 | -0.097 |
| 6294 | 4.22 | 4.081 | 0.563 | 3.811 | 0.041 | -0.099 | 0.036 | -0.098 | 0.033 | -0.099 | 0.032 | -0.099 |
| 6256 | 4.14 | 3.899 | 0.569 | 3.626 | 0.041 | -0.098 | 0.036 | -0.097 | 0.032 | -0.098 | 0.032 | -0.098 |
| 6132 | 4.02 | 3.684 | 0.594 | 3.398 | 0.043 | -0.092 | 0.036 | -0.090 | 0.030 | -0.092 | 0.029 | -0.091 |
| 5874 | 3.87 | 3.510 | 0.653 | 3.195 | 0.056 | -0.075 | 0.041 | -0.069 | 0.028 | -0.076 | 0.026 | -0.074 |
| 5512 | 3.66 | 3.300 | 0.742 | 2.938 | 0.105 | -0.035 | 0.074 | -0.007 | 0.038 | -0.051 | 0.031 | -0.040 |
| 5383 | 3.53 | 3.096 | 0.777 | 2.717 | 0.126 | -0.009 | 0.091 | 0.037 | 0.045 | -0.040 | 0.036 | -0.020 |