The 2dF QSO Redshift Survey - V. The 10k catalogue
Abstract
We present a catalogue comprising over 10000 QSOs covering an effective area of 289.6 deg2, based on spectroscopic observations with the 2-degree Field instrument at the Anglo-Australian Telescope. This catalogue forms the first release of the 2-degree Field QSO Redshift Survey. QSO candidates with were obtained from a single homogeneous colour-selected catalogue based on APM measurements of UK Schmidt photographic material. The final catalogue will contain approximately 25000 QSOs and will be released to the public at the end of 2002, one year after the observational phase is concluded.
keywords:
quasars: general – galaxies: Seyfert – galaxies: active – stars: white dwarfs – catalogues – surveys1 Introduction
The aim of the 2dF QSO Redshift Survey (2QZ) is to measure redshifts for optically-selected QSOs with and . The spectra have been obtained with the 2-degree Field (2dF) instrument (Lewis, Glazebrook & Taylor 1998) on the Anglo-Australian Telescope (AAT). The final catalogue will represent a factor increase in the number of QSOs identified in a single homogeneous survey to this magnitude limit (c.f. The Durham/AAT survey; Boyle et al. 1990). The primary science goal of this survey is to obtain an accurate measure of the large-scale structure in the Universe out to high redshifts, , and large scales, h-1Mpc, via the study of QSO clustering.
As of January 2001, the survey is over 60 per cent complete. To expedite community access to the 2QZ, we are releasing the catalogue in two stages. This paper describes the first release containing 20590 objects, including 11005 QSOs, for which we have obtained 2dF spectra. The release represents the ‘most complete’ subset of the entire survey observed prior to December 2000 – containing all fields for which we have achieved a spectroscopic completeness of 85 per cent or greater. This catalogue has been used to derive results on the QSO correlation function (Croom et al. 2001, Paper II), the power spectrum (Hoyle et al. 2001, Paper IV) and the composite spectrum (Smith et al. 2001, Paper VI, in preparation). Results on the QSO luminosity function from the 2QZ (Boyle et al. 2000, Paper I) were based on an earlier version of the catalogue comprising QSOs. When complete the catalogue will contain approximately 48000 objects, including 25000 QSOs. The final catalogue will be released at the end of 2002, one year after the observational phase of the survey is concluded, currently planned for the end of 2001.
This paper describes the first release catalogue, hereinafter the 2QZ 10k catalogue, of the 2QZ. Sections 2 and 3 describe the spectroscopic observations and catalogue format. Section 4 then discusses estimates of the catalogue quality, and presents a new estimate of the QSO luminosity function.
2 Spectroscopic Observations
2.1 The candidate catalogue
QSO candidates with were selected for observation with 2dF from measurements of UK Schmidt photographic material. Full details are given in Smith et al. (2001, Paper III). The 2QZ area comprises 30 UKST fields, arranged in two declination strips centred on and . The strip extends from = 21h40 to = 3h15 in the South Galactic Cap and the equatorial strip from = 9h50 to = 14h50 in the North Galactic Cap. When complete, the total survey area will be 740 deg2 allowing for regions of sky excised around bright stars. The 2QZ area forms an exact subset of the 2dF Galaxy Redshift Survey (2dFGRS; see Colless 1998) area. 2dF observations of the 2QZ were therefore combined with those of the 2dFGRS. A tiling algorithm devised by the 2dFGRS team was used to determine the positions of individual 2dF field centres in order to obtain near-complete spectroscopic coverage (95 per cent for galaxies, 99 per cent for QSO candidates) for the 2QZ and 2dFGRS targets in the survey area with the minimum number of individual 2dF pointings.
The 2QZ colour selection is designed to be largely complete ( per cent) for QSOs with . At higher redshifts, , the photometric completeness of the survey gradually drops, with the highest redshift QSOs in the 2QZ being found at . Paper I provides an estimate of the completeness contours based on selection as a function of and . The stellar morphological criterion also causes incompleteness at low redshifts. This is more difficult to estimate but it is likely to cause some form of incompleteness up to . The photometric errors in the magnitudes have already been discussed extensively in Paper III. They are approximately constant over the magnitude range of the survey , . Independent CCD sequences have been used to calibrate each UKST field (Boyle, Shanks & Croom 1995; Croom et al. 1999).
2.2 2dF observations
Observations of the 2QZ began in October 1997. This initial release is based on 304 individual 2dF fields observed over the period October 1997 to November 2000. The two 2dF spectrographs each contain one 10241024 Tektronix CCD with m pixels and are each fed by 200 optical fibres. 2QZ objects were observed with 2dF using the low resolution 300B gratings, providing a dispersion of 178.8Å mm-1 (4.3Å pixel-1) and a resolution of Å ( pixels FWHM) over the range 3700Å– 7900Å. Each optical fibre has a diameter on the sky of at the centre of a field, falling to at the edge of the field. The fibre spectra are projected to pixels (FWHM) on the detector and are each separated by pixels. Each field received an approximately 55 minute integration (3 1100 sec), combined with a flat-field, used to determine the positions of the fibre spectra on each CCD frame, and a CuArHe arc for wavelength calibration. The fields were observed in a wide variety of seeing conditions (1 arcsec – 2.5 arcsec FWHM) and transparency (details of conditions are included in the data release). Where possible, integration times were adjusted to match conditions. However, the instrumental requirement to observe 2dF fields at the hour angle for which they had been configured limited the opportunity to extend integration times significantly. As a result the quality of data can vary significantly from field to field. We have attempted to minimize the effects of this variation in the 10k release by only including objects from fields where at least 85 per cent of the objects observed yielded a spectroscopic identification.
Data from 2dF was reduced using the pipeline reduction system 2DFDR [Bailey et al. 2001]. CCD frames from each spectrograph were reduced separately. Following bias removal, fibre extraction and wavelength calibration, the transmissions of each fibre were normalized using the relative strengths of the night sky lines in each fibre spectrum. Sky subtraction was then done by subtracting a median sky spectrum determined from up to 20 sky-dedicated fibres in each frame (the minimum number of sky fibres used was six per spectrograph).
3 The catalogue
3.1 Spectroscopic identification
Reduced spectra of QSO candidates were then passed through a non-interactive program AUTOZ (Miller et al. in preparation) to classify individual objects and measure a redshift for those that turned out to be QSOs or galaxies. The colour-selection process used to generate the input catalogue has non-negligible contamination (originally estimated to be per cent, see Paper III) from galactic stars (subdwarfs and white dwarfs) and compact emission line galaxies. AUTOZ fits a variety of templates to each observed spectrum. These templates include QSOs, both ‘normal’ and broad absorption line (BAL) QSOs, emission line galaxies and a library of stellar spectra including main sequence types from O to M and DA, DB and DZ white dwarfs. The AUTOZ program uses the fact that data are collected on a large number of different objects (QSOs, galaxies and stars) at once ( per spectrograph) to estimate the wavelength dependent sensitivity and noise. These terms are then taken into account when carrying out a fit to the templates to derive the best fit model.
In general AUTOZ produces reliable identifications for a wide variety of the objects. However, we have carried out manual checks of all spectra in the survey to identify the small fraction of objects with peculiar or low signal-to-noise (S/N) spectra which AUTOZ had difficulty in identifying correctly. Each member of the 2QZ team independently examined 5000–6000 spectra by eye and corrected any AUTOZ identifications that were clearly in error. As a further double-check, two members of the survey (BJB and SMC) re-examined all spectra to ensure a degree of homogeneity in this re-classification procedure.
The sources are classified into six categories:
| QSO | Spectrum with one or more broad (km s-1) |
| emission lines. | |
| NELG | Galaxy spectrum with one or more narrow |
| (km s-1) emission lines. | |
| gal | Galaxy spectrum with no emission lines. |
| star | Galactic star spectrum. |
| cont | High S/N spectrum (S/N) with no |
| identifiable emission or absorption features. | |
| ?? | Unclassifiable spectrum due to low S/N. |
The quality of the identification and redshift estimation is divided into three levels of confidence:
-
•
Quality 1: High quality identification or redshift
-
•
Quality 2: Low quality identification or redshift
-
•
Quality 3: No classification or redshift assignment
A quality flag is assigned independently to both the identification and redshift of an object. Approximately 6 per cent of objects were found to have low quality identifications (quality 2), these objects appear in the final catalogue with a ‘?’ against their identification (apart from objects identified as cont, which all have quality 2 identifications).
For each 2dF pointing we calculate a spectroscopic completeness, being the ratio of objects observed in the field with quality 1 or quality 2 identifications to the total number of spectroscopically observed objects. Stars are likely to dominate the unidentified population, at least for low levels of incompleteness. This is because their weak spectral features make them very difficult to identify from low S/N spectra. In contrast, QSOs with broad emission lines should be amongst the easiest class of objects to identify from low S/N spectra. To establish the spectroscopic incompleteness level at which we also begin to lose significant numbers of QSOs, we compared the normalized QSO number-magnitude relation obtained from fields with greater than 95 per cent completeness to those from fields with completenesses in the range 90 – 95 per cent, 85 – 90 per cent, 80 – 85 per cent and 75 – 80 per cent. Using a Kolmogorov-Smirnov test, we found that the showed a significant difference (at the 99 per cent confidence level) for fields with lower than 85 per cent completeness.
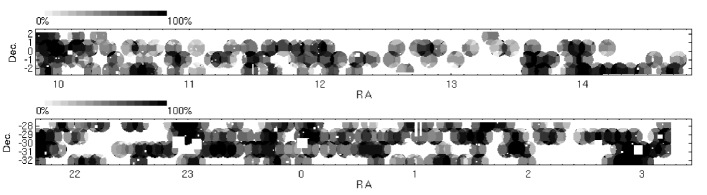
We therefore chose to include only those fields with spectroscopic completenesses of 85 per cent or greater in this initial release. This corresponds to 233 2dF fields. The coverage provided by these fields is indicated in Fig. 1 (taken from Paper II). Note that many areas of sky have not yet received their full complement of 2dF pointings in the adaptive tiling strategy. As a result, the current survey exhibits a spatially-dependent observational incompleteness. Hence, although these fields have 85 per cent or greater identification rate, there remains a still larger fraction of incompleteness due to sources which have yet to be observed. The 2QZ coverage map shown in Fig. 1 (released in digital form as a survey product) can be used to account for this. This coverage map is produced by calculating the ratio of spectroscopically observed objects to input catalogue objects in each region defined by the intersection of 2dF pointings. This distribution is then pixelized using arcminute pixels to produce a final observational completeness map.
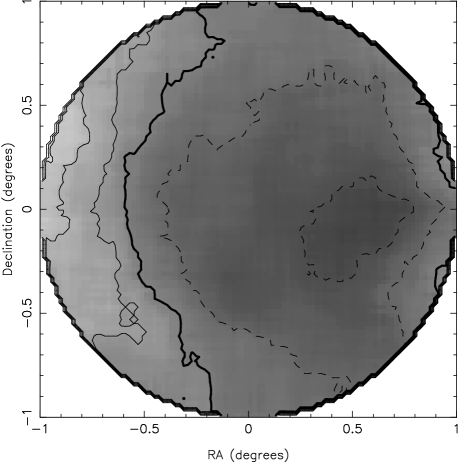
We also check whether there is any variation in the catalogue over the area of one 2dF field. In Fig. 2 we plot the mean difference (mag) between the catalogue magnitude and a -band magnitude estimated from the spectroscopic data averaged over all the 2dF fields in the 10k catalogue (note that the averaging is carried out in flux, not magnitude). This is only a relative difference as the zero-points of the spectroscopic magnitudes are derived from the mean differences in each 2dF field. A positive mag indicates a spectroscopic magnitude which is fainter than the catalogue magnitude. We see that there is deficit of flux at the edge of the field (particularly on the left side). This is probably due to residual errors that has not been completely accounted for by the 2dF astrometric model. This should not significantly affect the spatial distribution of QSOs in our sample for two reasons. First, the tiling algorithm used to place the fields produces significant overlap so that any effect in a 2dF field area will be blurred out. Second, if we measure the identification rate as a function of field position, the only significant variation is at radii . On scales smaller than this the mean completeness is per cent. At the extreme edges of the field, radii , the mean completeness only drops to per cent. This variation in completeness, internal to 2dF fields is of the same order as the variations in completeness between 2dF fields.
3.2 10k catalogue description
| Identification | Number | Quality 1 | Quality 2 | Percentage |
|---|---|---|---|---|
| QSO | 11005 | 10689 | 316 | 53.4 |
| NELG | 2104 | 2059 | 45 | 10.2 |
| star | 5842 | 5081 | 761 | 28.4 |
| gal | 44 | 37 | 7 | 0.2 |
| cont | 108 | – | 108 | 0.5 |
| ?? | 1487 | – | – | 7.2 |
| Total | 20590 | 17866 | 1237 |
Based on the criteria defined above, the initial release of the 2QZ catalogue contains entries for 20590 objects, including 11005 QSOs. The composition of the 10k catalogue as a function of spectroscopic class is given in Table 1. As defined by the fraction of objects with quality 1 or 2 classifications, the mean overall spectroscopic completeness of the catalogue is 93 per cent. The effective area of the survey (after correction for the observational incompleteness) is 289.6 deg2. The distribution of sources as a function of magnitude is shown in Fig. 3a. QSOs dominate the source counts at all but the brightest magnitudes. The QSOs show a smooth redshift distribution over the full range of the survey, , with a maximum at the 2QZ median redshift (Fig. 3b).
The released catalogue is available as an ASCII file from http://www.2dfquasar.org. The catalogue format is given in Table 2. The first part of a catalogue entry contains details from the input catalogue, such as position and magnitude. We note in particular that sources which had only upper limits (i.e. non-detections) on the plates are also included in the catalogue and have a listed colour. In this case the colour term is , the being used to differentiate upper limits from normal colours (objects with real -band detections have colours in the range , while upper limits have ). The input catalogue information is followed by details of observations and identifications. In a number of cases ( objects, of the catalogue) we have two observations for a source. These are useful to assess the quality of the final catalogue (see below). The identification and redshift that we adopt is that with the lowest quality value (where the quality value is identification quality + redshift quality), and if there are equal quality values, the highest S/N. In all cases the final adopted ID is listed as observation #1, with the lower quality observation being listed as observation #2. Finally we also include cross-matches to selected other databases. Where a 2QZ source matches the position (to within ) of a previously known QSO/AGN in the catalogue of Véron-Cetty & Véron (2000) we include the previously known redshift. We also include radio fluxes at 1.4GHz from the NRAO VLA Sky Survey (NVSS; Condon et al. 1998) and X-ray fluxes from the ROSAT All Sky Survey (RASS; Voges et al. 1999; Voges et al. 2000), converting from RASS counts per second to flux (in erg s-1cm-2) by multiplying by . Lastly we include an estimate of the galactic reddening to each source taken from the work of Schlegel, Finkbeiner & Davis (1998).


| Field | Format | Description |
| Name | a20 | IAU format object name |
| RA | i2 i2 f5.2 | RA J2000 (hh mm ss.ss) |
| Dec | a1i2 i2 f4.1 | Dec J2000 (dd mm ss.s) |
| RA | f8.6 | RA J2000 (radians) |
| Dec | f9.6 | Dec J2000(radians) |
| f5.2 | magnitude | |
| f5.2 | colour | |
| f6.2 | colour [including upper limits as: ] | |
| i1 | Number of observations | |
| Observation # 1 | ||
| f5.3 | Redshift | |
| q1 | i2 | Identification quality 10 + redshift quality |
| ID1 | a11 | Identification |
| date1 | a8 | Observation date |
| fld1 | i4 | 2dF field number + spectrograph number |
| f6.2 | Signal-to-noise ratio in 4000–5000Å band | |
| Observation # 2 | ||
| f5.3 | Redshift | |
| q2 | i2 | Identification quality 10 + redshift quality |
| ID2 | a11 | Identification |
| date2 | a8 | Observation date |
| fld2 | i4 | 2dF field number + spectrograph number |
| f6.2 | Signal-to-noise ratio in 4000–5000Å band | |
| f5.3 | Previously known redshift (Véron-Cetty & Véron 2000) | |
| radio | f6.1 | 1.4GHz Radio flux, mJy (NVSS) |
| x-ray | f7.4 | X-ray flux, erg s-1cm-2 (RASS) |
| dust | f5.3 | (Schlegel et al. 1998) |
We do not distinguish between different narrow-emission-line galaxy classifications (e.g. LINER, Seyferts) in the catalogue. Also, the spectral coverage provided by 2dF limits our ability to detect broad MgII emission until . In some QSOs with , broad MgII is clearly detected with no corresponding broad H seen. Thus at lower redshifts, , some objects classified as NELGs on the basis of a narrow H line may exhibit broad MgII below the blue limit of the 2dF spectral window. For QSOs with , AUTOZ fits both ‘normal’ and BAL QSO templates. Objects identified as BALs are indicated by ‘QSO(BAL)’ in the identification column. However, due to the varied nature of BAL QSOs, this will not be a comprehensive list of BALs. A more detailed search for BALs has not yet been applied.
Within the objects we classify as stars, in the main we only give classifications for white dwarfs (WDs). We do not attempt spectral classification of main sequence stars. The WDs are mostly DAs with strong broad hydrogen Balmer absorption lines. At low S/N these can be confused with A stars. Only detailed fitting of the temperature and gravity of these stars can easily resolve this issue, and this is beyond the scope of the present paper. As well as DAs we also find a number of DB and DO WDs which are dominated by neutral and singly ionized helium respectively. A small number of DZs are also found, with broad calcium H and K absorption. The only other stellar types we classify are 6 emission line stars with strong hydrogen Balmer emission which we classify as CV (cataclysmic variable) and WD + M dwarf binary systems which are denoted as DA/M. We note that our code has been designed primarily to simply identify an object as a star (and therefore not a QSO), and that a more detailed analysis would no doubt provide more accurate classifications. The above classifications are denoted within the catalogue in parentheses after the main star identification [e.g. star(DB), star(CV)].
To allow others to carry out more detailed spectral analysis of both QSOs and other sources, spectra for all objects in the 2QZ 10k catalogue are provided as a primary data product in this release. This includes objects for which no identification could be made. Many of these are low S/N spectra, but objects also remained unclassified for a number of other reasons. Occasionally a damaged fibre will produce fringing which shows up as a strong oscillation as a function of wavelength, rendering the underlying spectrum unusable. Also badly subtracted night sky emission (and in some cases moonlight) can sometimes seriously affect our ability to identify an object. The spectra are available in FITS format from the same location as the catalogue. Fig. 4 shows some example spectra from the 10k catalogue. Figs. 4a and b are randomly selected QSO spectra. Figs. 4c-f show a range of peculiar spectra. Fig. 4c shows narrow emission lines implying a redshift of and broad emission lines suggesting a redshift of . This appears to be a superposition of a QSO and a NELG, and as such is a potential gravitational lens. Fig. 4d shows the spectrum of a starburst + QSO, a less extreme version of the post-starburst object found in the cross-matching of the 2QZ and the NVSS by Brotherton et al. (1999). Fig. 4e is a rare carbon (DQ) white dwarf and Fig. 4f is a white dwarf-M dwarf binary system.

4 Catalogue Quality
4.1 Identification
The overlap between the 2dF pointing has resulted in a number of objects in the 2QZ catalogue for which we have two independent 2dF observations. By comparing the identification/redshift estimate for different observations we can obtain an estimate of the reliability of the identification and accuracy of the redshift determination. For the 1019 objects with quality 1 or 2 identifications and more than one 2dF observations in fields included in the 10k catalogue, we find 87 whose identifications differ between the observations (excluding the 5 objects whose identification changed from QSO to NELG but with the same redshift). This corresponds to a mis-identification rate of 8.5 per cent. If we restrict our attention to those objects with quality 1 identifications for both observations, this mis-identification rate drops to 3.8 per cent (34 objects with different classifications out of 889 objects).
The mis-identification rate amongst class 2 identifications is higher. If we directly compare the identifications for those objects with a quality 2 identification from both observations, we find 8 objects with different identifications from a total sample of 22 objects; equivalent to a mis-classification rate of 36 per cent. Comparison between quality 1 observations and quality 2 observations gives similar results. Of the 108 objects given an identification quality of 1 in one observation and a quality of 2 in the other, 45 (42 per cent) changed their identification in the subsequent higher quality observation. Thus the reliability of quality 2 identifications is approximately 60 per cent.

A more quantitative measure of the quality of the spectrum (although not necessarily the reliability of the identification) is the signal-to-noise. If we restrict our comparison to objects where both spectra have a S/N per pixel, we find a overall mis-classification rate of 1.7 per cent (6 objects out of 359).
4.2 Redshift accuracy
We can also obtain an estimate of the reliability of the redshift determination from these repeat observations. For all quality 1 and 2 QSO, NELG or galaxy identifications there are 21 cases (out of 602 objects) where the redshift estimate differs by more than 5 per cent between the different observations. The comparison between the redshifts obtained from the different observations is shown in Figure 5. All objects with significantly different redshifts are classified as QSOs; in most cases the difference in the redshift estimate is caused by the incorrect identification of a single emission line seen in the QSO spectrum. In total there are 518 QSOs with two observations, thus the reliability rate for QSO redshifts is 97 per cent and effectively 100 per cent for NELGs and galaxies.
Excluding objects with incorrect redshifts due to the mis-identification of emission lines, the rms difference between the redshift measurements is .
We also compared our identifications with those objects which had been previously classified as QSOs. Based on positional matches with QSOs in the Véron-Cetty & Véron (2000) catalogue, we found that 331 objects in the 2QZ 10k catalogue had been previously identified as QSOs. These objects are flagged in the released catalogue (see Table 2). Of these, 305 were confirmed as QSOs by 2QZ. However, 33 QSOs were found to have redshifts which disagreed significantly between the 2QZ and previous estimates. Visual inspection of the 2QZ spectrum revealed that, in all but one case, the 2QZ redshift was secure (i.e. two or more strong emission lines correctly identified). The remaining 29 objects were not classified as QSOs in the 2QZ, these identifications included 7 stars (2 white dwarfs), 4 star?s, 3 NELGs, 1 cont, 1 cont?, 1 QSO? and 13 with unclassifiable spectra. Visual inspection of the quality 1 spectra confirmed the 2dF classification in all cases.
In summary, the comparison between independent observations of over 1000 objects in the 2QZ release (approximately 5 per cent of the catalogue) reveals the overall reliability of the identifications is over 90 per cent. For quality 1 classifications this figure is close to 97 per cent; for quality 2 classifications the reliability is approximately 60 per cent. The redshift reliability for QSOs is 97 per cent with an rms error in the redshift measurement of .

4.3 The 10k luminosity function
For completeness, we have also repeated the analysis of Paper I to derive a luminosity function (LF) of the QSOs in the 10k catalogue, including objects from the Large Bright Quasar Survey (LBQS; Hewett, Foltz & Chaffee 1995) at bright magnitudes. In total, 9633 QSOs with and (8743 from the 2QZ and 890 from the LBQS) were used to obtain the binned LF for an Einstein-de Sitter universe (km sMpc-1) which is shown in Fig. 6.
We also fit to this data set a two-power-law LF and pure luminosity evolution models with polynomial evolution in such that . The best-fit model has Mpcmag-1, , , , and (see Paper I). However, even this best-fit model is formally rejected at high significance ( per cent confidence) by the 2QZ data. A comparison between 2QZ data set used in the LF anlaysis and the best fit model is shown in Fig 7. This illustrates that while the overall fit of the model to the data set is good, the cause of the disagreement is a sharp peak in the redshift distribution of 2QZ QSOs at which cannot be matched by the evolution model. This is likely to be caused by systematic variations in our ability determine a QSO redshift. corresponds to the redshift where the CIV emission line moves into the observable wavelength range of 2dF. This strong emission line will increase the probability of obtaining a good quality identification and redshift.
The new measurement of the QSO LF demonstrates that studies such as these are now limited by the systematic errors, rather than Poisson errors from small numbers of objects. When the completed catalogue is released, we will provide independent measurements of these systematic effects, which can be derived from measurements of the efficiency of our automated classification code. We note that a preliminary estimate of completeness as a function of and redshift (used here and in Paper I) will be available electronically as part of the data release.

5 Data access
The 2QZ 10k catalogue and associated data products are available from http://www.2dfquasar.org along with basic tools to access and interrogate the catalogue. A CD-ROM containing the same data and tools is also available. Any authors using the 2QZ 10k catalogue should include the following acknowledgement: ‘The 2dF QSO Redshift Survey (2QZ) was compiled by the 2QZ survey team from observations made with the 2-degree Field on the Anglo-Australian Telescope’.
Acknowledgements
The 2QZ was based on observations made with the Anglo-Australian Telescope and the UK Schmidt Telescope. NL was supported by a PPARC studentship during the course of this work.
References
- [Bailey et al. 2001] Bailey J., Glazebrook K., Offer A., Taylor K., 2001, MNRAS submitted.
- [Boyle et al. 1990] Boyle B.J., Fong R., Shanks T., Peterson B.A., 1990, MNRAS, 243, 1
- [Boyle et al. 1995] Boyle B.J., Shanks T., Croom S.M., 1995, MNRAS, 276, 33
- [Boyle et al. 2000] Boyle B.J., Shanks T., Croom S.M., Smith R.J., Miller L., Loaring N., Heymans C., 2000, MNRAS, 317, 1014 (Paper I)
- [Brotherton et al. 1999] Brotherton M.S., van Breugel W., Stanford S.A., Smith R.J., Boyle B.J., Miller L., Shanks T., Croom S.M., Filippenko A.V., 1999, ApJL, 520, 87
- [Colless 1998] Colless M., 1998, in Mellier Y., Colombi S. eds., Wide Field Surveys in Cosmology, 14th IAP meeting, Editions Frontieres, 77
- [Condon et al. 1998] Condon J.J., Cotton W.D., Greisen E.W., Yin Q. F., Perley R.A., Taylor G.B., Broderick J.J., 1998, AJ, 115, 1693
- [Croom et al. 1999] Croom S.M., Ratcliffe A., Parker Q.A., Shanks T., Boyle B.J., Smith R.J., 1999, MNRAS, 306, 592
- [Croom et al. 2001] Croom S.M., Shanks T., Boyle B.J., Smith R.J., Miller L., Loaring N.S., Hoyle F., 2001, MNRAS in press (Paper II)
- [Hewett et al. 1995] Hewett P.C., Foltz C.B., Chaffee F.H., 1995, AJ, 109, 1499
- [Hoyle et al. 2001] Hoyle F., Outram P.J., Shanks T., Croom S.M., Boyle B.J., Loaring N.S., Miller, L., Smith R.S., 2001, MNRAS submitted (Paper IV)
- [Lewis et al. 1998] Lewis I.J., Glazebrook K., Taylor K., 1998, SPIE, 3355, 828
- [Schlegel et al 1998] Schlegel D.J., Finkbeiner D.P., Davis M., 1998, ApJ, 500 525
- [Smith et al. 2001] Smith R.J., Croom S.M., Boyle B.J., Shanks T., Miller L., Loaring N.S.,2001, MNRAS submitted (Paper III)
- [Véron-Cetty & Véron 2000] Véron-Cetty M.P., Véron P., 2000, Quasars and Active Galactic Nuclei (9th Ed.).ESO Sci. Rep., 19, 1
- [Voges et al. 1999] Voges W. et al., 1999, AA, 349, 389
- [Voges et al. 2000] Voges W. et al., 2000, IAUC, 7432
This paper has been produced using the Blackwell Scientific Publications TeXmacros.