Discovery of a Galaxy Cluster via Weak Lensing
Abstract
We report the discovery of a cluster of galaxies via its weak gravitational lensing effect on background galaxies, the first spectroscopically confirmed cluster to be discovered through its gravitational effects rather than by its electromagnetic radiation. This fundamentally different selection mechanism promises to yield mass-selected, rather than baryon or photon-selected, samples of these important cosmological probes. We have confirmed this cluster with spectroscopic redshifts of fifteen members at z=0.276, with a velocity dispersion of 615 km s-1. We use the tangential shear as a function of source photometric redshift to estimate the lens redshift independently and find . The good agreement with the spectroscopy indicates that the redshift evolution of the mass function may be measurable from the imaging data alone in shear-selected surveys.
Subject headings:
gravitational lensing—galaxies: clusters: general1. Introduction
Clusters of galaxies are essential tools for developing our understanding of structure formation and for probing cosmological parameters. In particular, the redshift evolution of the cluster mass function is a sensitive diagnostic of , sufficiently sensitive that the existence of even one or two massive clusters at favors a low-density universe (Donahue et al. 1998, Ebeling et al. 2000). This argument assumes Gaussianity in the primordial fluctuations; clusters are equally useful at constraining primordial non-Gaussianity given an independent measure of (Robinson, Gawiser & Silk 1999). Precise estimates of either quantity will require large, unbiased samples of clusters at a range of redshifts. Locally, unbiased samples are crucial for measuring and for estimates of that rely on the fair sample hypothesis, i.e. that the composition of clusters in terms of baryon fraction or mass-to-light ratio is representative of the rest of the universe (Evrard 1997, Carlberg et al. 1996). Finally, the evolution of the numbers of cluster-sized masses as a function of redshift constrains the cosmological constant and the dark energy equation of state (Tegmark 2001).
If clusters are to serve as measures of the clumping of mass, we must identify them directly from observations of the mass distribution. This is difficult, however, because the vast majority of their matter is dark. The traditional methods of discovering clusters rely on optical emission from galaxies (e.g. Abell, Corwin & Olowin 1989; Zaritsky, et al. 1997) or X-ray emission from a hot intracluster plasma (e.g. Boehringer et al. 2000). Clusters with a lower mass-to-light ratio or more baryons may well be overrepresented in these samples. Radiation from baryons is a complicated proxy for mass, and hydrodynamic baryon-CDM models have been proposed to study bias in clusters (Blanton et al. 1999).
The development of weak gravitational lensing techniques (see Mellier 1999 and Bartelmann & Schneider 2001 for reviews) suggests a different approach: shear selection (Schneider 1996). Because all types of matter participate in lensing, deep, wide-field imaging will reveal in its shear pattern all mass concentrations regardless of mass-to-light ratio or baryon fraction. Of course, no single technique will be completely unbiased. For example, shear selection, like optical selection and the Sunyaev-Zel’dovich effect (Joy & Carlstrom 2001), will tend to be more sensitive to line-of-sight superpositions of unrelated structures, to which X-ray selection, with its dependence on the square of the density, is less vulnerable. With X-ray and (until now) shear selection, optical followup is still necessary to provide a redshift. Comparison of differently selected samples will always be necessary. Still, the baryon and photon independence provided by shear selection are powerful features which may produce surprising new samples.
Two “dark” mass concentrations, found through weak lensing analyses of apparently unrelated previously known clusters, have been reported (Erben et al. 2000; Umetsu & Futamase 2000). Due to the absence of associated galaxies, the redshift and therefore masses of those clumps remain unknown. We report here the first spectroscopically confirmed shear-selected cluster. We also introduce photometric redshift techniques into the selection of sources for the weak lensing analysis. The recent development of these techniques (see Connolly et al. 1995; Hogg et al. 1998) greatly improves the promise of shear selection, as source galaxies may be divided into redshift bins to tune the sensitivity to lensing mass concentrations through a series of lens redshifts (mass tomography). In this paper, we use photometric redshifts to demonstrate that the shear-selected mass concentration is at roughly the same redshift as the cluster galaxies. This has always been an assumption in lensing analyses of clusters, but this measurement implies that mass tomography is feasible.
2. Imaging Observations and Lensing Detection
We took images of a “blank” field (containing no known cluster) centered at 23:47:46 +00:57:42 (J2000) using the Big Throughput Camera (BTC, Wittman et al. 1998) in photometric conditions at the Blanco 4-m telescope of Cerro Tololo Inter-American Observatory in 1997 and 1998. Details of the data reduction, galaxy catalogs and seeing correction may be found in Wittman et al. (2000, W00); here we give only the basic parameters. The final images are roughly 40′ square with 0.43′′ sampling and 1.3′′ FWHM after point-spread function corrections, with object counts peaking at , , , and (isophotal magnitudes). In the final catalog, each object’s shape is a weighted mean of the shapes measured in the different filters, as described in W00.
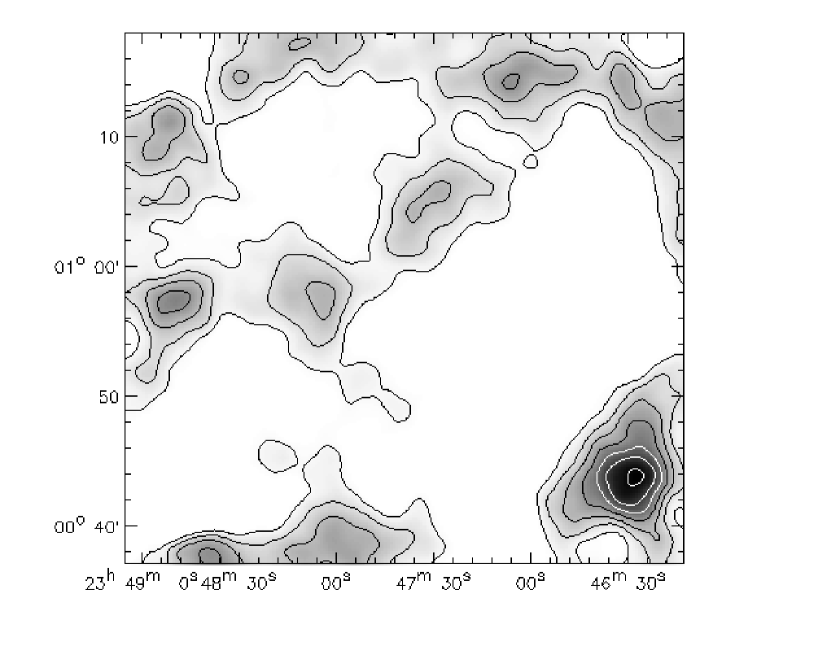
In addition to the W00 magnitude cut of , we imposed a color cut of to emphasize blue field galaxies at higher redshift, a tactic often used in weak lensing analyses of known clusters (Tyson, Wenk & Valdes 1990). Using the method of Fischer & Tyson (1997), we constructed a mass map from the remaining 31,000 galaxies (Figure 1). A mass concentration stands out near the southwest corner; its peak is significant at the 4.5 level, based on mass maps of bootstrap resampled catalogs. The mass concentration disappeared, as it should, under two null tests: rotating each galaxy in the catalog by 45∘, and assigning the shape of a random different galaxy to each galaxy position. To check for any bias casued by proximity to the field edge, we simulated a field of the same size and plate scale filled with random galaxies, distorted the image as if lensed by a cluster of moderate ( km s-1) velocity dispersion, convolved and added noise to match the seeing and noise of the observations, cataloged, selected sources, and made mass maps as for the observations. Repeating this for a series of ten center-to-corner cluster positions, we found that the bias was small ( in peak density) and in the sense of reducing, not enhancing, our sensitivity to mass concentrations near the corner.
We then made a color composite image from the and images (Figure 1.5, separate jpeg). A concentration of reddish elliptical galaxies appears near the position of the density peak (23:46:23.85 +00:45:00.8 for the brightest cluster galaxy versus 23:46:24.0 +00:43:58.8 for the density peak, a displacement of just over 1′). Nothing appears at that position in the ROSAT database, and the NASA/IPAC Extragalactic Database contains only one object in the area, a large spiral which appears to be a foreground field galaxy. We concluded that this candidate cluster was worthy of spectroscopic followup.
3. Spectroscopic Followup
We designed a single slitmask containing 26 objects believed to be cluster members, selected by avoiding blue objects and choosing suitably bright yellow/red galaxies in the color composite image in the area around the putative cluster. This slitmask was used with the Low Resolution Imaging Spectrograph (Oke et al. 1995) on the Keck Telescope on the night of Nov. 23, 2000. A single 1200 sec exposure with the 300 l/mm grating was obtained; the spectral resolution was 10 Å with a 1 arc-sec wide slit, and the region from 4000 to 8000 Å was covered for each object. Two of the objects proved to be Galactic M dwarfs, while 17 are members or near outliers of a cluster at z=0.276. One is a foreground galaxy, and six are background galaxies. We assume an instrumental contribution to the velocity dispersion of 100 km/sec in the rest frame. While there are two outliers among the 17 possible cluster members, both sigma-clipping and the biweight estimator of Beers, Flynn & Gebhardt (1990) yield a velocity dispersion estimate (in the rest frame) of km s-1.
4. Lens Redshift and Mass Estimates Using Photometric Redshifts
With the cluster redshift in hand, we need only the redshift distribution of the lensed sources to derive the cluster mass from the shear. In the past it has been difficult enough to estimate the mean of this distribution, but photometric redshifts can provide a detailed distribution, in principle even an appropriate weight for each source galaxy. In this paper, we use tangential shear as a function of source photometric redshift to estimate the lens redshift in a way independent of the spectroscopy. We demonstrate that the mass causing the shear signal is at roughly the same redshift as the cluster.
For each galaxy observed in all four filters, we used the HyperZ package (Bolzonella, Miralles & Pelló 2000) to compute a redshift probability density function (PDF). We multiplied this by another PDF computed from the galaxy’s apparent magnitude, assuming that a Schechter (1976) luminosity function with and (Folkes et al. 1999) holds at each redshift (we assume km s-1 Mpc-1, , and throughout). The latter PDF is quite broad, but serves a valuable purpose by suppressing high-redshift peaks which often appear in the former PDF. The first and second moments of the final PDF product provide the estimated redshift and its statistical error. Henceforth, we use a catalog of 26,000 galaxies which is defined not by the magnitude and color cuts that went into Figure 1, but by the requirement of detection in each of four filters leading to a photometric redshift. Of these 26,000 galaxies, 13,000 were also in the initial catalog. The median in this catalog is 0.58.
We verified the accuracy of the photometric redshifts by comparison with spectroscopic redshifts of 31 galaxies in the range . This sample was composed of 19 galaxies with redshifts described in Section 3 (the ones detected in all four filters), plus another 12 galaxies () in a different region of the 40′ field, kindly provided by R. Guhathakurta. We find little bias, with on average, and an rms of only 0.059 in the same quantity. A detailed analysis of this photometric redshift method and its application to larger datasets is in preparation (Margoniner et al. 2001).
Before examining the dependence of the shear on source redshift, we must first account for the equally large dependence on projected position relative to the lens. We are not interested in a detailed reconstruction of the lens; rather, for a given we would like to collapse information from all sources at a wide range of projected radii into a single number characterizing the lensing signal at that source redshift. Hence at a given we fit a very simple model, a singular isothermal sphere (SIS), to the radial dependence of the tangential shear (centered on the peak in the mass map), and use the fitted amplitude and its uncertainty. The assumption of a particular profile should not introduce any bias as a function of . To test this, we also considered NFW (Navarro, Frenk & White 1997) profiles. Although our data cannot constrain the scale radius , for fixed (225 kpc, Bartelmann, King & Schneider 2001), the results do not change significantly from the SIS case. We therefore choose the SIS for simplicity. For an SIS, the tangential shear , where is the projected mass density, is the critical density, and , , and are the angular diameter distances from observer to source, lens to source, and observer to lens, respectively. Since only and are changing with source redshift, the amplitude of an fit to the tangential shear should grow with the distance ratio .
Figure 2 shows the fitted tangential shear (at a fiducial radius of 1 Mpc) as a function of . It is consistent with zero for and increases monotonically for (the upper limit is to avoid extrapolating too far beyond the range of spectroscopic verification of ). The dotted line illustrates the shear expected from a lens at , with fit to the points. This is a good fit (). We explore the range of allowed by the shear data by stepping through the range in steps of 0.025, and refitting at each step. The probabilities corresponding to at each step are plotted in Figure 3. The median and mode of this distribution are at and 0.30 respectively, with a 68% confidence interval (these numbers change by less than 0.01 when an NFW profile is used). The fit for is also shown in Figure 2 (dashed line). Thus the lens roughly coincides with the cluster of galaxies in redshift as well as in right ascension and declination. This method can be used to estimate the redshift of any newly discovered lensing mass from the lensing data alone. Such a procedure may well become a standard part of shear-selected cluster surveys.
Finally, we estimate the mass and mass-to-light (M/L) ratio using the best-fit projected mass. Still assuming an isothermal sphere, the projected mass inside of 250 kpc (where it is convenient to measure the light) is , assuming . For the range of allowed by the curve, ranges from . The velocity dispersion implies under the SIS assumption. The discrepancy may be due to the SIS assumption: Unlike the redshift estimate, the mass estimate is sensitive to the profile assumed. Converting from observed band to rest-frame using the approach of Fischer & Tyson (1997), we find in this region. Compared to other clusters (Mellier 1999), this is high but not exceptional.
5. Discussion
Baryon-unbiased samples of mass concentrations over a wide range of redshift will be of critical importance in constraining cosmological parameters. To realize the potential of this technique, weak lensing observations must have the sensitivity to discover clusters over a broad part of the cluster mass function. For example, constraints on from the mass function at high redshift currently involve only a few very massive clusters, and such extreme clusters lie far out on the tail of the mass distribution, which may not be Gaussian. Weak lensing surveys can probe clusters an order of magnitude less massive. Unlike X-ray and optical selection, a shear signal does not diminish as the square of the luminosity distance, so that low-mass clusters should be detectable even at high redshift as long as the photometric redshifts are accurate in eliminating foreground sources.
We have demonstrated the serendipitous discovery, with high signal-to-noise, of a rather modest cluster via a weak lensing analysis of a single 40′ field. The cluster was spectroscopically confirmed at , with a velocity dispersion of 615 km sec-1. The tangential shear follows source (photometric) redshift in a manner which requires the lens to lie at or near the cluster redshift. Thus, all the ingredients are in place for a truly shear-selected sample of clusters, in which any putative mass clump can be confirmed, and its redshift estimated, from the multi-color imaging data alone. This technique is also capable of answering the question of the existence of any truly dark clumps. The redshift (and therefore mass, and mass-to-light ratio lower limit) of any such clumps can only be derived from the shear versus source redshift curve.
This further suggests that the promise of three-dimensional mass tomography (Tyson 1995, 2000) over cosmologically significant volumes can be realized in wide-field deep imaging surveys. Note that such a cluster is not unexpected in the volume probed by this data (Rahman & Shandarin 2001). Ongoing cosmic shear surveys covering tens of square degrees (e.g. the Deep Lens Survey111http://dls.bell-labs.com, DESCART222http://terapix.iap.fr/Descart) should discover significant samples of shear-selected clusters (Kruse & Schneider 1999) and begin to constrain and dark energy through the redshift evolution of the cluster mass function.
References
- (1) Abell G.O., Corwin H.G. & Olowin R.P. 1989, ApJS, 70, 1.
- B (01) Bartelmann, M., King, L. & Schneider, P. 2001, å, submitted, astro-ph/0103465
- B (01) Bartelmann, M. & Schneider, P. 2001, Phys. Rep., in press, astro-ph/9912508
- B (90) Beers, T. C.,, Flynn, K. & Gebhardt, K. 1990, AJ, 100, 32
- B (99) Blanton, M., Cen, R., Ostriker, J. P., & Strauss, M. A., 1999, ApJ, 522, 590.
- B (00) Boehringer, H. et al. 2000, A & A, submitted, astro-ph/0012266.
- (7) Bolzonella, M., Miralles, J.-M., & Pelló, R. 2000, A&A, 363, 476
- C (96) Carlberg, R. G., Yee, H. K. C., Ellingson, E., Abraham, R., Gravel, P., Morris, S., & Pritchet, C. J., 1996, ApJ, 462, 32.
- C (95) Connolly, A., et al. 1995, AJ, 110, 2655.
- D (98) Donahue, M., Voit, G. M., Gioia, I., Lupino, G., Hughes, J. P. & Stocke, J. T. 1998, ApJ, 502, 550
- E (00) Ebeling, H., Jones, L.R., Fairley, B.W, Perlman, E., Scharf, C. & Horner, D. 2000, ApJL, accepted, astro-ph/0012175
- (12) Erben, T., van Waerbeke, L., Mellier, Y., Schneider, P., Cuillandre, J.-C., Castander, F.J. & Dantel-Fort, M. 2000, A&A 355,23
- E (97) Evrard, A. E. 1997, MNRAS, 292, 289.
- F (97) Fischer, P. & Tyson, J. A. 1997, AJ, 114, 14
- Folkes et al. (1999) Folkes, S. et al. 1999, MNRAS, 308, 459
- H (98) Hogg, D., et al. 1998, AJ, 115, 1418
- (17) Joy, M. & Carlstrom, J. 2001, Science, 291, 1715
- Kruse & Schneider (1999) Kruse, G. & Schneider, P. 1999, MNRAS, 302, 821
- (19) Margoniner, V. E. et al. 2001, in preparation
- (20) Mellier, Y. 1999, ARAA 37, 127
- Navarro, Frenk, & White (1997) Navarro, J. F., Frenk, C. S., & White, S. D. M. 1997, ApJ, 490, 493
- (22) Oke, J. B., Cohen, J. G., Carr, M., Cromer, J., Dingizian, A., Harris, F. H., Labrecque, S., Lucinio, R., Schaal, W., Epps, H., & Miller, J. 1995, PASP, 107, 307
- (23) Rahman, N. & Shandarin, S. 2001, ApJ550, L121
- Robinson, Gawiser & Silk (2000) Robinson, J., Gawiser, E. & Silk, J. 2000, ApJ, 532, 1
- Schechter (1976) Schechter, P. 1976, ApJ, 203, 297
- Schneider (1996) Schneider, P. 1996, MNRAS, 283, 837
- Tegmark (2001) Tegmark, M. 2001. Phys. Rev. D (in press); astro-ph/0101354
- (28) Tyson, J. A., Wenk, R. A. & Valdes, F. 1990, ApJ, 341, L1
- (29) Tyson, J. A. 1995, in Dark Matter, AIP Cong. Proc. 336, eds. S. Holt & C. Bennett (AIP Press 1995), p287
- (30) Tyson, J. A. 2000, Phys. Scripta, T85, 259
- Umetsu & Futamase (2000) Umetsu, K. & Futamase, T. 2000, ApJ, 539, L5
- (32) Wittman, D., Tyson, J. A., Bernstein, G. M., Lee, R. W., Dell’Antonio, I. P., Fischer, P., Smith, D. R. & Blouke, M. M. 1998, Proc. SPIE 3355, 626
- (33) Wittman, D., Tyson, J. A., Kirkman, D., Dell’Antonio, I. & Bernstein, G., 2000, Nature, 405, 143
- (34) Zaritsky, D., Nelson, A. E., Dalcanton, J. J., & Gonzalez, A. H., 1997, ApJ, 480, L91