The X–ray spectra of optically selected Seyfert 2 galaxies. Are there any Sy2 galaxies with no absorption?
Abstract
We present an X-ray spectral analysis of a sample of 8 bona-fide Seyfert 2 galaxies, selected on the basis of their high flux, from the Ho et al. (1997) spectroscopic sample of nearby galaxies. We find that, in general, the X-ray spectra of our Seyfert 2 galaxies are complex, with some our objects having spectra different from the ’typical’ spectrum of X-ray selected Seyfert 2 galaxies. Two (NGC3147 and NGC4698) show no evidence for intrinsic absorption. We suggest this is due to the fact that when the torus suppresses the intrinsic medium and hard energy flux, underlying emission from the host galaxy, originating in circumnuclear starbursts, and scattering from warm absorbers contributes in these energy bands more significantly. Our ASCA data alone cannot discriminate whether low absorption objects are Compton-thick AGN with a strong scattered component or lack an obscuring torus. The most striking example of our low absorption Seyfert 2 is NGC4698. Its spectrum could be explained by either a dusty warm absorber or a lack of broad line clouds so that its appearance as a Seyfert 2 is intrinsic and not due to absorption.
keywords:
galaxies: AGN – galaxies: starburst - X-rays:galaxies1 INTRODUCTION
The discovery of hidden Seyfert 1 nuclei in many Seyfert 2 galaxies has given much support to the unified theories of Seyferts (e.g Antonucci et al. for NGC1068). According to the current unification models both are identical objects which possess a core-central black hole, accretion disk, broad-line region- and a thick molecular torus. Objects observed within the opening angle of the torus are classified as Seyfert 1 objects whereas those seen at angles intersecting the torus appear as Seyfert 2 sources. Around the core is ionised gas (warm scatterer) which scatters the primary emission. In some cases nuclear starburst regions have been observed. It should be pointed out that the unified theories explain the differences between type 1 and type 2 Seyferts (and in general active galaxies) phenomenologically, attributing any difference to orientation effects only. The X-ray data support the above picture. The X-ray spectra of X-ray selected Seyfert 2 galaxies (eg Turner & Pounds 1989, Smith & Done 1996, Turner et al. 1997) show column densities much higher than those of Seyfert 1 objects. These columns completely block the soft X-ray flux but become transparent to energies keV. Thus X-rays prove to be a powerful tool for the study of the type 2 -obscured- objects, since X-ray photons can penetrate the obscuring medium and reveal the core to the observer.
Some objects although classified as Seyfert 2 galaxies (e.g. NGC1068 and Circinus, Matt et al. 1997, 1999 respectively) appear to have no excess absorption. It has been shown that in such cases the direct component in the 2-10 keV range is suppressed due to the fact that the torus is optically thick to Compton scattering, thus the hard X-ray photons in the 2-10 keV range are shifted to lower energies, and finally they are absorbed after a few scatterings. In X-ray astronomy terminology these objects are classified as Compton thick Seyfert 2 galaxies. In such cases the emission from the nucleus can be inferred from the photons scattered from the warm scatterer and the inner surface of the torus itself (cold scatterer). Therefore Compton thick objects can show low obscuration below 10 keV. BeppoSAX observations with the PDS have revealed that a power-law emerges through a high column density () above 10 keV in several such cases. In such cases the obscuration is large enough to completely block the direct emission leaving a low “pseudocolumn” below 10 keV, but small enough to allow transmission above this energy. However, in some cases the column is so high () that the emission is not detected with the PDS. In addition the observed equivalent width of the iron line increases as it is measured against a suppressed continuum.
Till recently, Seyfert 2 studies were restricted to relatively X-ray bright Seyfert 2 mainly taken from all-sky X-ray surveys leading to bias in favour of galaxies with low . Maiolino et al. (1998) studied a sample of X-ray weak Seyfert 2 galaxies selected by their flux and found that the average obscuration of type 2 AGNs is much higher than that derived by the former X-ray studies. This is because the flux is produced above or below the torus and therefore can be considered to represent the central engine and thus provide us with an unbiased sample of Seyfert 2 galaxies. Recently Risaliti et al. (1999) studied a large sample of selected late-type Seyfert galaxies (Seyfert 1.8, 1.9, 2.0, ). The galaxies came from Maiolino Rieke (1995), completed with NGC1808. Using X-ray data from the literature (with the exception of 5 objects, where the authors analysed the data), they showed that the average column density for these objects is , with all the Seyfert 2s being obscured by columns with , giving strength to the simple model, proposed by the unified theories. Furthermore they showed that about half are Compton thick () and they confirmed that intermediate type 1.8-1.9 Seyferts are characterised by an average distribution lower than that of the genuine Seyfert 2 galaxies.
Although the above standard model describes very well the spectrum of most Seyferts, recently examples of Seyfert 2 galaxies were found which challenge the unification scenarios. These show no intrinsic absorption (for example NGC3147, Ptak et al. 1997, NGC7590, Bassani et al. 1999) while their high ratios are inconsistent with the idea of being Compton thick objects (see Bassani et al. 1999). The peculiar spectra of these Seyfert 2 could be explained, for instance, either by the absence of a broad line region or by a high dust to ( neutral) gas. In the former case, their appearance as Seyfert 2 is intrinsic and not due to absorption. The lack of absorbing columns in these galaxies raises important questions about the validity and universality of the standard AGN unification schemes. The distribution of the absorbing columns in AGN is also vital for models for the synthesis of the XRB (eg Comastri et al. 1995). It is evident that the range of column densities of the absorbing material, its structure and geometry remain yet unconstrained and need to be determined with larger samples of galaxies selected in different wavebands.
In this paper, we present a comprehensive and uniform X-ray analysis with ASCA data of 8 optically selected Seyfert 2 galaxies from the spectroscopic sample of Ho et al. (1997). While a few of the objects analysed here have been retrieved from the public ASCA database, some are presented here for the first time (NGC1167, NGC2273, NGC3486, NGC4698). Our goal is to explore the validity of the standard model and study the distribution of absorbing columns in a sample with very accurately defined optical properties, bona-fide Seyfert 2. This paper is divided as follows: in 2 we introduce our sample; in 3 we describe our analysis method; in 4 we present the results of the spectral analysis; in 5 we discuss our results to the individual objects: in 6 we discuss our results; in 7 we summarise our main observational results.
2 THE DATA
We present an analysis of 8 optically selected Seyfert 2 galaxies observed with the ASCA satellite. The list of the data is presented in table 1. Data come from both our own proprietary observations and from the ASCA archive. Our galaxies are taken from the Ho et al. (1997) spectroscopic sample of nearby galaxies. This sample contains objects selected from the Revised Shapley-Ames Catalogue of Bright Galaxies (RSA; Sandage & Tammann 1981) with magnitude limit mag in the northern () sky. As high signal-to-noise and moderate to high resolution optical spectroscopy has been obtained for this sample, very accurate spectroscopic classifications exist for all galaxies. As a consequence we can be confident that all our objects are bona-fide Seyfert 2 galaxies. Our eight objects are selected on the basis of their high flux. Some of our objects (see table 1) have been previously analysed by other authors in the hard X-ray band. However, here we re-analyse the data in order to present a uniform, comprehensive analysis of the brightest selected Seyfert 2, for which X-ray data were/became available, in the Ho et al. sample. An selected sample should be relatively free from the selection effects and biases that might appear through X-ray or other optical selection, such as intrinsic absorption or differences in viewing angle (Ueno et al. 1998). For 5 of the sources we were able to perform spectral analysis. For the other 3 (NGC1167, NGC1667 and NGC3486), insufficient X-rays were detected for a full spectral analysis and we restrict ourselves to a hardness ratio analysis.
| Name | ASCA | SIS-0 | (Gal) | References | |||
| Sequence | J2000 | J2000 | exp | () | |||
| (1) | (2) | (3) | (4) | (5) | (6) | (7) | (8) |
| NGC1167 | 77072000 | 03 01 42.4 | +35 12 21 | 38 | 0.016495 | 1.14 | - |
| NGC1667 | 71032000 | 04 48 37.1 | -06 19 12 | 14.5 | 0.015167 | 0.55 | 1,2 |
| NGC2273 | 74039000 | 06 50 08.7 | +60 50 45 | 34 | 0.006241 | 0.68 | 3 |
| NGC3079 | 60000000 | 10 01 57.8 | +55 40 47 | 29 | 0.003753 | 0.08 | 4 |
| NGC3147 | 60040000 | 10 16 53.6 | +73 24 03 | 23 | 0.009407 | 0.36 | 5 |
| NGC3486 | 77074000 | 11 00 23.9 | +28 58 30 | 41.3 | 0.002272 | 0.19 | - |
| NGC4698 | 77073000 | 12 48 23.0 | +08 29 14 | 40.5 | 0.003342 | 0.19 | - |
| NGC5194(M51) | 60017000 | 13 29 52.35 | +47 11 53.8 | 30.5 | 0.001544 | 0.16 | 6 |
NOTE: Units of right ascension are hours, minutes and seconds. Units
of declination are degrees, arcminutes and arcseconds.
aFrom the NASA Extragalactic Database (NED).
REFERENCES.(1)Ueno et al. 1997; (2)Turner et al. 1997; (3)Maiolino et al. 1998; (4)Ptak et al. 1999; (5)Ptak et al. 1996; (6)Terashima et al. 1998.
3 DATA REDUCTION
We utilised both ASCA GIS and SIS data. We used the standard “Revision 2” processed data from the Goddard Space Flight Center (GSFC) and data reduction was performed using FTOOLS. For GIS data we used a circular source region centered on the source. Background counts were estimated from source-free annuli centered on the source cell. Due to calibration differences between the four SIS chips, we limited our analysis to the on-source chip for each SIS. We used a circular extraction cell of 3 to 4 arcminutes in radius. In cases, where the source was centered close to the gap between the chips, we followed the process described in the ASCA ABC guide (Yaqoob 1997). Background was estimated using rectangular regions at the source chip, excluding the source. In the case of NGC2273 where an additional serendipitous source close to the galaxy is detected, we used a circular source region of 1.5 arcmin in radius in both GIS and SIS in order to minimise any contamination by the nearby source.
4 SPECTRAL ANALYSIS
The spectral analysis was carried out using XSPEC v10. We bin the data so that there are at least 20 counts in each bin (source plus background). Quoted errors to the best-fitting spectral parameters are 90 per cent confidence regions for one parameter of interest (=2.71). We performed spectral fitting, allowing the normalisation for the SIS and GIS detectors to vary. The fluxes and luminosities given in the tables are referred to the GIS data. Throughout this paper values of and =0.5 are assumed. From our analysis, we exclude all data below 0.8 keV due to uncertainties in the calibration matrices (see George et al. 1998 for a discussion on this). We apply relatively simple spectral models, so as to describe the properties of the whole sample in the context of the unified model. We apply all the models to all the data sets even though the most complex models may not be required in some cases. Where fits gave us absorption values consistent with the Galactic column density or lower we have fixed the column to the Galactic value. The latter was determined using the nh ftool, which utilises a map based on 21-cm measurements and has resolution of about 0.7 degrees (see Dickey and Lockman, 1990).
4.1 Building the standard model
We have used the four major components of the “standard model” in steps: a) we first apply a single power-law with absorption if required, to all of our objects, b) we then add a Gaussian line representing the iron emission, c) we add a second power-law component representing scattered emission; d) finally a Raymond-Smith component at low energies representing a star-forming component is added to the data.


4.1.1 Single power-law model
According to the current theories the primary UV and soft X-ray photons produced by the disk are Compton scattered by a medium of hot electrons ( 50 keV) and reradiated at hard energies. Such a process can produce a power-law with an index of , in agreement with observational results, which suggest that the intrinsic X-ray spectrum of Seyfert 1 galaxies is well represented by a power-law with a “canonical” spectral index with . In the case of Seyfert 2 galaxies, where our line of sight intersects the torus, we expect the spectrum to show a low energy cutoff as well. We thus fit the data with a power-law model , where N(E) is the photon number density at energy E. The photoelectric absorption A(E) is parameterised by where is the equivalent hydrogen column and the photo-electric cross-section taken from Morrison McCammon 1983. Figure 1 shows the data and the data/model ratio after this model was fitted to each object. Rather unexpectedly this model does provide an acceptable fit in 2 cases, where the absorption needed is either the Galactic value (NGC3147) or relatively low (NGC4698). An absorbed power-law model is clearly rejected by the NGC2273 and M51 data. The model parameters are shown in table 2. For the cases of M51, where the obtained spectral slope is unphysically steep and for NGC2273, where the slope is rather flat, we also fitted the model with the slope fixed at the nominal value of , for comparison.
| Name | |||||
|---|---|---|---|---|---|
| NGC2273 | 0.68g | 0.9 | 0.65 | 82.92/22 | |
| 1.9f | 5.86 | 0.18 | 0.14 | 117.47/22 | |
| NGC3079 | 0.08g | 0.74 | 0.20 | 228.06/143 | |
| NGC3147 | 0.36g | 1.63 | 2.76 | 289.22/285 | |
| NGC4698 | 1.04 | 0.22 | 243.90/250 | ||
| M51 | 0.16g | 0.35 | 0.02 | 568.88/178 | |
| 1.9f | 0.16g | 0.90 | 0.04 | 848.21/179 |
NOTE: g indicates that the is set to the Galactic value,
whereas f indicates that the parameter value is frozen.
aobserved 2-10 keV flux in units of .
bunobscured 2-10 keV luminosity in units of , corrected for absorption quoted in column 3.
4.1.2 Iron line
Strong evidence supporting the presence of an accretion disk in the vicinity of a black hole has been given by the detection of an asymmetric broad emission line at a rest energy of keV in the Seyfert 1 galaxy MCG-6-30-15. This is interpreted as iron emission originating by fluorescence in the very inner parts of an accretion disk, , about a massive black hole of Schwarzschild radius (Tanaka et al. 1995). The profiles and intensities of the iron lines are expected to be complex (asymmetric, double peaked) but the sensitivity of the current detectors cannot provide us with such detailed profiles for the majority of the observed objects. In the Seyfert 2s, reprocessing of the nuclear radiation by the obscuring torus may also contribute to the line flux. The mean equivalent width for a sample of Seyfert 2 galaxies studied with ASCA is eV (Gilli et al. 1999).
Some of our objects show line like residuals in the 6-7 keV energy range, providing evidence for an iron line, which we parameterise by a Gaussian line. For the purposes of our study the width of the line is fixed to =0.01 keV. This is smaller than the instrumental response and thus is effectively mono-chromatic. The addition of an iron line provides a significantly better fit (at confidence) for three of our objects (NGC2273, NGC3147 and M51) although we note here that the line equivalent widths determined may be strongly affected by the continuum shape and may be unphysical. The energy of the iron line is consistent with that expected for cold iron for all of our objects in which the line is detected. No line was detected in the spectra of NGC3079 and NGC4698, for which we give the 90 per cent upper limits.
| Name | EW (eV) | |||||
|---|---|---|---|---|---|---|
| NGC2273 | 0.68g | 0.54 | 0.41 | 33.32/20 | ||
| NGC3079 | 0.08g | 0.84 | 0.22 | 217.71/141 | ||
| NGC3147 | 0.36g | 1.67 | 2.82 | 267.02/283 | ||
| NGC4698 | 1.04 | 0.21 | 243.89/248 | |||
| M51 | 0.16g | 0.53 | 0.02 | 532.33/176 |
NOTE: g indicates that the is set to the Galactic value.
aobserved 2-10 keV flux in units of .
bunobscured 2-10 keV luminosity in units of , corrected for absorption quoted in column 3.
4.1.3 The scattering model
According to the unified model we expect that a fraction of the primary emission should be Thomson scattered into our line of sight by a photoionised medium. The scattered spectrum has the same shape as the incident spectrum. We note that in this work the term “scattering” is always referred to scattering off the warm photoionised medium. Optical polarimetric observations (Tran et al. 1995) have shown that up to 10 per cent of the primary emission is scattered. The above scenario can be modeled using two power-laws with the same photon index but different normalisations and absorptions. The results are shown in table 4. Again the energy of the line is consistent with the expected 6.4 keV. For M51 we note that the obtained slope is unphysically steep and although the fit has been improved, the model does not describe the data adequately. For NGC4698 although we obtain a good fit, the normalisations of the two power-law components are comparable, and neither component requires any absorption below 10 keV. In the case of NGC3147 the column density is too high to be properly constrained in the ASCA energy range. Finally, in the case of NGC2273, the normalisations of the scattered power-law component is almost two orders of magnitude lower than that of the primary power-law component, suggesting 2 per cent scattered flux, in agreement with what it is typically found for the obscured Seyfert galaxies (Sy 1.9-2.0).
| Name | EW (eV) | |||||
|---|---|---|---|---|---|---|
| NGC2273 | 1.11 | 7.80 | 14.28/18 | |||
| NGC3079 | 1.13 | 0.21 | 192.18/140 | |||
| M51 | 0.60 | 0.06 | 298.81/174 |
aobserved 2-10 keV flux in units of .
bunobscured 2-10 keV luminosity in units of , corrected for absorption quoted in column 3.
4.1.4 Composite model
Infrared (Maiolino et al. 1995) and X-ray studies of Seyfert 2 galaxies (Turner et al. 1997) show that their host galaxies tend to have energetic starburst regions. Indeed some of our objects show line like residuals at soft energies, suggesting thermal emission arising from hot gas. Thus we utilise an emission spectrum from hot, diffuse gas (Raymond model in XSPEC) to model the starburst component, along with a single power-law to account for the hard photons. The temperature is set to be , in order to constrain the starburst contribution to the soft band. We fit NGC3079 and M51 with this model because these galaxies show evidence for thermal emission. In the case of M51 the thermal component is absorbed by the Galactic column, whereas in NGC3079 excess absorption is required. This model gives a good fit for both galaxies (see table 5).
| Name | KT | EW(eV) | |||||
|---|---|---|---|---|---|---|---|
| NGC3079 | 0.11 | 0.3 | 156.42/139 | ||||
| M51 | 0.9 | 0.07 | 235.18/173 |
NOTE:⋆this value is referred to the column obscuring the thermal
component.
aobserved 2-10 keV flux in units of .
bunobscured 2-10 keV luminosity in units of , corrected for absorption quoted in column 3.
4.2 The Compton thick models
If the column density exceeds , the obscuring medium is optically thick to Compton scattering and thus the primary emission is suppressed and we only observe the scattered emission from either the warm matter or the inner surface of the torus itself. For the latter we use the term reflection. Here we will consider the case where the Compton reflection from the inner surface of the torus dominates the observed emission in the 2-10 keV energy band. We therefore utilise the pexrav model in XSPEC, which describes reflection occurring from a slab of neutral material subtending a solid angle of sr to an X-ray point source located above the slab, to account for the total hard X-ray emission and a power-law to represent the soft emission. For the purpose of this study we consider that the slope of the underlying power-law spectrum is 1.9 and Galactic absorption. The normalisation of the reflection is given by R=, where is the solid angle subtending by the reflector. However, as we cannot measure directly the intensity of the intrinsic power-law which is being reflected, the value of R we obtain is not physically meaningful. Therefore we define the ratio A=R as an indicator of the fractional contribution that would have been made to our observed spectrum after correction for absorption by the pexrav reflector. is the flux that would have been produced by the underlying spectrum in the 2-10 keV band assuming that the emission is not absorbed by the torus whereas is the observed flux of the fitted scattered component in the same band. Given that typically the scattering accounts for 1 per cent of the total X-ray emission, any value of A that is less than 1 suggests we see only a small portion of the reflector, and small values mean the reflected contribution to the observed flux is almost insignificant. We apply this model to NGC2273, NGC3147 and NGC4698 which show low absorption. That model provides a good representation of the data for NGC4698 (=245.04 for 250 degrees of freedom), NGC2273 (=24.88 for 18 d.o.f.) and NGC3147 (=267.11 for 282 d.o.f.) (see also table 6).
| Name | EW(eV) | Aa | |||
|---|---|---|---|---|---|
| NGC2273 | 1.9f | 0.62 | 24.88/19 | ||
| NGC3147 | 1.9f | 0.02 | 267.11/282 | ||
| NGC4698 | 1.9f | - | 0.01 | 245.04/250 |
athe meaning of parameter A is explained in section 4.2.
bobserved 2-10 keV flux in units of .
5 Results on single objects
In this section we discuss the results of the spectral fits for each object in our sample individually and compare our result to previous X-ray studies. NGC1167, NGC1667 and NGC3486 did not give sufficient counts for a full spectral analysis to be performed. We did obtain a detection in the 2-10 keV band for both objects. Clues for the spectral shape of the sources come from their hardness ratio. Here we define hardness ratio as (h-s)/(h+s), where h and s are the total number counts in the detection cells, in the 2-10 and 1-2 keV bands respectively. For our analysis we chose to use GIS data only.
5.1 NGC1167
The hardness ratio of the source is -0.22, which corresponds to a power-law of assuming Galactic absorption. This corresponds to an observed flux in the 2-10 keV band of and a luminosity of . We note that the derived spectral index is rather steeper than is typical for Seyfert galaxies, suggesting the possible presence of an additional soft component, possibly coming from a starburst region in the vicinity of the AGN.
The low =0.23 ratio (see section 6 for a detailed discussion on the implications of this ratio) for this source would suggest a Compton thick Seyfert 2 galaxy. On the other hand the HR analysis showed that NGC1167 has a steep spectrum, while in the context of a Compton thick interpretation we would expect a flat spectrum. Unfortunately the HR analysis provides only an indication for the spectral shape and no information about multiple components contributing to the spectrum. It is quite likely that the X-ray spectrum of NGC1167 is complex with different components contributing to different energies. For example a very strong soft excess, possibly originating from intense starforming activity, could produce a steep spectrum even if the emission from the central source is completely blocked by a Compton thick absorption screen. However, since NGC1167 is too faint for any further spectral analysis to be performed, the nature of its X-ray emission cannot be determined.
5.2 NGC1667
NGC1667 has shown a decrease of a factor of 150 in the 2-10 keV flux between its discovery (e.g. Polleta et al. 1996, Turner et al. 1997). The object is too faint to perform any spectral analysis. The hardness ratio of the source is -0.520.14, which corresponds to a power-law of . Assuming Galactic absorption the observed 2-10 keV flux is then , which corresponds to a luminosity of . The slope is steeper than the canonical for Seyfert galaxies and, again, some fraction of the emission could be attributed to starburst emission. Indeed, Radovich & Rafanelli (1996) find evidence for star formation within 10 kpc of this source, thus favouring the latter interpretation. The low =0.1 ratio for this source would suggest it as a Compton thick candidate.
The substantial reduction in the hard X-ray flux over a yr timescale which has, presumably, not yet been reflected in the narrow-line region would provide an alternative hypothesis to explain the anomalous ratio. Indeed, assuming that the reduction in the hard X-ray flux over a yr timescale, has not yet been reflected in the narrow-line region, we find that the Narrow Line Region in NGC1667 should be located at 6 pc. Given that the NLR lies 10-100 pc from the central source it appears that indeed the substantial change in the hard X-ray flux has not reached the NLR yet. This explanation is the most likely explanation of the low ratio and NGC1667 is probably Compton thin.
5.3 NGC2273
This galaxy has been studied by Maiolino et al. (1998) using BeppoSAX data. They found that their data are best fitted by a Compton thick reflection dominated model. In addition they did not detect any emission with the PDS on board BeppoSAX and thus they suggested that if the Compton thick model is valid the absorbing column in our light of sight must be larger than . The “scattering” model provides a better fit to the ASCA data (with a column close to and an equivalent width of 500 eV) and thus is our preferred fit. It is apparent from figure 1 that the flat spectrum originally obtained from a simple power-law fit is caused by a turn-up in the spectrum at energies above keV. Indeed a spectral fit over the restricted 0.2-5 keV range give a good fit to power-law with a slope of consistent with the canonical AGN and our scattering interpretation. The ratio of the unobscured hard X-ray emission to the [OIII]5007 emission is low, indicating that we do not observe the primary emission and the Compton thick model described in the text, yields a poor fit. It is likely that the spectrum of NGC2273 is more complex. Probably a warm absorber medium and/or starburst emission contribute to the soft X-ray spectrum of this Seyfert 2, whereas the emission line around 6.4 keV could be a blend of iron lines. Unfortunately the low quality of these data do not allow us to separate the components, which may contribute to the NGC2273 X-ray spectrum.
5.4 NGC3079
The EINSTEIN IPC detected NGC3079 at the 3.2 level (Fabbiano et al. 1982), with a flux of . The ROSAT PSPC data are dominated by a nuclear point source but emission is detected up to 2’.5 from the nucleus (Reichert et al. 1994). Pietsch et al. (1998) resolved the X-ray emission with ROSAT PSPC and HRI into three components. a) extended emission in the innermost region, with , coincidents with the super-bubble seen in optical images, b) emission from the disk of the galaxy that can partly resolved in 3 point-like sources and c) very soft X-shaped emission from the halo extending to a diameter of 27 kpc. Ptak et al. (1999) first presented the ASCA data for this galaxy. Their best-fit spectral parameters have large uncertainties: the power-law and . The starforming component, was described by a Raymond-Smith model with kT=0.14(0.54) keV. Our analysis is in broad agreement with Ptak et al. (1999), although the spectral index is somewhat flatter. Our best-fit model is the “composite” one (see table 5) while no significant iron Kα emission is detected. No variability was detected by Ptak et al. (1998) consistent with a Compton thick scenario. Indeed the X-ray to [OIII]5007 ratio supports either a Compton thick interpretation or a substantial starburst contribution. Again NGC3079 seems to have a complex spectrum and the nature of the X-ray emission cannot be determined with the current data.
5.5 NGC3147
Emission in the vicinity of NGC3147 was detected at by HEAO (Rephaeli et al. 1995) but no significant signal was detected by EINSTEIN , implying a decrease in the flux between these two observations. Ptak et al. (1996) first studied this object with ASCA . They found that the data are well fitted by a simple power-law with =1.9 and there is no indication for absorption. Our results are in excellent agreement with those of Ptak et al. (1996). Our best-fit model is the single power-law with the iron line. In principle, other more complicated models such as the scattering model or the Compton thick model provide equally acceptable . In the case of the “scattering” model we obtain a very large column of while the scattered emission is 5 per cent of the primary component. However, such high columns cannot be probed by ASCA , thus we do not show the model parameters for this model in table 4. In addition the Compton thick model provides an equally good representation of the data statistically; here it is the scattering component which dominates the fit. The absence of variability (Ptak et al. 1998) could in principle favour such models. However, although the above models provide good fits to the data they are rather contrived as the ASCA bandpass does not allow us to constrain any models with an obscuring column higher than . Indeed, a single power-law model is identical to a scattering model with in the ASCA band as these columns absorb most photons below 10 keV. It is therefore interesting that the [OIII]5007 emission does not favour the above two models (composite and scattering).
5.6 NGC3486
The hardness ratio is 0.290.12 . This corresponds to a quite flat power law of assuming Galactic absorption, suggestive of high amounts of obscuration. For example the well-known nearby Compton thick AGN (eg Circinus, NGC1068) exhibit flat spectra below 20 keV due to the combination of the reflection and the scattering components. The observed flux assuming Galactic absorption is .
We carried out simulations in order to determine the amount of obscuring medium needed to obtain a change of from 1.9, which is the common value for AGNs to 1.2. We found that the source should be obscured by a column density of . Using and we obtain an observed flux of , which corresponds to a luminosity of . This is too low for a Seyfert galaxy, suggesting high absorption in our line of sight (but see Roberts Warwick 2000).
The [OIII]5007 ratio is relatively low (2.9). In order for the ratio to be comparable to the ratios observed in Seyfert galaxies (see section 6) the source should be obscured by a column density of 1 cm-2 assuming a power-law of =1.9. This is much higher than the column derived from the HR analysis assuming =1.9. This indicates that the spectrum cannot represented by a single power-law model, and that other components contribute to the X-ray spectrum as well.
5.7 NGC4698
NGC 4698 was observed with EINSTEIN and its 0.2-4.0 keV flux is . A detailed discussion on this object is presented in section 6.
5.8 M51
M51 is known as the ’Whirlpool galaxy’. The EINSTEIN HRI detected X-ray emission from M51 with a luminosity in the 0.2-4.0 keV band. The emission is extended and the luminosity of a point source at the nucleus is (Palumbo et al. 1985). The ROSAT PSPC spectrum of the M51 nucleus is fitted with a thermal plasma of kT0.4 keV (Marston et al. 1995;Read et al. 1997) indicating that the AGN does not dominate the nuclear soft X-ray emission. The ROSAT PSPC observations revealed extended emission (Ehle et al. 1995). At the hard energies the GINGA data are fitted with a photon index of and an X-ray luminosity of from a 1 deg2 field containing M51 (Makishima et al. 1990). The data are also fitted with a kT=7 keV thermal bremsstrahlung model plus a power-law with absorbed by a column of . Terashima et al. (1998) analysed ASCA data and found extended emission from M51 in the 2-5 keV energy range. They detected a soft thermal emission represented by either kT0.4 keV with low iron abundance or two kT plasmas ( keV and keV). The hard emission is represented by a power-law with respectively. The fact that extended emission is observed in the 2-5 keV band, clearly suggests that the AGN emission contributes only to the hardest end of the ASCA spectrum and is either suppressed at the softer energies or is not the dominant contributor of the energy output at these energies.
Our best fit model for M51 is the composite model with 0.7 keV and a spectral slope of . However we obtained an upper limit for the column density of 1.6 . This is not sufficient to obscure the AGN X-ray emission up to 5 keV, as it is indicated by the analysis of the brightness profile of M51. The emission could be interpreted as the superposition of thermal emission at soft energies (below 2 keV), emission from low-mass X-ray binaries (LMXBs), which contribution dominates at the 2-5 keV band and a power-law component from the AGN, which is revealed above 5 keV. In this case the active nuclei should be obscured by a column of . However, because the AGN and the LMXBs, both show a power-law spectrum of , it is possible both components to be fitted by the power-law model with no need of excess absorption. On the basis of its flux, M51 is a Compton thick candidate. We note here that we also tried a Compton thick model, with either 2 Raymond-Smith models and a reflected continuum (pexrav model), or a Raymond-Smith model, a power-law model to account for the possible LMXBs contribution and the reflection component. However, although we obtained good fits the reflection component did not contribute in the ASCA band leaving the possibility where the hard X-ray emission is dominated by a scattered component more plausible in this band.
6 Discussion
6.1 Are most of our objects Compton thick ?
A couple of our objects show no evidence for intrinsic absorption. We note that in the case of poor photon statistics a Compton thick object could be misidentified for a low-, steep spectrum type-1 AGN, especially if the steep scattered emission dominates over the reflected component. It is thus possible that ASCA only ’sees’ the scattered component Therefore, the lack of intrinsic absorption in some of our objects may indicate that these objects are Compton thick.
Further clues on whether these AGN are Compton thick can be given by studying the isotropic properties of the galaxy. In the case of an AGN as isotropic emission we consider the infrared (IR) and the hard X-ray emission (in the case of Compton thin absorption) both been able to penetrate the torus, and the line emission produced in the narrow line region, and thus free of viewing angle effects. Indeed, Alonso-Herrero et al. (1997) showed that the ratio of the 2-10 keV flux to the and to the IR flux are comparable for obscured and unobscured AGNs. The advantage of studying isotropic properties then, is that they act as an indicator of the strength of the nuclear source. Maiolino et al. (1998) have proposed that the measurement of the observed hard X–ray flux (2-10 keV) against the flux, is indeed a powerful diagnostic. Moreover, although the line is emitted on the Narrow Line Region (NLR) scales, the host galaxy disk might obscure part of the NLR and should be corrected for the extinction deduced from the Balmer decrement (Maiolino Rieke 1995). The corrected flux is given by the following relation (Bassani et al. 1999):
| (1) |
Assuming an intrinsic Balmer decrement . All the well studied Seyfert 1 galaxy have (Maiolino 1998). An absorption of less than a few times will lower this ratio by a factor of with respect to Seyfert 1s. When then the reduction is about two orders of magnitude. The flux ratios are presented in table 7. For each object we use the flux derived using the most plausible model. Of course we have to be cautious as there may be some limitations on the use of the flux ratio as an indicator of the unobscured X-ray emission. Indeed, in cases where the ionisation cone axis lies perpendicular or close to the minor axis there might be lack of ionised gas. Then the flux may not be a good indicator of the nuclear strength. However the disk height for a typical spiral galaxy is of the order of pc whereas the size of the region where the bulk of the flux is produced is of a similar size. Thus it is most likely that the relative orientation of the nuclear accretion to the host galaxy disk will not significantly affect the flux. Another caveat that we should take into account is whether the torus hides the innermost regions of the NLR from our view and thus the observed [OIII]5007 is lower than the actual flux produced. Again the small inferred size of the torus (a few pc) relative to the size of the NLR (kpc scale) implies that such an effect does not affect significantly the above ratio. In addition Mulchaey et al. (1994) compared the properties of samples of Seyfert1 and Seyfert 2 galaxies and showed that the ratio of the [OIII]5007 emission to the unobscured hard X-ray emission, is the same for both types of galaxies, indicating that the [OIII]5007 flux cannot be obscured by the torus. In the case of the IR emission caution must be taken since the IR emission may be contaminated by starburst emission particularly in the case of low luminosity AGN where the star formation in the host galaxy dominates the emission. Multiwavelength observations of our objects have shown that indeed some of them contain starburst activity (see 5). So we choose not to apply this criterion to our data.
| Name | |||||||
|---|---|---|---|---|---|---|---|
| NGC1167 | 0.04 | 0.04 | 17 | 0.23 | 0.23 | ? | CT |
| NGC1667 | 0.08 | 0.08 | 197 | 0.04 | 0.04 | ? | CTn |
| NGC2273 | 1.11 | 3.65 | 277 | 0.40 | 1.32 | CTn | CT |
| NGC3079 | 0.11 | 1.10 | 90 | 0.11 | 1.20 | CTn | CT |
| NGC3147 | 1.63 | 1.64 | 9.0 | 18.11 | 18.22 | CTn | CTn |
| NGC3486 | 0.05 | 0.05 | 1.7 | 2.94 | 2.94 | ? | CT/CTn |
| NGC4698 | 1.04 | 1.10 | 2.0 | 52 | 55 | CTn | CTn |
| M51 | 0.11 | 0.55 | 150 | 0.07 | 0.37 | CTn | CT |
a 2-10 keV observed flux in units of .
b 2-10 keV unobscured flux in units of , using the
most plausible model for each object.
c corrected flux in units of , taken from
Risaliti et al. 1999.
d using the observed 2-10 keV flux.
e using the absorption corrected 2-10 keV flux for the
most plausible model for each object.
f whether the object is Compton thin (CTn) or Compton thick (CT) after taking into consideration the spectral fitting.
g whether the object is Compton thin (CTn) or Compton thick (CT) after taking into consideration the ratio.
In table 7 it is noted whether the object is Compton thin or thick on the basis of both the X-ray spectral analysis and the ratio. It is clear that in some cases there is a discrepancy between the classifications inferred from the spectrum and the ratio. It is likely that the X-ray spectrum of Seyfert 2 galaxies and especially those with high column densities, where the medium and hard X-ray photons are suppressed, and emission from the host galaxy, circumnuclear starburst and warm absorbers contributes to the spectrum significantly. The present (ASCA ) data does not allow us to distinguish the contribution of these components.
Summarizing, NGC1167, NGC2273, NGC3079 and M51 are Compton thick candidates according to their ratio. The are best for the three of them –NGC2273, NGC3079 and M51– are best fitted with a highly obscured (NH 1023 - 1024) power-law. However due to large uncertainties in the derived column density we were not able to distinguish between the Compton thin and thick interpretations. This may be due to the underlying complexity of the X-ray spectra as shown more clearly in the case of M51. However the current data, especially in the case of NGC2273, are only sufficient to support analysis with simplistic models. NGC3486 is probably a heavily obscured Sy2. Both NGC3147 and NGC4698 have high ratios, comparable to the value obtained by Alonso-Herrero et al. 1997 if we take into account the extinction in the NLR, clearly showing that the 2-10 keV X-ray emission is not affected by absorption.
6.2 Sy2 galaxies with no absorption in X-rays: the case of NGC4698
The most striking example from our low absorption Seyfert 2 is NGC4698. The X-ray data do not require absorption and the alternative hypothesis of Compton thickness was ruled out on the basis of the flux. Further evidence for the amount of obscuring material can be obtained by the iron line emission. For Compton thin Seyfert 2 galaxies the average equivalent width value derived from ASCA data, is 363254 (Gilli et al. 1999), whereas for Compton thick objects the equivalent width can be well above 1 keV (e.g for NGC6240 the iron line has an EW1.58 keV). However, we do not obtain a significant detection of line emission but can only set a 90 per cent upper limit to the equivalent width of such a feature of eV. This value is too low for a Compton thick object and in that sense rules out the Compton thick interpretation for this object.
NGC4698 is not the first Seyfert 2 galaxy found which presents no intrinsic absorption. Ptak et al. (1996) first studied the NGC3147 (which is also included in our sample) with ASCA in the context of an AGN. They interpreted its X-ray emission as originating in a Seyfert 1 (no Seyfert classification was available at that moment) or a heavily obscured Seyfert 2. Moreover, Bassani et al. showed that NGC7590 has negligible absorption as well in X-rays, although classified as a Seyfert 2 galaxy. Using the [OIII] 5007 criterion the latter authors ruled out the Compton thick possibility for both objects and suggested that these lack a broad line region so that their appearance as Seyfert 2 is intrinsic and not due to absorption. Then optical classification as type 2 object will be explained by the presence of narrow emission lines only due to lack of the broad line region.
Many models for the formation of broad line clouds argue towards a link to the disk (see Collin-Souffrin 1987 and Witt et al. 1997), thus the existence of a class of objects without a BLR would set constraints to the conditions under which a BLR is formed as well as the properties of the disk. In particular recently Nicastro 2000 presented a model in which a standard accretion disk accreting at low rates is not expected to produce broad line emission lines. According to this model a vertical disk wind, originating at a critical distance in the accretion disk, is the origin of the broad line emission region. The disk wind forms for external accretion rates higher than a minimum value below which a standard disk is stable. For accretion rates ṁ the disk is unstable and a stabilising, co-accreting “disk/corona+wind” system forms. The minimum accretion rate is , where n=0.06 is the efficiency of the accretion, a=0.1 is the viscosity coefficient and m is the mass of the black hole. This gives a minimum accretion rate of (1-4) for m in the range M⊙. Providing that the accretion rate in NGC4698 is low, this model explains the absence of broad emission lines. Assuming that the mass of the black hole residing in NGC4698 is the typical 106M⊙ for Seyfert galaxies, the X-ray luminosity in the 2-10 keV energy band (2.2 ) is 3 orders of magnitude lower than the observed X-ray luminosities ( ) in Seyfert 1 galaxies. This discrepancy could easily attributed to a lower accretion rate, which immediately explains the absence of broad emission lines in the spectrum of NGC4698.
The lack of column density could also be explained by the presence of a dusty warm absorber. The presence of dust accounts for the optical obscuration of the broad line region, whereas the lack of X-ray absorption is due to the ionisation state of the absorber. In such a case cold absorption is no longer required. We note here that when we discuss dusty warm absorber models we should consider that there are two grain destruction mechanisms that must be taken into account. Firstly the sublimination of the grains when they become too hot ( 2000 K) and secondly, thermal sputtering, which destroys the dust once the gas electron temperature reaches K(Draine Salpeter 1979; Laor Draine 1993). Assuming that the warm absorber is photoionised, the gas temperature in a typical warm absorber where oxygen is highly ionised is only TK and thermal sputtering is negligible. If collisional ionisation plays a significant role then T K and the dust will be destroyed. However, Reynolds et al. (1997) showed that photoionisation dominates the ionisation of the plasma unless r100 pc, where r is the distance of the warm absorber from the central engine. In this case a dusty warm absorber model is viable. Komossa et al. (1998) predicted the presence of a Carbon edge at 0.28 keV and showed that the dusty warm absorber smoothes the oxygen edges making it difficult to be detected. Unfortunately ASCA is not sensitive enough at these soft energies, and we cannot test an actual dusty warm absorber model to our data. Since at energies above 0.3 keV both the dusty warm absorber and the warm absorber are expected to imprint similar spectral features in the spectrum and because the X-ray photons are not affected by the dust, we fit our data in the energy range 0.5-10 keV with a warm absorber model in order to examine the possibility of the presence of ionised material in the very central region of NGC4698. Although we obtain a good fit to the data ( for 265 d.o.f )the ionisation parameter of the warm material is unphysically high implying that the data do not require any kind of absorption. Further clues on the nature of this galaxy can be given by looking for short time variability in the 2-10 keV band. The data do not show evidence for variability, however we note that this could be due simply to our limited photon statistics.
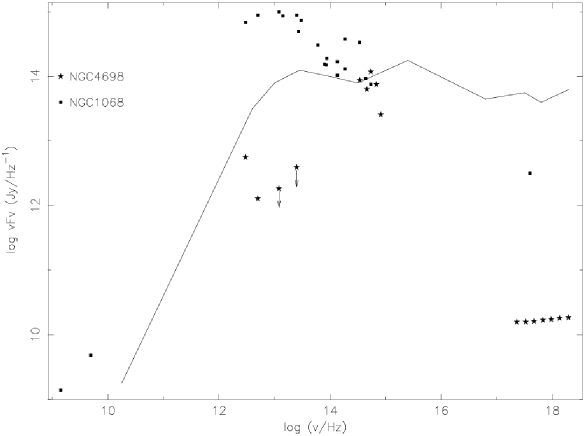
An insight into the energy production mechanisms at different wavebands can come from the spectral energy distribution (SED) of the galaxies. The SED for NGC4698 (fig.2, stars) reveals an unexpected emission distribution compared to the median radio-quiet (solid line) SED of Elvis et al. (1994). For comparison we also show the SED of the archetypal Compton thick Seyfert 2 galaxy NGC1068 (squares). It is clear that the NGC4698 SED deviates from both the typical AGN and the Compton thick AGN SED. The latter confirms our analysis that NGC4698 is not a Compton thick Seyfert 2 galaxy.
To investigate the differences we computed the ’optical/X-ray’ spectral index (Tananbaum et al. 1974) between 2500 and 2 keV, which is defined as: =-0.384 log . Since there are no measurements in the ultraviolet we made the conservative assumption that the there is no UV bump and we extrapolate from the optical into the UV as a straight line in the space. Then 2.5. Typically it is found that 1.4 for AGNs. It is evident that NGC4698 is relatively weak in the X-rays. However as has already been shown, there is evidence that the weakness is intrinsic and not due to absorption, unless the UV and or X-ray emission vary significantly. We then computed the IR/HX ratio as defined by Mulchaey et al. 1994 and obtained 1.5. This is an upper limit since the flux at 25m is an upper limit. However it is clear that the ratio is comparable to that of Seyfert galaxies (Mulchaey et al. 1994). The discrepancy between the SED of NGC4698 and that of other AGNs could be explained by either an excess in the optical emission or by a deficit in both the IR and X-ray emission. However caution must be taken in interpreting the SED, since the measurements have been taken at different epochs and using different apertures.
6.3 The distribution of absorbing columns and its implications for the X-ray background
The X-ray background is believed to be produced by the superposition of discrete sources. In the soft band at a flux limit of the dominant population are broad line AGNs (Hasinger et al. 1998). ASCA resolved only of the 2-10 keV CXB into discrete sources (Georgantopoulos et al. 1997) the majority of which are again broad line AGNs. However broad line AGNs have power-law spectra with a photon index of (Nandra Pounds, 1994), which is significantly softer than that of the CXB in that band (, Gendreau et al. 1995). Thus there must be a large number of undetected objects which have harder X-ray spectra than the local broad-line AGNs. This population should be obscured because it does not come up in the softer energies.
The deep Chandra surveys deepened the riddle of the origin of the XRB even further. In the hard 2-10 keV band they probed fluxes at least an order of magnitude deeper than ASCA (Mushotzky et al. 2000) albeit with limited number statistics due to the small field-of-view of ACIS onboard Chandra. A large fraction of the detected sources is associated with QSOs which appear to have steep spectra. Surprisingly, no numerous, clearcut examples of the putative obscured AGN population at high redshift have yet been found. Instead, two ’new’ populations emerged which are associated with either early-type galaxies or extremely faint optical counterparts.
All the current models which try to reconstruct the X-ray background spectra utilise a population of objects with an underlying spectral index equivalent of those of unobscured AGNs and a range of obscuring columns. Observational support for such a model comes from the detection in deep ROSAT surveys (Boyle et al. 1995) of a large number of faint X-ray sources whose optical counterparts are galaxies with narrow lines only and thus they consider to be that ’obscured ’ AGN population as well as the lack of a population with spectral index similar to the X-ray background which again indicate that a large population of heavily obscured AGN should emerge at hard energies.
Our analysis suggests that simple models cannot describe the spectrum of the Seyfert 2 galaxies adequately. Especially in the case of heavily obscured or Compton thick objects, where the medium and/or hard X-ray emission is suppressed and emission from the host galaxy, circumnuclear starbursts and/or warm absorbers contributes significantly and imprints features on the spectrum. Surprisingly also two of our Seyfert 2s (NGC3147 and NGC4698) do not show evidence for absorption above the Galactic. It becomes evident that the complexity of the Seyfert 2 spectrum should be taken into account when constructing models for the synthesis of the X-ray background.
In addition, latest results from ASCA and BeppoSAX (Pappa et al. in preparation, Comastri et al. 2000, respectively) show that there is a population of objects at high redshifts, with broad lines in optical, which have high amounts of X-ray absorption. All the above suggest that the distribution of column densities is complex, and one cannot use a simple recipe for the distribution. The compilation of large optically selected or IR selected Seyfert 2 samples, the determination of the X-ray spectrum of Seyfert 2 galaxies as well as the study of obscured AGN at high redshift will shed new light on the X-ray background synthesis models.
7 Conclusions
We have presented a systematic analysis of 8 bona-fide Seyfert 2 galaxies. We selected sources from the Ho et al. spectroscopic sample of nearby galaxies. We included all the brightest Seyfert 2 galaxies, for which X-ray data were or became available. Our uniform analysis showed that in general our objects show a complex X-ray spectrum. On the basis of the the Compton thick possibility was ruled out for two of our low absorption objects, namely NGC3147 and NGC4698, leaving open questions for the nature of these objects. We propose that the deficit in absorption maybe either due to the presence of a dusty warm absorber or due to the lack of broad line region. In the latter case the Seyfert 2 appearance is intrinsic and an absorption medium is no longer required. Furthermore, for NGC2273, spectral analysis favours the scattering model. However the column density could not be constrained, thus we could not distinguish between the Compton thin and thick interpretations. Yet its flux is too low, and favours the Compton thick interpretation. In the case of M51, where the reflection dominated Compton thick model is not favoured by the data but its is low, we argue that the discrepancy may be explained either with a warm scatter model for the hard X-ray emission or optical or X-ray variability. Finally we suggest that the above results may be important in the study of the X-ray background, since all the current XRB synthesis models utilise a population of object with an underlying spectral index equivalent of those of unobscured AGNs and a range of obscuring columns, whereas our results suggests that there are type 2 objects with spectrum quite untypical of the one expected and that the X-ray spectrum is composed by several components, which should be taken into account when constructing such models.. Discovery of more Seyfert 2 galaxies with spectra distinct to the ’nominal’ Seyfert 2 spectra will show whether these objects contribute significantly to the X-ray background or not, while XMM-Newton observations of Seyfert 2 galaxies will allow us to determine the spectral components contributing to the total X-ray spectrum and Chandra observations to deconvolve any extended emission.
8 Acknowledgments
The authors would like to thank the referee R. Maiolino for useful comments and suggestions. AP wishes to thank Prof. M. Ward for useful discussions and K. Anagnostou for his useful help throughout the writing of this paper. This research has made use of data obtained through the High Energy Astrophysics Science Archive Research Center Online Service, provided by the NASA/Goddard Space Flight Center, the LEDAS online service, provided by the University of Leicester and the NASA/IPAC Extragalactic Database (NED) which is operated by the Jet Propulsion Laboratory, California Institute of Technology, under contract with the National Aeronautics and Space Administration.
References
- [1] Bassani L., Dadina, M., Maiolino, R., Salvati, M., Risaliti, G., della Ceca, R., Matt, G., Zamorani, G.,1999, ApJS, 121,473
- [2] Boyle B.J., McMahon R.G., Wilkes B.J., Elvis, M., 1995, MNRAS, 272, 462
- [3] Collin-Souffrin S., 1987, ApJ, 179, 60
- [4] Comastri A., Setti G., Zamorani G., Hasinger G., 1995, A&A, 296, 1
- [5] Dickey J.M., Lockman F.J., 1990, ARAA, 28, 215
- [6] Draine B.T. Salpeter E.E., 1979, 231, 438
- [7] Ehle M., Pietsch W., Beck R., 1995, A&A, 295, 289
- [8] Elvis M., et al. , 1994, ApJS, 95, 1
- [9] Fabbiano G., Feigelson E., Zamorani G., 1982, ApJ, 256, 397
- [10] George I.M., Turner T.J., Netzer H., Nandra K., Mushotzky R.F., Yaqoob T., 1998, ApJS 114, 73
- [11] Gendreau K.C. et al. , 1995, PASJ, 47, L5
- [12] Gilli R., Comastri A., Brunetti G., Setti G., NewA, 4, 45
- [13] Hasinger G., Burg R., Giacconi R., Schmidt M., Trumper J., Zamorani G., 1998, A&A, 329, 482
- [14] Ho L.C., Filippenko A.V., Sargent W.L.W., Peng, C.Y., 1997, ApJS, 112, 391
- [15] Komossa S. Bade N., 1998, AA, 331, 49L
- [16] Laor A., Draine B.T., 1993, ApJ, 402, 441
- [17] Makishima K., Ohashi T., Kondo H., Palumbo G.G.C., Trinchieri G., 1990, ApJ, 365, 159
- [18] Maiolino R., Salvati M., Bassani L., Dadina M., Dela Ceca R., Matt G., Risaliti G., Zamorani G., 1998, A&A, 338, 781
- [19] Maiolino R., Rieke G.H., 1995, ApJ, 454, 95
- [20] Maiolino R., Ruiz M, Rieke G.H., Keller L.D., 1995, ApJ, 446, 561
- [21] Marston A.P., Elmegreen D., Elmegreen B., Forman W., Jones C., Flanagan K., 1995, ApJ, 438, 663
- [22] Matt G. et al. 1997, AA, 325, 13
- [23] Matt G. et al. , 1999, AA, 341, 39
- [24] Matt G., Fiore, F., Perola, G.C., Piro, L., Fink, H.H., Grandi, P., Matsuoka, M., Oliva, E., Salvati, M., 1996, MNRAS, 281, L69
- [25] Morrison R. McCammon D., 1983, ApJ, 270, 119
- [26] Nandra K. & Pounds K., 1994, MNRAS, 268, 405
- [27] Palumbo G.C.C., Fabbiano G., Trinchieri G., Fransson C., 1985, ApJ, 298, 259
- [28] Pappa A., et al. , in preparation
- [29] Pietsch W., Trinchieri, G., Vogler, A., 1998, A&A, 340, 351
- [30] Polletta M., Bassani L., Malaguti G., Palumbo G.G.C., Caroli E., 1996, ApJS, 106, 399
- [31] Ptak A., Yaqoob T., Serlemitsos P. J., Kunieda H., 1996, ApJ, 459, 542
- [32] Ptak A., Serlemitsos P. J., Yaqoob T., Mushotzky R., 1999, ApJS, 120, 179
- [33] Rephaeli
- [34] Read A.M., Ponman T.J., Strickland D.K., 1997, MNRAS, 286, 626
- [35] Rephaeli Y., Gruber D., Persic M., 1995, A&A, 300, 91
- [36] Reynolds C.S., Ward M.J., Fabian A.C., Celotti A., 1997, MNRAS, 291, 403
- [37] Risaliti G., Maiolino R., Salvati M., 1999, ApJ, 522, 157
- [38] Sandage A. Tammann G.A., 1981, A Revised Shapley-Ames Catalog of Bright Galaxies (Washington: Carnegie Istitution of Washington)
- [39] Smith D., Done C., 1996, 280, 355
- [40] Tanaka Y., et al. 1995, Nature, 275, 659
- [41] Tananbaum H., et al. 1079, ApJ, 234, L9
- [42] Terashima Y., Ptak A., Fujimoto R., Itoh M., Kunieda H., Makishima K., Serlemitsos P.J, 1998, ApJ, 496, 210
- [43] Tran H.D, 1995, ApJ, 440, 565
- [44] Turner T.J. Pounds K.A., MNRAS, 240, 833
- [45] Turner T.J., George, I.M., Nandra K., Mushotzky R., 1997, ApJS, 113,23
- [46] Ueno S., Law-Green S.D, Awaki H., Koyama K., 1998, IAUS, 188, 432
- [47] Witt H.J., Czerny B., Zycki P.T., 1997, MNRAS, 286, 848