Small-Scale Interstellar Na I Structure Toward M92
Abstract
We have used integral field echelle spectroscopy with the DensePak fiber-optic array on the KPNO WIYN telescope to observe the central 27″ 43″ of the globular cluster M92 in the Na I D wavelength region at a spatial resolution of 4″. Two interstellar Na I absorption components are evident in the spectra at LSR velocities of 0 km s-1 (Cloud 1) and -19 km s-1 (Cloud 2). Substantial strength variations in both components are apparent down to scales limited by the fiber-to-fiber separations. The derived Na I column densities differ by a factor of 4 across the Cloud 1 absorption map and by a factor of 7 across the Cloud 2 map. Using distance upper limits of 400 and 800 pc for Cloud 1 and Cloud 2, respectively, the absorption maps indicate structure in the ISM down to scales of 1600 and 3200 AU. The fiber-to-fiber Na I column density differences toward M92 are comparable to those found in a similar study of the ISM toward the globular cluster M15. Overall, the structures in the interstellar components toward M92 have significantly lower column densities than those toward M15. We interpret these low column density structures as small-scale turbulent variations in the gas and compare them to the larger-scale, higher column density variations toward M15, which may be the hallmarks of actual H I structures.
1 Introduction
A significant number of studies within the last decade have served to reinforce the case for sub-parsec structure within the diffuse interstellar medium (ISM). A longstanding method for investigating this phenomenon has been H I 21 cm interferometric observations toward extragalactic sources (Diamond et al., 1989; Faison et al., 1998). Another technique uses multiepoch observations toward pulsars as they travel a few tens of AU each year through the ISM (Frail et al., 1991, 1994). These observations have repeatedly shown variations down to scales of 10 - 100 AU. In the optical, studies have focused on individual stars in globular clusters (Bates et al., 1995) and binary star systems (Meyer & Blades, 1996; Watson & Meyer, 1996; Lauroesch et al., 1998; Lauroesch & Meyer, 1999), typically using the Na I D and K I lines. These observations have shown structure on scales of 102 - 104 AU for binary stars and 104 - 106 AU for globular clusters. Additionally, several recent studies have uncovered evidence for temporal variations in Na I, K I, and Ca II column densities toward individual and binary stars, suggesting structure at scales down to 10 - 100 AU (Crawford et al., 2000; Lauroesch, Meyer & Blades, 2000; Price, Crawford, & Barlow, 2000).
These H I, Na I, Ca II, and K I observations infer apparently dense concentrations of atomic gas ( 103 cm-3) appearing in diffuse sightlines. The standard McKee & Ostriker (1977) three-phase ISM theory does not sufficiently support the pervasiveness of this structure because the large overpressures it would exert on the ambient medium violates the assumption of pressure equilibrium. In one effort to remedy the situation, Heiles (1997) has hypothesized a solution involving sheets and filaments of gas that maintain pressure equilibrium, yet could produce significant differences in column density measurements and the illusion of rather high volume densities. Elmegreen (1997) offers another interpretation which eliminates the necessity of pressure equilibrium by suggesting that a fractal ISM results from turbulence, allowing self-similar structure to exist down to AU scales. Other theories propose that self-gravitating, dense, AU-sized cloudlets may be a common neutral component of the Galactic ISM (Walker & Wardle, 1998; Draine, 1998).
Integral field spectroscopy can be used to gain a two-dimensional perspective of this small-scale structure. A recent study used this technique to map the ISM structure toward the globular cluster M15 (Meyer & Lauroesch, 1999). Just as H I observations toward extragalactic sources offer two-dimensional views of similar structure observed in one dimension toward pulsars, these integral field spectroscopic observations toward globular clusters provide two-dimensional maps of similar structure observed in one dimension toward binary stars. The globular cluster M92 ( = 8.6 kpc; = -103 km s-1) was selected to continue this study. Past observations of individual stars in M92 show interstellar Na I absorption with strengths varying by a factor of 4 on scales down to 4′ (Langer, Prosser, & Sneden, 1990; Pilachowski et al., 1998). In this Letter, we present two-dimensional maps of the Na I absorption toward the central 27″ 43″ of M92 in an effort to probe the small-scale ISM structure in another Galactic halo sightline.
2 Observations and Data Reduction
We used the DensePak fiber-optic array and the Bench spectrograph on the 3.5 m WIYN111The WIYN Observatory is a joint facility of the University of Wisconsin-Madison, Indiana University, Yale University, and the National Optical Astronomy Observatories. telescope at Kitt Peak National Observatory to obtain observations of M92 in 2000 April. DensePak is an integral field spectroscopy unit, consisting of 91 fibers arranged to give a sky coverage of 27″ 43″ with a fiber (3″ diameter) center-to-center separation of 4″ at the WIYN f/6.4 Nasmyth focus (Barden, Sawyer, & Honeycutt, 1998). The DensePak array was oriented in a north-south direction across the core of the globular cluster, with the central fiber set at the center of M92 [R.A. = 17h17m073, decl. = +43°08′115 (J2000.0)]. The configuration of the spectrograph was the same as described by Meyer & Lauroesch (1999), providing spectral coverage from 5725 to 5975 Å at a resolution of 14 km s-1 ( 20,000).
Three 1200 s exposures were taken of M92 with sky conditions characterized by 1″ seeing. The raw CCD frames were bias-corrected, flat-fielded, sky-subtracted (in two separate stages, the continuum and the terrestrial emission lines, using a 1200 s exposure of adjacent blank sky), combined, and wavelength-calibrated using the NOAO IRAF data reduction software. Previous observations enabled us to assume that the uncertainty in these spectra caused by scattered-light effects should be negligible (Meyer & Lauroesch, 1999). Five broken fibers and eight more with low counts were not used, leaving 78 of the 91 fibers providing spectra with signal-to-noise ratios ranging from 30 in some edge fibers to over 80 near the center. The very weak telluric absorption near the Na I D2 5889.951 and D1 5895.924 lines was removed by dividing the spectra by an atmospheric template based on observations of several rapidly rotating early-type stars with little intervening interstellar matter.
Figure 1 exhibits a detailed view of the final Na I spectra corresponding to the center of M92 and three other positions in the array.

Three Na I doublets appear, with the interstellar lines strongly blended: the bluemost is due to stellar Na I absorption in M92, the middle component (Cloud 2) is due to interstellar gas at vLSR = -19 km s-1, and the redmost component (Cloud 1), is due to gas at vLSR = 0 km s-1. Figure 1 also shows evidence that both absorption components vary on scales much less than 1′. Over the entire DensePak array, the Na I D1 line equivalent widths vary from 30 to 100 mÅ for Cloud 1 and 15 to 115 mÅ for Cloud 2. Column density measurements were determined using the profile-fitting software XVOIGT (Mar & Bailey, 1995) by fitting the D2 and D1 lines simultaneously in each fiber, assuming single-component Voigt profiles for both of the clouds’ Na I doublets. The line widths (-values) were typically around 2 km s-1 and 1.5 km s-1 for Cloud 1 and Cloud 2, respectively. The column density fits have formal profile-fitting uncertainties of about 10% - 20%.
The assumption that Cloud 1 and Cloud 2 each consist of a single ISM component is a simplification. Although we cannot rule out multiple component structure, the overall effect on the small-scale structure analysis should be insignificant because the Na I lines are weak enough so that the equivalent width measurement errors should dominate the uncertainties. Furthermore, there are no systematic velocity variations in Cloud 1 and Cloud 2 across the DensePak array, which reinforces the simplifying assumption of single ISM components. Based on the F2 composite spectral type and extremely low metallicity ([Fe/H] = -2.29) of M92, the only possible stellar absorption (besides the stellar Na I lines) in the vicinity of the interstellar Na I features are the Ni I 5892.883 and Ti I 5899.304 lines (Montes, Ramsey, & Welty, 1999). Since these lines would lie about 1 Å from the Cloud 1 and Cloud 2 Na I features and are not apparent in the spectra in any case, any stellar contamination of our measured Na I column densities should be minimal.
3 Discussion
Lilienthal et al. (1991) have measured interstellar Na I absorption at vLSR = 0 km s-1 toward HD 155639 ( 200 pc; 275 separation from M92) and somewhat stronger absorption toward HD 157908 ( 400 pc; 375 separation from M92). From these observations, we can place an upper limit of 400 pc on the distance to Cloud 1. In the case of Cloud 2, we first note that Münch & Zirin (1962) observed interstellar Ca II at LSR velocities of 0 km s-1 and -19 km s-1 toward HD 156110 ( 800 pc; 24 separation from M92). For confirmation, we used STIS UV echelle spectra of this star from the HST archive. The C I and C I⋆ lines in these spectra, as well as the H I 21 cm emission lines from the Dwingeloo Survey (Hartmann & Burton, 1997), exhibit interstellar components with similar velocities. We also obtained Ca II and Na I data from the Kitt Peak coudé feed telescope, which again showed the same interstellar velocity components toward HD 156110. From this data we can place a distance upper limit of 800 pc on this cloud.
Using these distance estimates, the 27″ 43″ DensePak array coverage corresponds to a 10,800 17,200 AU (0.05 0.08 pc) section of Cloud 1 and a 21,600 34,400 AU (0.10 0.17 pc) section of Cloud 2. The 4″ fiber-to-fiber spacing then translates to 1600 and 3200 AU in Cloud 1 and Cloud 2, respectively. The derived Cloud 1 Na I column densities extend from 3.3 1011 to 1.2 1012 cm -2. The maximum (Na I) variation observed across the 1600 AU scale is 6.5 1011 cm-2, and the median (Na I) is 1.2 1011 cm-2. Cloud 2 generally has higher Na I column densities, with individual fiber values ranging from 4.9 1011 to 3.6 1012 cm-2. Over the 3200 AU scale, the maximum (Na I) variation in this cloud is 2.9 1012 cm-2, and the median (Na I) is 3.3 1011 cm-2.
The M92 data presented here introduces some interesting differences and similarities with M15, the only other globular cluster studied in this way to date (Meyer & Lauroesch, 1999). First, the observations were performed slightly differently, with the fainter M92 receiving only 70% of the exposure time of M15 due to poor weather, resulting in lower signal-to-noise ratios for M92. The interstellar components toward M92 are only somewhat resolved, whereas the M15 clouds are well separated in velocity. Aside from these issues, the final maps are directly comparable. The M92 and M15 absorption maps presented in Figure 2 show a striking difference, but also an important similarity.
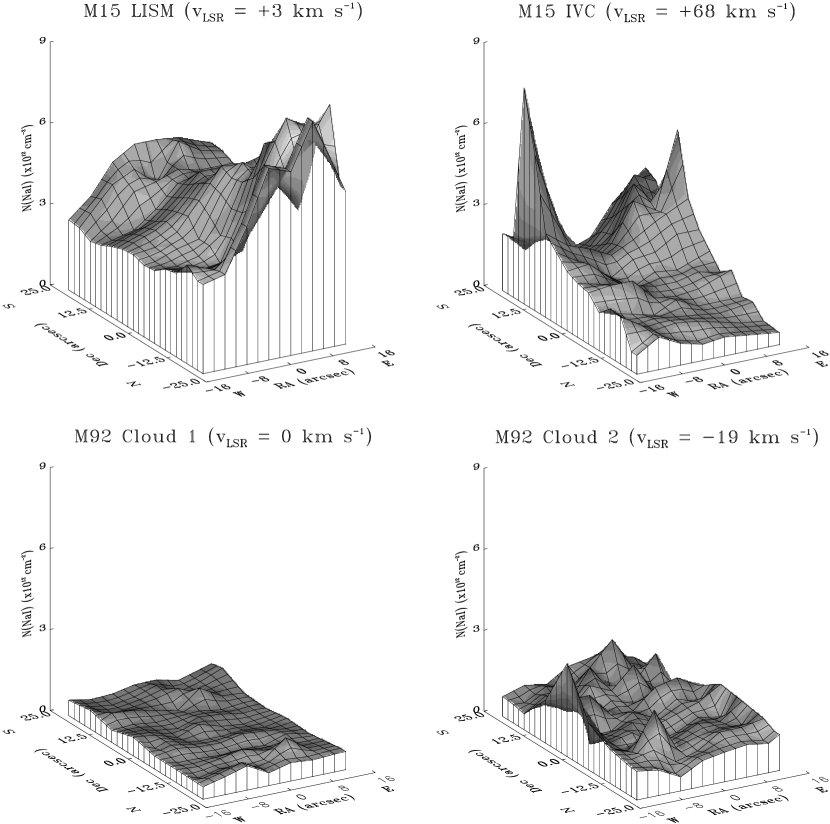
Unlike the M92 maps, the M15 maps show large, high column density features. However, the low column density regions of the M15 maps are virtually identical to the M92 maps. Regardless of the contrasts between the maps, the variations toward M92 are appreciably larger than the column density measurement errors, thus ruling out the possibility that they are merely random noise fluctuations. For example, the NW feature in the Cloud 2 component toward M92 (lower right map of Figure 2) has a column density enhancement relative to the local Na I baseline that is approximately 4.5 times the measurement uncertainty. The similarities between the maps suggest that the M92 variations are typical in low Na I column density components. Even though the M15 columns are generally higher than those of M92, and have a greater dynamic range in (Na I), the median fiber-to-fiber column density differences are comparable, statistically reaffirming that we have measured similar variations in lower column density gas.
The physical interpretation of these variations is uncertain. The possibilities are that the observed Na I structures are caused by real H I structures or fluctuations in the physical conditions of the gas. The former interpretation is speculative as Na I is not a dominant ion in H I clouds, and therefore does not necessarily trace H I structure. While it has been shown that empirical estimates of (H I) from (Na I) can be made when diffuse Galactic clouds have (Na I) 1012 cm-2 (Hobbs, 1974; Welty, Hobbs, & Kulkarni, 1994), the use of this relationship in the case of any structures in the M92 maps would be somewhat dubious because the column densities measured are typically below or comparable to this limit. The latter interpretation relies on fluctuations in the Na ionization equilibrium, or equivalently the (Na I)/(H) ratio. Lauroesch et al. (1998) discovered that (Na I) and other neutral species vary toward the binary Cru, whereas Zn II, a dominant ion, does not. This suggests that interstellar (Na I) variations could be the result of small-scale perturbations in the Na ionization equilibrium, caused by density and/or fluctuations.
The comparison between the M92 and M15 maps provides a new perspective on the Na I structure. Namely, the variations toward M92 and the low column density regions of M15 may be small-scale undulations in the gas structure due to turbulence or other variations in physical conditions, whereas the larger features in the high column density regions of the M15 maps may be representative of actual H I structures. Utilizing integral field spectroscopy to continue to map ISM structure in both low and high Na I column density components toward other extended background sources will help to test this idea.
To summarize, our observations show that two components of the ISM toward M92 exhibit significant structure down to scales of a few arc seconds, which could be indicative of variations in H I column densities, and/or turbulent fluctuations in the physical conditions of low column density interstellar components. The complimentary low column density features among the M92 and M15 maps uncovers an interesting possible interpretation of these structures and the relationships between the larger variations toward M15 and H I structures. With continued absorption-line mapping of interstellar components toward these and other globular clusters using instruments like DensePak, it is possible to further examine the spatial structure of diffuse Galactic clouds over a wide range of physical scales. Additionally, as recently shown by Roth, Meyer, & Lauroesch (2000), this same technique can probe similar structure using galaxies as background sources, perhaps providing interesting new information about high-velocity clouds or the ISM in other galaxies.
References
- Barden, Sawyer, & Honeycutt (1998) Barden, S. C., Sawyer, D. G., & Honeycutt, R. K. 1998, Proc. SPIE, 3355, 892
- Bates et al. (1995) Bates, B., Kemp, S. N., Keenan, F. P., & Davies, R. D. 1995, ApJ, 444, 672
- Crawford et al. (2000) Crawford, I. A., Howarth, I. D., Ryder, S. D., & Stathakis, R. A. 2000, MNRAS, 319, L1
- Diamond et al. (1989) Diamond, P. J., Goss, W. M., Romney, J. D., Booth, R. S., Kalberla, P. M. W., & Mebold, U. 1989, ApJ, 347, 302
- Draine (1998) Draine, B. T. 1998, ApJ, 509, L41
- Elmegreen (1997) Elmegreen, B. G. 1997, ApJ, 477, 196
- Faison et al. (1998) Faison, M. D., Goss, W. M., Diamond, P. J., & Taylor, G. B. 1998, AJ, 116, 2916
- Frail et al. (1991) Frail, D. A., Cordes, J. M., Hankins, T. H., & Weisberg, J. M. 1991, ApJ, 382, 168
- Frail et al. (1994) Frail, D. A., Weisberg, J. M., Cordes, J. M., & Mathers, C. 1994, ApJ, 436, 144
- Hartmann & Burton (1997) Hartmann, D., & Burton, W. B. 1997, Atlas of Galactic Neutral Hydrogen, Cambridge; New York: Cambridge University Press, ISBN 0521471117
- Heiles (1997) Heiles, C. 1997, ApJ, 481, 193
- Hobbs (1974) Hobbs, L. M. 1974, ApJ, 191, 381
- Langer, Prosser, & Sneden (1990) Langer, G. E., Prosser, C. F., & Sneden, C. 1990, AJ, 100, 216L
- Lauroesch et al. (1998) Lauroesch, J. T., Meyer, D. M., Watson, J. K., & Blades, J. C. 1998, ApJ, 507, L89
- Lauroesch & Meyer (1999) Lauroesch, J. T., & Meyer, D. M. 1999, ApJ, 519, L181
- Lauroesch, Meyer & Blades (2000) Lauroesch, J. T., Meyer, D. M., & Blades, J. C. 2000, ApJ, 543, L43
- Lilienthal et al. (1991) Lilienthal, D., Hirth, W., Mebold, U., & de Boer, K. S. 1991, A&A, 255, 323
- Mar & Bailey (1995) Mar, D. P., & Bailey, G. 1995, Proc. Astron. Soc. Australia, 12, 239
- McKee & Ostriker (1977) McKee, C. F., & Ostriker, J. P. 1977, ApJ, 218, 148
- Meyer & Blades (1996) Meyer, D. M., & Blades, J. C. 1996, ApJ, 464, L179
- Meyer & Lauroesch (1999) Meyer, D. M., & Lauroesch, J. T. 1999, ApJ, 520, L103
- Montes, Ramsey, & Welty (1999) Montes, D., Ramsey, L. W., & Welty, A. D. 1999, ApJS, 123, 283
- Münch & Zirin (1962) Münch, G., & Zirin, H. 1961, ApJ, 133, 11M
- Pilachowski et al. (1998) Pilachowski, C., Langer, E., Sneden, C., & Kraft, R. 1998, BAAS, 30, 870
- Price, Crawford, & Barlow (2000) Price, R. J., Crawford, I. A., & Barlow, M. J. 2000, MNRAS, 312, L43
- Roth, Meyer, & Lauroesch (2000) Roth, K. C., Meyer, D. M., & Lauroesch, J. T. 2000, BAAS, 32, 1455
- Walker & Wardle (1998) Walker, M., & Wardle, M. 1998, ApJ, 498, L125
- Watson & Meyer (1996) Watson, J. K., & Meyer, D. M. 1996, ApJ, 473, L127
- Welty, Hobbs, & Kulkarni (1994) Welty, D. E., Hobbs, L. M., & Kulkarni, V. P. 1994, ApJ, 436, 152