The ATCA Intraday Variability Survey of Extragalactic Radio Sources
Abstract
We present the results of an Australia Telescope Compact Array (ATCA) survey for intra-day variability (IDV) of the total and polarized flux densities of 118 compact, flat spectrum, extragalactic radio sources from the Parkes 2.7 GHz Survey. A total of 22 total flux density IDV sources were discovered and 15 sources were found to show IDV of their polarized flux density. We discuss the statistical properties of the IDV sources, including the distribution of source modulation indices, and the dependence of the variability amplitude on source spectral index and on Galactic position. We suggest interstellar scintillation (ISS) in the Galactic interstellar medium as the most likely mechanism for IDV. Even so, the inferred high brightness temperatures cannot be easily explained.
Keywords: active galactic nuclei: blazars and intraday variability – interstellar medium: interstellar scintillation
1 Introduction
The first systematic investigation of short time scale variability in a large sample of extragalactic radio sources was carried out by Heeschen (1984). He observed a sample of 226 strong sources (Jy) at 9 cm. Most of the compact, flat spectrum sources in his sample showed significant flux density fluctuations, with an average amplitude of 1.5% on time scales of 2-20 days. The steep spectrum radio sources did not appear to vary. This, so called flickering was interpreted in terms of refractive scintillations caused by the inhomogeneous structure of the interstellar medium in our Galaxy.
A search for more rapid and possibly stronger flickering through better sampled observations of compact, flat spectrum radio sources was undertaken by Witzel et al. (1986) and Heeschen et al. (1987) at the 100m radio telescope of the Max Plank Institut für Radioastronomie (MPIfR) . They reported 10% flux density variations at 11 cm in the BL Lac object S5 0716+71 on a time scale of a day, and they also confirmed the statistical difference in the variability of steep and flat-spectrum radio sources.
Multi-frequency observations of intraday variable sources at MPIfR and the VLA suggested that the variability tends to be strongest at 2.7 GHz and well correlated between 8 and 2.7 GHz (Wagner & Witzel 1995). Monitoring of the polarized flux density for the two strongest IDV sources, S5 0716+714 and S5 0917+624, revealed polarization variability correlated with the total flux density fluctuations for S5 0716+714 and anti-correlated for S5 0917+624 (Wegner 1994). Rapid variability in the position angle of the polarized flux density was also reported in these sources (Quirrenbach et al. 1989).
The interest in IDV at cm wavelengths is motivated by the high brightness temperatures inferred from the variability timescales, well above the K inverse Compton limit (Kellermann & Pauliny-Toth 1969). Possible mechanisms which can lead to IDV fall into two categories, those intrinsic to the source (e.g. shocks in jets, coherent emission) and propagation effects, such as microlensing and ISS (see e.g. the review by Wagner & Witzel 1995). None of the models proposed has been successful in providing a complete description of the observed properties of this phenomenon. It is likely that both extrinsic and intrinsic mechanisms are responsible for the observed rapid flux density fluctuations at cm wavelengths. The present ATCA IDV Survey and monitoring program provides a large, uniform, high precision, multi-wavelength set of observations, which aims to describe the common properties of IDV sources and shed the light at the origin of short term variations.
2 The sample selection
The sample selected for the ATCA survey is drawn from the Parkes-Tidbinbilla Interferometer (PTI) flat spectrum ()222Hereafter, the spectral index is defined as where is the frequency of radiation and is the flux density. survey (Duncan et al. 1993). Sources were chosen which had a ratio of the PTI flux density to total flux density larger than 0.9. Flat-spectrum, compact components of radio sources are usually self-absorbed and coincide with the optical quasar or AGN (e.g. Jauncey et al. 1982). We chose such sources since (a) monitoring of flux density with an interferometer such as the ATCA can be done faster and more accurately for unresolved sources, and (b) it is known from previous studies (e.g. Heeschen et al. 1987) that flat-spectrum sources are more likely to show IDV than steep-spectrum sources.
The final sample contains 118 sources, randomly distributed over the southern sky for (Figure 8). They are listed in Table 1 along with identifications, galactic coordinates, redshift and measured source structure information. The sample contains 90 (76%) quasars, 13 (11%) BL Lacs, 7 (6%) galaxies and 8 (7%) unidentified sources.
3 Observations
The main objective of the Survey was to obtain well sampled, multi-frequency total and polarized flux density measurements for all sources in the sample within the 96 hours scheduled for each observing run. Our observations were carried out at the ATCA, an east-west earth-rotation synthesis interferometer, with six 22 metre antennas on a 6 km baseline (Sinclair & Gough 1991). The ATCA has a number of desirable features for a study of short timescale variability:
-
(i)
short integration time which enables frequent sampling,
-
(ii)
broadband instantaneous frequency coverage,
-
(iii)
the high accuracy and sensitivity essential to monitor polarization and to explore the low amplitude, ‘flicker’ of extragalactic sources.
During the two observing sessions in May and August 1994, the flux densities of sources in the sample were measured every 2 hours at the four ATCA frequencies, 1.4, 2.4, 4.8 and 8.6 GHz. We used PKS 1934-638 as the primary flux density calibrator. Additionally the known steep spectrum sources PKS 0518+165, PKS 0134+329, PKS 1328+307 and PKS 0823500 were observed throughout each session to check the overall gain stability and calibration.
The observations were performed in continuum mode with 128 MHz bandwidth divided into 32 channels. This configuration enables measurements of four polarization products for each frequency. The sampling time was chosen to be 1 minute, which is equivalent to six 10 s integrations on source. To avoid long slew times, the sources were observed in two main groups, either north or south of zenith. Each group was observed over 24 hours with each source being observed every 2 hours while it was above 20 degrees elevation. The flux density of each source, including calibrators, was measured typically 6 times over 12 hours, and the measurements repeated in the same way 36 hours later.
The gain-stability was monitored by regular observations of PKS 1934-638 and the other non-variable sources, and so the scatter in their measured flux densities is an estimate of the uncertainties in the individual flux density measurements. This includes the effects of antenna pointing errors and gain changes with elevation and time.
The telescope pointing, typically 7 arcseconds rms, was determined before each observing session. The positions of all sample sources are known to an accuracy of 0.5 arcseconds or better, so that flux density errors due to miss-pointing do not exceed 0.1% at the highest frequencies. The observed rms errors for the primary flux density calibrator, PKS 1934-638 for an individual 1 minute observing scan are listed in Table 2 for each frequency. Thus, at the flux density limit, Jy, the gain stability and pointing errors dominate, while the thermal noise is typically less than a mJy.
The source structure information presented in columns 6-9 of Table 1 is derived from the closure phase estimates (Jennison 1958) of the possible extended component in the measured flux density given by:
| (1) |
where is the flux density averaged over 12 hours, is the observed rms of closure phases measured for all independent baselines and is a theoretically predicted rms of closure phases for a point source calculated by use of calibration from antenna noise diodes (Sault 1994). is a constant of the order of unity.
We find that most of the target sources of the ATCA IDV Survey are unresolved at 8.6 and 4.8 GHz. In particular, 72% of the sample sources show less than 1% extended flux density at 4.8 GHz. However only 22% and 5% of the sources at 2.4 and 1.4 GHz respectively satisfy this condition (Table 1).
Almost half of the sample (62 sources) shows more than 5% flux density in an extended component at 1.4 GHz. The effects of weak extended structure and confusing sources in the primary beam result in much larger object-dependent flux density errors at this frequency. Therefore the results of the 1.4 GHz measurements are excluded from the statistical discussion of the survey.
4 Results
4.1 Flux densities
The results of the Survey are presented in Table 3 and Table 4, which show the averaged total () and polarized () flux densities, averaged polarization position angles () and the corresponding modulation indices (, ).
The total flux densities in Table 3 are the averages of all 1-minute measurements within a given observing session over typically 96 hours. In each session the number of data points, used in the averages, ranges between 5 and 36 with a median of 11. Each data-point used to obtain the flux density in Table 3 is an average over all ATCA baselines of typically six 10-sec integrations.
Seven sources (PKS 0023263, PKS 0122003, PKS 0138097, PKS 208512, PKS 0454463, PKS 1253055 and PKS 2052474) were excluded from the sample because of the presence of either extended structure at all frequencies or strong confusing sources in the primary beam. A further 36 sources were found to be confused, or in a few cases, extended at 2.4 and 1.4 GHz. These have blank entries in Tables 3 and 4 at the corresponding frequencies. In this way the consistently high-quality data at high frequencies was maintained by reducing the size of the sample slightly. The final numbers of sources at each frequency in the Table 3 are 111 for 8.6 GHz, 105 for 4.8 GHz, 74 for 2.4 GHz and 55 for 1.4 GHz.
The 1.4 GHz data was not used in the IDV investigation, although the average flux densities have been retained in both Tables for the sources with .
The errors in the observed flux densities in Tables 3 and 4 have been determined from the observed scatter in the strong sources. Table 2 shows the observed scatter for the primary flux density calibrator PKS 1934638, the non-variable point source most frequently observed throughout each Survey session. The measured rms noise integrated over 1 minute never exceeds 4 mJy. With normalized flux density errors of no more than at each of the four frequencies, the present accuracy compares favourably with the precision of single dish measurements.
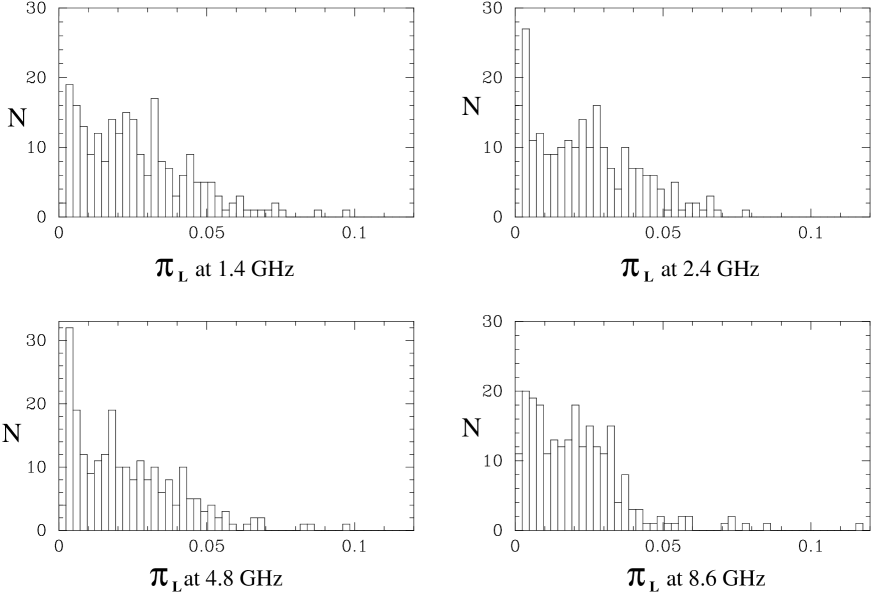
The ATCA antennas each have two, on-axis, orthogonal, linearly polarized feeds at all frequencies, which enable easy acquisition of all Stokes parameters. The polarized flux densities , and the position angles, , along with the modulation indices, , are presented for the 74 sources with mJy in Table 4. The degree of linear polarization observed for compact, flat-spectrum, synchrotron sources is typically a small fraction of the total flux density () (Aller at al. 1985), and this is the case for the majority of sources observed in the present Survey (Figure 1).
Monitoring sessions in May and August 1994 provided two datasets of the same sample. To determine if the data obtained in May and August 1994 is comparable in the statistical sense, we applied the Kolmogorov-Smirnov test for the source number distributions of normalized standard deviations or modulation indices, () of the flux density measurements. This found no statistically significant difference between the May and August 1994 results at the confidence level 0.05%.
4.2 Spectral index properties
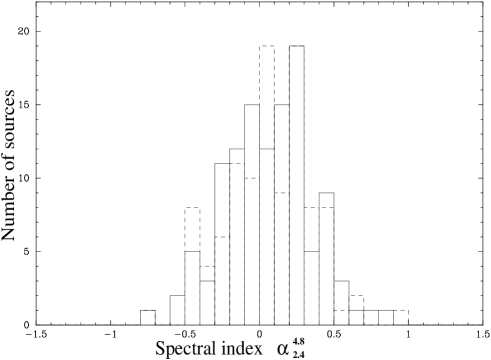
The average spectral indices: , , and are listed in Table 5. The uncertainty of the spectral index measurement depends on the modulation indices at the relevant frequencies and on the ratio of these frequencies. The estimated for non-variable sources is slightly dependent on the frequency pair used.
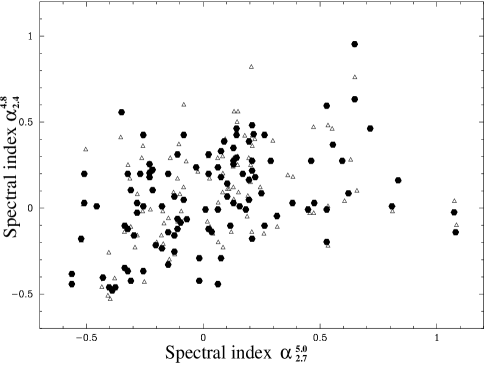
The distribution of the spectral indices is shown in Figure 2. There are only three sources with . If spectral indices are compared with indices measured with the Parkes telescope, it is evident that, while the sources may vary considerably, very few, if any of the original flat-spectrum sources change to steep-spectrum sources (Figure 2(b)). The differences in the distribution of spectral indices between May and August 1994 (Figure 2(a)) reflect the level of monthly variability of the flat-spectrum sources.
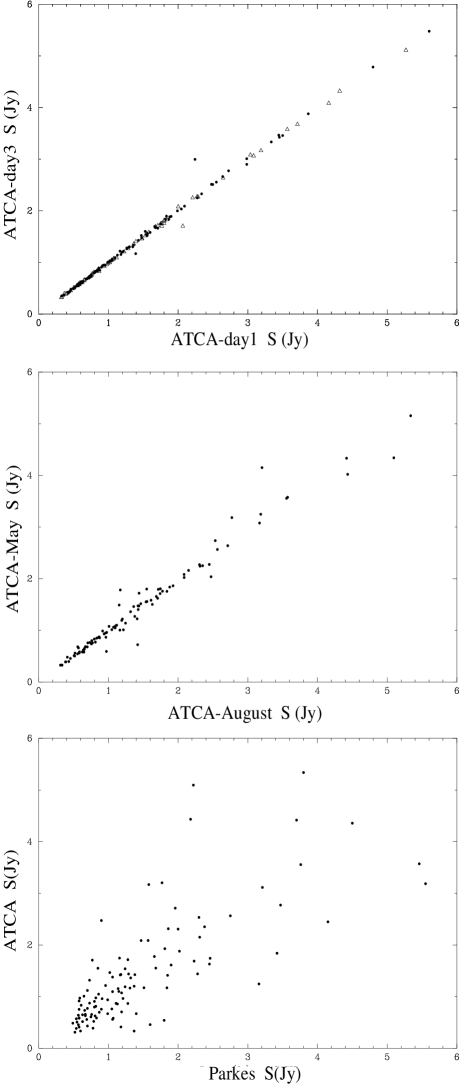
The flat-spectrum sources () remain flat-spectrum over much longer timescales, which is illustrated in the scatter plots of average flux densities shown for the increasing time difference between measurements (Figure 3).
The shapes of our four-frequency spectra can be described as: decreasing with frequency, straight, peaked, concave, inverted and complex. The largest population represented in the Survey sample (42 sources corresponding to 36%) are peaked spectrum sources. The second largest groups are 22 (19%) decreasing and 21 (18%) inverted spectrum sources. There are 3 (2.5%) sources with a straight spectrum (with mJy deviations from an line), 11 (9.3%) concave spectrum and 1 (0.8%) complex spectrum source.
The shape of the spectrum changed for the 15% of sources between two observing sessions. Interestingly, no transition from peaked to concave spectrum was observed. This may suggest that, at the typical timescale of months, the flux density changes are due to the slower ‘van der Laan - type’ evolution corresponding to the physical expansion of the region of the original outburst (van der Laan 1966).
4.3 Short-term variability
The normalized amplitude of variability is expressed in terms of a modulation index, , calculated over 96 hours, the duration of each observing session. Figure 3 illustrates the different timescales of flux density variations in our sample by comparing measurements obtained one day apart, 3 months apart and a few decades apart. While large flux density fluctuations over the short (day-to-day) timescales are rare in an ensemble of flat-spectrum, compact sources it is clear that all these sources vary significantly on a timescale of decades.
The number distribution of modulation indices is shown in Figure 4. The peaks in these distributions give an independent estimate of the normalized rms error in our measurements of flux densities. If one approximates each distribution by a Gaussian plus a tail of high modulation indices, the typical measurement rms values for the frequencies 8.6, 4.8, 2.4 and 1.4 GHz are 0.65, 0.6, 0.8 and 1.2% respectively. The increased rms distribution of modulation indices at 1.4 GHz is due to confusion and weak extended components present in the sources (as noted in section 3).
Those sources found in the tails of modulation indices distributions at different frequencies (Figure 4) are the sources, which exhibit significant IDV. There are 22 sources (19% of the total sample) which show modulation indices larger than at any frequency (8.6, 4.8 and 2.4 GHz) during either the May or August observing sessions. They are listed in Table 6.
In Table 6 there are 43 entries with typed in bold. If these were purely random events, rather than any real effect, one would expect to see 4 sources showing two entries with , and no sources with three or more entries. Yet there are 6 sources with two entries, and 6 sources with three entries, and one source, PKS 1519-273, with four entries. Such a high incidence of multiple entries suggests that the results presented in Table 6 represent a real effect.
Out of these 22 IDVs, 10 (45%) have a peaked spectrum, and 8 (36%) have an inverted spectrum. The highest incidence of IDV occurs for inverted spectrum sources (39% of all inverted spectrum sources in the sample), followed by peaked spectrum sources (24%) and decreasing spectrum sources (9%).
4.4 Long-term variability ( months)
The distribution of the fractional difference, , in the average flux density between May and August 1994 observations:
| (2) |
is shown in Figure 5. The measurement errors of the fractional difference are estimated from the rms of the flux density measurement distributions. The level is less than 4% for each frequency. We find sources which vary by more than 4% at 4.8 and 2.4 GHz. The number of sources variable on monthly timescales becomes larger with increasing frequency.
A substantial fraction of IDV sources are also long term variable (80% at 8.6 GHz, 75% at 4.8 GHz and 73% at 2.4 GHz). This characteristic may prove useful in future searches for IDV sources.
Out of the 22 IDV sources only six were found to show significant IDV in both observing sessions. The reminder of the sources (two thirds) has either a shorter duty cycle than months, or their variability decreases below our inclusion limit. PKS 0405385 is the most spectacular example of the short lived rapid variability (Kedziora-Chudczer et al. 1997). Yet the other strong IDV sources (PKS 1034293, PKS 1144379 and PKS 1519273) vary each time they were observed during the follow-ups of the Survey (Kedziora-Chudczer et al. 1998, 2000).
We also found that sources which show a difference in the shape of their total flux density spectrum between May and August sessions are twice as likely to show IDV as the sources without a significant spectral change. As seen from Figure 5 these monthly spectral changes are not necessarily associated with the overall strong flux density change at all frequencies.
4.5 Polarization variability
The polarization modulation index, , is defined as the rms of the polarized flux density normalized by the average polarized flux density. For the ATCA the instrumental polarization can be easily calibrated, therefore the main contribution to observed measurement errors comes from the antenna gain stability. The distribution of measured rms for three frequencies 8.6, 4.8 and 2.4 GHz is presented in Figure 6. An estimate of the measurement error, mJy, was derived by finding the range of rms within which two thirds of the sources are distributed around the peak of the distribution. Only 6 (8%) sources vary above at any frequency. These are PKS 0215+015, PKS 0537441, PKS 0607157, PKS 1144379, PKS 1334127 and PKS 1519273. The most significant variability of polarized flux is seen for sources which already were identified as IDVs in the total flux density. The polarized flux density IDV of PKS 1334127 is also independently found in VLBI data (Kochanev & Gabuzda 1998).
We also analysed the day-to-day polarization variability by self-calibrating each 24 hours of data, which is equivalent to averaging the total flux density over this time (Table 7). Main advantage of such an approach is that the signal-to-noise ratio can be improved not only by averaging but also by removing the residual of the extended structure and confusion. The contribution of the extended flux density repeats over each 24 hours provided the measurements are taken at similar hour angles each day and the confusing sources do not vary.
The distribution of the differences in polarized flux density between two days in each observing session is used to estimate the actual measurement error, mJy, which is only weakly dependent on frequency for the sources with polarization stronger than 15 mJy.
We find a number of sources with a total flux density IDV below 3 but with a clearly variable polarization during a given observing session (Table 7), which indicates that the variable polarized component is only a small fraction of a quiescent total flux density of such sources.
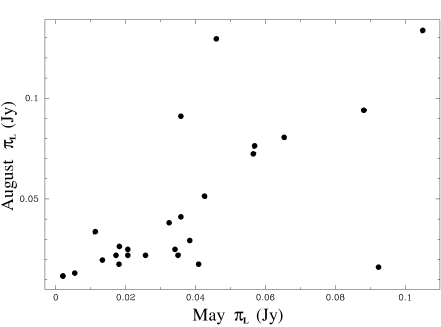
The changes in polarization over three months are illustrated in scatter plot (Figure 7) of the averaged, polarized flux density data between May and August 1994. The linear polarization appears to be more variable at high frequencies (4.8 and 8.6 GHz) similar to the monthly variations of the total flux density. Note that two sources (PKS 0646-306 and PKS 1610-771) show monthly changes in the polarized flux density without a significant change in their total flux density. We find that only three sources, PKS 0364-279, PKS 0537-441 and PKS 0607-157, show variable polarization on both the monthly and daily timescales.
5 Statistical Properties of IDV
Various models of IDV phenomenon predict that the amplitudes and timescales of variability can be related to the structure of the radio source, its properties or its position in relation to the plane of our Galaxy.
5.1 Dependence of modulation index on spectral index
Heeschen et al. (1987) showed that flat-spectrum sources are more likely to show intraday variability. We narrow that conclusion by finding that in our selection of flat-spectrum sources, those with inverted spectra over the observed range of frequencies, are more likely to show IDV than sources with other shapes of spectra. The flux densities of such sources are dominated by the most compact objects. This is an additional indicator that the rapid variability originates in the smallest source components.
The modulation index as a function of the four spectral indices (Table 5) was used to search for a correlation between high modulation index and inverted spectra. We calculated the mean spectral index for all non-variable sources () at a given frequency, and compared it with the mean spectral index of IDVs () for , and . The mean spectral index differences for these two groups of sources are -0.12, -0.06 and -0.05 respectively. The only significant difference occurred for high frequency spectral index, .
The lack of strong correlation between the spectral index and modulation indices suggests that the IDV strength is not a simple function of the source size.
5.2 Intraday variability as a function of Galactic coordinates
The interstellar scintillation (ISS) model predicts different amplitudes and timescales of IDV depending on the source position with respect to the plane of our Galaxy. The detailed properties of variability depend on the strength of the scattering in the Galactic medium as well as a size of the scintillating source (see eg. Narayan 1992, Walker 1998). The scattering strength is related to the amount of turbulence in the Galactic medium and it is derived mostly from observations of the scattering measure in pulsars. A model of the Galactic interstellar medium was developed by Taylor and Cordes (1993) from pulsar observations. Applying this model to the theory of ISS (Walker 1998), the following predictions can be made:
-
(i)
Variability of a point source is strongest and most rapid at the transition frequency, which corresponds to a scattering strength equal to unity. The transition frequency increases towards the Galactic plane and ranges from a few GHz near the Galactic poles to a few tens of GHz at the Galactic plane.
-
(ii)
The timescale of variability at the transition frequency is of the order of a few hours and does not depend strongly on the Galactic position.
-
(iii)
The angular size of a variable source has to be comparable to the size of the first Fresnel zone, at the transition frequency. The predicted source sizes are of the order of arcsecs. Sources larger than scintillate with decreased amplitude and longer timescale.
The sample of IDV sources found during the ATCA IDV Survey provides an opportunity to test the above model predictions. The Galactic positions of IDV sources from table 6 at one of the three frequencies 8.6, 4.8 and 2.4 GHz (Figure 8(a)) are compared with the Galactic distribution of all sources in the Survey (Figure 8(b)).
The ISS model predicts that the maximum variability for a source with should occur at the transition frequency, which in turn is a strong function of the Galactic latitude. From the Figure 8(a) it is quite clear that the distribution of variability maxima, which are marked with different symbols for different frequencies, does not follow this prediction. The maxima of variability at different frequencies appear randomly distributed in otherwise non-random region where IDV prevails. day-night effect (Kedziora-Chudczer 1998).
The reasons which may contribute to the lack of clear dependence of the frequency of strongest IDV on the Galactic latitude are the deficiencies of the ISM model, the source size effects and the uncertainties in measurement of modulation indices. The Taylor & Cordes model is most accurate at latitudes close to Galactic plane, where the number of pulsars is largest. An excess of IDV sources in the swathe between and of Galactic longitude reaching towards high Galactic latitudes may correspond to real features of the ISM which are not described well by the pulsar-based model.
The modulation index and timescale of variability depends on the size of the source. In figure 8 the maximum modulation index is assumed to occur at the transition frequency. However if the intrinsic size of the radio source increases with decreasing frequency as (Kellermann & Owen 1988), the peak of variability may occur at lower frequency than expected for the point source at a given latitude. This may explain the presence of low frequency ’-peakers’ at low Galactic latitudes. The sources, which show the highest at latitudes higher than expected from the Taylor & Cordes ISM model, may be explained, if their compact, variable components become self-absorbed at low frequencies.
In addition, the timescale of 96 hours may not be sufficient to sample over many scintles, especially at lower frequencies. Therefore our measured modulation indices are in many cases only lower limits of the typical modulation indices of the scintillating sources.
6 Discussion
6.1 Properties of IDV sources
The properties of IDV observed in any Survey may depend on the choice of the parent sample. Although the flat-spectrum flux density-limited sample of sources used in our Survey was selected on the basis their radio compactness, without distinction based on the type of the object, the majority of the selected sources are blazars (ie. flat spectrum radio quasars (FSRQ) and radio selected BL Lac objects), which tend to be both, compact and luminous (Urry & Padovani 1995). In order to show IDV the sources have to be compact regardless which interpretation of IDV is preferred. The size of the source is dictated by causality arguments in case of intrinsic variability. Similarly the ISS effects are strongest for the very compact sources.
The IDV sources found in the ATCA Survey consist of 6 BL Lacs and 16 quasars. This is almost 50% of the BL Lacs from the original sample, as compared with only of quasars. Notably the Survey sample contains 7 radio sources identified as galaxies, none of which showed intraday variability.
Modulation indices derived for the IDV sources are typically less than 10%. We found that only a small fraction of the sources (2.5%) show occasional stronger variations. Variability appears to be quasiperiodic, which is evident from well sampled lightcurves, such as for PKS 0405385 (Kedziora-Chudczer et al. 1997). The largest modulation indices are typically found at 4.8 and 2.4 GHz.
The present Survey was designed to explore timescales between 2 hours and days. Characteristic timescales were found to depend on the observed frequency. For best sampled lightcures of a few IDV sources in our sample it is evident that the timescale of variability decreases with frequency.
In present survey we find that most of the IDV sources are at relatively low redshifts. If we interpret IDV as a propagation effect, it should be more frequent for the more distant sources of the same size. For instance, ISS depends on the distance of the source only through its angular size. However the compact, scintillating components of a distant source have to be sufficiently bright in order to measure any flux density changes. The very compact components of the nearby sources can satisfy such a signal-to-noise requirement more easily.
The following properties of IDV sources were identified at different wavelengths. A substantial number (40%) of our IDV sources are known to be optically variable objects, which show high and variable optical polarization. Four of them (PKS 0422004, PKS 0808019, PKS 1144379 and PKS 2155304) are BL Lacs, the others (PKS 0440003, PKS 0528250, PKS 0607157, PKS 0646306 and PKS 1622297) are quasars. Most of the IDVs in our sample are only weak sources of X-ray and -ray emission, which is a selection bias rather than a real effect. One of the more unusual sources in this respect is PKS 1622297, which showed a strong -ray outburst when its energy increased times within a few days (Mattox et al. 1997).
PKS 2155304 is an IDV source, which shows unusually strong X-ray emission. It is known to show rapid X-ray, optical and UV variability (Allen et al. 1993). This is the only source which was included in our Survey only for its interesting properties (it violates the flux density limit in our selection criteria). Our IDV observations of PKS 2155304 were used as a part of its multiwavelength monitoring campaign (Pesce et al. 1997). An important result of this monitoring is the lack of correlation between radio and higher energy flux density changes for this source.
However the presence of correlation between optical and radio variability is claimed for another IDV source, S5 0716+714 (Quirrenbach et al. 1991). To resolve the question of correlated or otherwise variability of IDV sources at high and low energies, intensive multiwavelength monitoring of known IDV sources was undertaken recently.
6.2 Intrinsic versus extrinsic IDV
The suggested interpretations of IDV fall into two categories: processes intrinsic and extrinsic to the sources. The first possibility is difficult to accept for the extremely strong and rapid variability in sources such as PKS 0405385, which imply the brightness temperature as high as K (Kedziora-Chudczer et al. 1997).
The variability brightness temperature, , can be reduced by postulating relativistic beaming . In the most extreme cases one has to invoke , which is difficult to justify on the theoretical (Begelman et al. 1994) and statistical grounds. The alternative idea of the intrinsic brightness temperature actually exceeding the Compton scattering limit for the duration of an IDV event is yet to be fully explored.
Interpretation of IDV in terms of propagation-based flux density changes can often avoid a problem of the high brightness temperature, as it puts less stringent limits on the size of the source. Two most often considered propagation effects are microlensing (Quirrenbach et al. 1991) and interstellar scintillations (Rickett 1990).
The typical timescales ( day) observed for IDV sources are consistent with microlensing in the presence of superluminal transverse velocities between the lens and the source, which could arise due to superluminal motion in the source (Gopal-Krishna and Subramanian 1991). However, to explain the observed hourly IDV over a few months due to microlensing events, one would also expect an optical depth for lensing high enough to cause gravitational multiple imaging of IDV sources with a few arcsecond separation, which has not been observed in any of these sources.
Models based on interstellar scintillation generally require less extreme brightness temperatures in IDV source because the source size is determined from the Fresnel scale requirements rather than from the variability timescale. IDV in terms of ISS was discussed extensively by Rickett et al. (1995). Their model agreed well with the observed features of the data for the BL Lac S5 0917+624 under the assumption that the source diameter decreases with increasing frequency. The main complication of the ISS model was an interpretation of the polarized flux density variability, which required the two component source model with nearly orthogonal polarization angles of both components (Rickett et al. 1995).
Taking account of the complex source structure and the little known structure of the scattering medium it is not surprising that it is difficult to make a very detailed models of ISS induced IDV. Improved VLBI imaging may reveal more about the very inner structure of the radio sources, and the galactic multiwavelength surveys will provide more detailed information about the ISM. The additional complexity is introduced by the presence of both extrinsic and intrinsic IDV occurring at the same time.
We have applied ISS model to the variability of our most extreme IDV sources: PKS 0405385 (Kedziora-Chudczer et al. 1997) and PKS 1519-273 (Macquart et al. 2000). The spectrum of modulation indices and the timescales of variability are consistent with the model. However ISS interpretation fails to bring the down below the K for these sources. Coherent emission processes are often thought of as an alternative interpretation of IDV because they can produce almost arbitrary high brightness temperature (Benford 1992, Lesch & Pohl 1992). Yet the large number density of Langmuir photons required in any such process in the small volumes inferred for the IDV sources induces higher order scattering effects, which reduce the efficiency of escaping radiation (Melrose 1998).
Nevertheless one should remain open to the possibility of non-synchrotron emission in inner regions of AGN, in view of the problems not only with explanation of inferred brightness temperatures, K for the IDV sources but also in view of the growing number sources with K of directly observed with the VLBI and VSOP (Linfield et al. 1989).
7 Conclusion
The ATCA IDV Survey provided a new sample of IDV sources. We examined the variability dependence on the morphology, spectral features and position of these sources with respect to the Galactic plane.
The IDV sources found in the ATCA Survey seem to be marginally less common than suggested in previous studies (see e.g. Quirrenbach et al. 1992, who claim that about 25% sources from their sample shows variations larger than 2%.) We find that IDV is also present in the polarized flux density.
IDV appears to be transient in a large fraction of sources. However we find also continuously variable sources with the best examples being PKS 1519–273, PKS 1034–293 and PKS 1144–379 (Kedziora-Chudczer et al. 1998).
The long term behaviour of IDV sources was studied by comparing the flux densities measured in two different observing sessions separated by 3 months. It appears that IDV sources do vary strongly on the timescale of months. This property can be potentially used in search for the IDV sources.
The IDV variability observed in the ATCA Survey is not correlated with the strength of radio emission and only weakly correlated with spectral characteristics. The distribution of the IDV sources with respect to the Galactic plane is not random but understandably does not follow the simple predictions of ISS theory.
The ATCA IDV Survey was a systematic step towards an understanding of the IDV phenomenon. Although at present it is not possible to choose between competing interpretations of IDV on the purely statistical basis, the on-going study of individual IDV sources discovered in the Survey will help to achieve this purpose.
8 References
-
Allen, W.H., Bond, I.A., Budding, E., Conway, M.J., Daniel, A., Fenton, K.B., Fujii, H., Fujii, Z., Hayashida, N., et al.1993, PhRvD, vol.48, 466
-
Aller, H.D., Aller, M.F., Latimer, G.E., Hodge, P.E. 1985, ApJ Suppl. vol.59, p.513
-
Begelman, M.C., Rees, M.J. & Sikora, M. 1994, ApJL, 429, L57
-
Benford, G. 1992, ApJ, vol. 391, L59–L62
-
Duncan, R.A., White, G.L., Wark, R., Reynolds, J.E., Jauncey, D.L., Norris, R.P. & Taaffe L., 1993, Proceedings ASA vol.10. p.310
-
Gopal-Krishna, Subramanian, K., 1991 Nature, vol.349, p.766
-
Heeschen, D.S., 1984, AJ, vol.89, p.1111-1123
-
Heeschen, D.S., Krichbaum, T., Schalinski, C.J. & Witzel, A. 1987, AJ, vol.94, p.1493-1507
-
Impey, C.D. & Tapia, S., 1990, ApJ, vol.354, p.124–139
-
Jauncey, D., Batty, M., Gulkis, S. & Savage, A., 1982, AJ, vol.87, 763
-
Jennison, R. C., 1958, MNRAS, 118, 276-284
-
Kedziora-Chudczer, L.L., Jauncey, D.L., Wieringa, M.H., Reynolds, J.E. & Tzioumis, A.K., 1998, Conf. Proc. IAU 164, p.271
-
Kedziora-Chudczer, L.L., Jauncey, D.L., Wieringa, M.H., Walker, M.A., Nicolson, G.D., Reynolds, J.E. & Tzioumis, A.K., 1997 ApJL, 490, L9
-
Kedziora-Chudczer 1998 Phd Thesis
-
Kellermann, K.I. & Pauliny-Toth I.I.K., 1969 ApJL vol. 155, L71-L78
-
Kellermann, K.I. & Owen F.N. 1988, in ’Galactic and Extragalactic Radio Astronomy’ ed. G.L. Verschuur & K.I. Kellermann, p.581
-
Kochanev, P.Y. & Gabuzda, D.C., 1998, Proc. IAU Coll. 164, vol.144, p.273–274
-
Lesch, H. & Pohl, M., 1992, A&A, vol. 254, p. 29–38
-
Linfield, R. P., Levy, G. S., Ulvestad, J. S., Edwards, C. D., Dinardo, S. J., et al., 1989 ApJ, vol.336, p.1105
-
Mattox, J.R., Wagner, S.J., Malkan, M., McGlynn, T.A., Schachter, J.F., Grove, J.E., Johnson, W.N. & Kurfess, J.D., 1997b, ApJ, vol.476, p.692-703
-
Melrose, D.B., 1998, Ap&SS. vol.264, 391
-
Narayan, R. 1992, Phil. Trans. R. Soc. Lond. vol.341, p.151-165
-
Qian, S.J., Quirrenbach, A., Witzel, A., Krichbaum, T., Hummel, C.A., Zensus J.A., 1991 A&A, vol.241, p.15
-
Quirrenbach, A., Witzel, A., Qian, S.J., Krichbaum, T.P., Hummel, C.A., & Alberdi, A. 1989 A&A vol.226, L1–L4
-
Quirrenbach, A., Witzel, A., Wagner, S. Sanchez-Pons, F., Krichbaum, T.P., et al. 1991 ApJL vol.372, L71–L74
-
Quirrenbach, A., Witzel, A., Krichbaum, T.P., Hummel, C.A., Wegner, R., Schalinski, C.J., Ott, M., Alberdi, A. & Rioja, M. 1992, A&A, vol.258, p.279–284
-
Pesce, J.E., Urry, C.M., Maraschi, L., Treves, A., Grandi, P., Kollgaard, R.I., Pian, E., Smith, P.S., et al., 1997, ApJ, vol.486, p.770-783
-
Rickett, B.J. 1990, ARAA, 28, 561
-
Rickett, B.J., Quirrenbach, A., Wegner, R., Krichbaum, T.P. & Witzel, A. 1995, A&A vol.293, p.479-492
-
Sault, R., 1994, personal communication
-
Simonetti, J.H., Cordes, J.M. & Heeschen D.S. 1985, ApJ, vol.296, p.46-59
-
Sinclair, M. W., Gough, R. G. 1991, International Proceedings of IREECON ’91, p 381-384
-
Taylor, J.H. & Cordes, J.M. 1993, ApJ, 430, 467
-
Urry, C.M. & Padovani, P., 1995, PASP, vol.107, p.803-845
-
van der Laan, H., 1966, Nature 211, 1131
-
Wagner, S.J., Witzel, A., Krichbaum, T.P., Wegner, R., Quirrenbach, A., Anton, K., Erkens, U., Khanna, R. & Zensus J.A., 1993, A&A, vol.271, p.344-347
-
Wagner S.J. & Witzel, A. 1995, ARA&A vol.33, p.163-197
-
Wagner, S.J., Witzel, A., Heidt, J., Krichbaum, T.P., Qian, S.J., Quirrenbach, A., Wegner, R., Aller, H., Aller, M., Anton, K., Appenzeller, I., Eckart, A., Kraus, A., Naundorf, C., Kneer, R., Stefeen, W. & Zensus J.A. 1996, AJ vol.111, p.2187-2211
-
Walker, M.A. 1998, MNRAS vol.294, p.307-312
-
Wegner R.G. 1994, PhD thesis, University of Bonn, Germany
-
Witzel, A., Heeschen, D.S., Schalinski, C.J. & Krichbaum T.P., 1986, Mitt. Astron. Ges. vol.65, p.239-241
| Parkes | Galactic coord. | |||||||
|---|---|---|---|---|---|---|---|---|
| Source | id | z | Source | |||||
| name | (deg) | (deg) | structure | |||||
| 0003066 | 93.21 | 66.51 | G | 0.347 | P | P | C | E |
| 0013005 | 103.70 | 61.75 | Q | 1.575 | C | P | C | C |
| 0023263 | 42.26 | 84.10 | G | 0.322 | Cd | Cd | P | E |
| 0044846 | 303.14 | 32.80 | Q | P | C | E | E | |
| 0048427 | 303.70 | 74.70 | Q | 1.749 | P | P | C | E |
| 0056572 | 301.09 | 60.17 | Q | C | C | C | Ec | |
| 0104408 | 290.98 | 76.25 | Q | 0.584 | P | P | C | E |
| 0122003 | 140.66 | 61.75 | Q* | 1.070 | Pc | C | E | E |
| 0131522 | 288.25 | 63.98 | Q | C | C | C | Ec | |
| 0138097 | 158.45 | 68.86 | BL Lac* | 0.440 | E | E | E | E |
| 0142278 | 218.02 | 78.26 | Q | 1.153 | C | C | C | E |
| 0146+056 | 147.79 | 54.24 | Q | 2.345 | P | P | C | Ec |
| 0150334 | 241.26 | 75.56 | Q | 0.610 | C | P | C | Cc |
| 0202172 | 185.61 | 70.31 | Q | 1.740 | P | P | C | Cc |
| 0208512 | 276.27 | 61.91 | HPQ | 1.003 | C | C | C | C |
| 0214522 | 276.14 | 60.55 | EF | E | E | C | Cc | |
| 0215+015 | 162.07 | 54.46 | BL Lac* | 1.715 | P | P | Cc | E |
| 0220349 | 239.75 | 69.20 | Q | P | P | Ec | Ec | |
| 0252549 | 272.49 | 54.61 | Q | 0.537 | C | C | Cc | E |
| 0302623 | 280.23 | 48.81 | Q | C | C | Cc | Cc | |
| 0308611 | 278.14 | 49.06 | Q | Cj | C | C | C | |
| 0334546 | 266.87 | 49.62 | Q | C | C | C | Ec | |
| 0336019 | 187.76 | 42.63 | HPQ* | 0.852 | P | Cc | C | Ec |
| 0346279 | 224.38 | 51.02 | Q | 0.988 | C | C | Cc | E |
| 0355483 | 256.14 | 48.60 | Q | 1.005 | C | C | C | E |
| 0405385 | 241.18 | 47.93 | Q | 1.285 | P | P | C | C |
| 0420014 | 195.12 | 33.26 | HPQ* | 0.915 | P | P | C | Ec |
| 0422+004 | 193.64 | 31.87 | BL Lac* | 0.310 | C | C | Ec | E |
| 0426380 | 240.63 | 43.79 | BL Lac | 1.030 | C | Cc | Ec | Ec |
| 0434188 | 216.21 | 37.97 | Q | 2.702 | C | C | E | E |
| 0437454 | 250.76 | 41.85 | Q | C | C | E | E | |
| 0440003 | 197.10 | 28.43 | Q | 0.850 | C | C | C | E |
| 0450469 | 252.68 | 39.57 | Q | C | C | C | E | |
| 0454463 | 251.91 | 38.88 | Q | 0.850 | E | E | E | E |
| 0454810 | 293.75 | 31.42 | Q | 0.444 | P | P | P | C |
| 0457+024 | 197.00 | 23.40 | Q | 2.384 | P | P | P | C |
| 0502+049 | 195.40 | 21.03 | Q | C | C | Ec | E | |
| 0522611 | 270.14 | 34.19 | Q | 1.400 | C | C | C | Ec |
| 0528250 | 228.19 | 28.23 | Q* | 2.779 | C | P | C | E |
| 0537286 | 232.77 | 27.46 | Q | 3.104 | C | C | E | E |
| 0537441 | 250.06 | 31.15 | BL Lac* | 0.894 | P | Pc | Cc | Cc |
| 0607157 | 222.57 | 16.28 | Q | 0.324 | P | P | Ec | C |
| 0642349 | 244.20 | 16.59 | Q | 2.165 | C | C | C | Ec |
| 0646306 | 240.43 | 14.14 | Q | 0.455 | P | P | C | C |
| 0648165 | 227.63 | 7.72 | EF‡ | P | P | E | E | |
| 0727115 | 227.58 | 2.97 | EF‡ | P | C | C | C | |
| 0728320 | 245.70 | 6.68 | Q | C | P | E | E | |
| 0733174 | 233.45 | 1.38 | EF‡ | C | P | P | C | |
| 0736+017 | 216.94 | 11.21 | HPQ* | 0.191 | P | P | C | P |
| 0808+019 | 220.63 | 18.37 | BL Lac* | Ed§ | P | C | E | |
| 0829+046 | 220.73 | 24.26 | BL Lac* | 0.180 | P | P | Cc | Ec |
| 0834201 | 243.51 | 12.16 | Q | 2.752 | P | C | C | E |
| 0837+035 | 222.85 | 25.49 | BL Lac | C | C | C | E | |
| 1021006 | 245.05 | 44.76 | Q* | 2.547 | C | C | Cc | Ec |
| 1034293 | 270.76 | 24.74 | BL Lac | 0.312 | P | C | E | E |
| 1036154 | 261.94 | 36.41 | Q | C | C | E | E | |
| 1048313 | 274.74 | 24.60 | EF | C | P | C | C | |
| 1057797 | 297.93 | 18.22 | Q | P | P | Cc | C | |
| 1105680 | 293.47 | 7.34 | Q | 0.588 | P | C | C | E |
| 1115122 | 270.00 | 44.31 | Q/IrS | C | C | C | E | |
| 1127145 | 275.07 | 43.62 | Q | 1.187 | Ed | Pc§ | Cc | Cc |
| 1143245 | 284.44 | 35.72 | Q | 1.950 | E | C | C | E |
| 1144379 | 289.13 | 22.95 | BL Lac* | 1.048 | P | Pc | C | E |
| 1148001 | 272.44 | 58.84 | Q* | 1.976 | P | P | C | Ec |
| 1148671 | 297.10 | 5.20 | Q | P | C | E | C | |
| 1243072 | 300.38 | 55.37 | Q | 1.286 | P | C | C | C |
| 1253055 | 304.83 | 57.09 | HPQ* | 0.538 | C | P | E | E |
| 1255316 | 304.49 | 30.98 | Q | 1.924 | P | C | C | E |
| 1256220 | 305.14 | 40.57 | Q | 1.306 | C | C§ | C | E |
| 1334127 | 319.67 | 48.44 | BL Lac* | 0.539 | P | C | C | C |
| 1351018 | 332.55 | 57.21 | Q | 3.707 | C | C | C | E |
| 1354152 | 325.28 | 44.58 | Q | 1.890 | C | C | C | Ec |
| 1402012 | 337.50 | 56.44 | Q* | 2.518 | C | C | C | E |
| 1406076 | 333.81 | 50.35 | Q | 1.494 | P | C | E | E |
| 1435218 | 333.19 | 34.53 | Q | 1.194 | C | C | Cc | E |
| 1443162 | 338.77 | 38.38 | Q | C | C | E | E | |
| 1502+036 | 2.03 | 50.34 | Q | 0.411 | C | P | C | E |
| 1504166 | 343.64 | 35.17 | HPQ* | 0.876 | P | P | C | E |
| 1519273 | 339.48 | 24.51 | BL Lac | P | C | C | C | |
| 1535+004 | 5.94 | 41.92 | EF | P | C | C | E | |
| 1540828 | 308.27 | 22.02 | EF | C | P | C | C | |
| 1549790 | 311.22 | 19.39 | G | 0.15 | P | Cc | P | E |
| 1555140 | 356.43 | 28.79 | GPair | 0.097 | C | C | C | E |
| 1556245 | 348.33 | 21.27 | Q | 2.813 | C | C | E | E |
| 1610771 | 313.45 | 18.77 | Q* | 1.710 | P | P | Cc | Ec |
| 1619680 | 320.76 | 12.96 | Q | 1.360 | P | C | C | Ec |
| 1622297 | 348.71 | 13.50 | Q | 0.815 | P§ | P | Cc | C |
| 1718649 | 326.98 | 15.73 | G | 0.014 | P | P | Pc | C |
| 1741038 | 21.56 | 13.21 | HPQ | 1.054 | P | C | P | C |
| 1758651 | 328.84 | 19.57 | G | P | P | C | C | |
| 1815553 | 339.22 | 17.68 | Q | P | P | C | E | |
| 1921293 | 9.32 | 19.45 | HPQ* | 0.352 | P | P | Pc | Pc |
| 1925610 | 335.85 | 28.02 | Q | P | C | C | E | |
| 1937101 | 29.35 | 15.21 | Q | 3.780 | C | P | C | E |
| 1958179 | 24.06 | 23.08 | Q | 0.650 | P | C | C | C |
| 2016615 | 335.38 | 34.15 | Q | C | C | C | E | |
| 2052474 | 352.65 | 40.24 | Q | 1.489 | Cc | Cc | Ec | Ec |
| 2058297 | 15.86 | 39.76 | Q | 0.698 | C | P | C | E |
| 2106413 | 0.78 | 42.77 | Q | 1.055 | P | C | C | C |
| 2109811 | 311.62 | 32.24 | EF | C | P | C | E | |
| 2121+053 | 57.89 | 30.12 | Q | 1.878 | P | P | C | C |
| 2126158 | 35.95 | 41.74 | Q | 3.268 | P | P | C | E |
| 2128123 | 40.46 | 40.75 | Sy1* | 0.501 | P | C | C | C |
| 2134+004 | 55.38 | 35.60 | Q* | 1.932 | P | P | P | E |
| 2142758 | 315.85 | 36.54 | Q | 1.139 | C | C | C | E |
| 2146783 | 313.24 | 35.19 | Q | C | C | E | E | |
| 2149307 | 17.08 | 50.78 | Q | 2.345 | C | C | C | C |
| 2155304 | 17.80 | 52.03 | BL Lac* | 0.116 | C | P | C | E |
| 2243123 | 53.83 | 56.89 | Q* | 0.630 | P | C | C | C |
| 2245328 | 13.96 | 62.74 | Q | 2.268 | C | C | E | E |
| 2312319 | 15.05 | 68.50 | Q | 0.284 | C | C | C | E |
| 2320035 | 77.46 | 58.02 | Q | 1.411 | P | C | C | C |
| 2326477 | 336.01 | 64.04 | Q | 1.299 | C | C | C | Cc |
| 2329384 | 354.58 | 70.00 | Q | 1.195 | C | C | C | E |
| 2332017 | 84.07 | 58.37 | Q* | 1.185 | C | P | E | E |
| 2333528 | 326.90 | 60.94 | Q | P | C | Cc | E | |
| 2345167 | 65.56 | 71.74 | HPQ* | 0.576 | C | P | C | C |
| 2355534 | 320.33 | 62.15 | Q* | 1.006 | P | P | E | C |
| frequency | theoretical rms | measured rms | |
|---|---|---|---|
| (GHz) | (%) | in 1 min observation (mJy) | |
| 8.6 | 0.35 | 0.67 | 2.4 |
| 4.8 | 0.24 | 0.72 | 1.8 |
| 2.4 | 0.50 | 0.76 | 3.9 |
| 1.4 | 0.41 | 0.60 | 3.8 |
| 8.6 GHz | 4.8 GHz | 2.4 GHz | 1.4 GHz | ||||||||||||||||||||||
|---|---|---|---|---|---|---|---|---|---|---|---|---|---|---|---|---|---|---|---|---|---|---|---|---|---|
| May 94 | August 94 | May 94 | August 94 | May 94 | August 94 | May 94 | August 94 | ||||||||||||||||||
| Source | N | N | N | N | N | N | N | N | |||||||||||||||||
| name | Jy | Jy | Jy | Jy | Jy | Jy | Jy | Jy | |||||||||||||||||
| 0003066 | 16 | 3.06 | 0.006 | 7 | 2.85 | 0.003 | 16 | 3.17 | 0.005 | 7 | 3.08 | 0.004 | |||||||||||||
| 0013005 | 9 | 0.83 | 0.009 | 7 | 0.84 | 0.004 | 9 | 1.01 | 0.006 | 7 | 1.08 | 0.003 | 13 | 1.11 | 0.008 | 7 | 1.16 | 0.013 | 13 | 1.06 | 0.009 | 7 | 1.09 | 0.007 | |
| 0044846 | 15 | 0.50 | 0.008 | 15 | 0.013 | 0.035 | |||||||||||||||||||
| 0048427 | 16 | 1.06 | 0.007 | 8 | 1.07 | 0.004 | 17 | 0.92 | 0.006 | 8 | 0.99 | 0.005 | |||||||||||||
| 0056572 | 13 | 0.52 | 0.006 | 12 | 0.50 | 0.008 | 13 | 0.58 | 0.008 | 12 | 0.57 | 0.007 | |||||||||||||
| 0104408 | 17 | 2.60 | 0.011 | 9 | 3.03 | 0.003 | 17 | 1.55 | 0.013 | 9 | 1.80 | 0.004 | 13 | 0.91 | 0.044 | 9 | 0.93 | 0.007 | |||||||
| 0131522 | 13 | 0.47 | 0.008 | 13 | 0.010 | 0.038 | 17 | 0.38 | 0.010 | ||||||||||||||||
| 0142278 | 9 | 0.72 | 0.010 | 10 | 0.62 | 0.005 | 9 | 0.76 | 0.011 | 10 | 0.74 | 0.007 | 9 | 0.71 | 0.010 | 10 | 0.73 | 0.010 | |||||||
| 0146+056 | 9 | 1.25 | 0.004 | 7 | 1.27 | 0.005 | 9 | 1.32 | 0.006 | 7 | 1.36 | 0.003 | 7 | 1.07 | 0.013 | 7 | 1.10 | 0.011 | 7 | 0.81 | 0.020 | 7 | 0.84 | 0.012 | |
| 0150334 | 17 | 0.89 | 0.006 | 10 | 0.82 | 0.004 | 17 | 1.05 | 0.007 | 10 | 1.01 | 0.003 | 12 | 1.11 | 0.017 | 9 | 1.10 | 0.008 | 12 | 1.12 | 0.017 | 9 | 1.13 | 0.012 | |
| 0202172 | 9 | 1.45 | 0.017 | 10 | 1.42 | 0.008 | 9 | 1.42 | 0.007 | 10 | 1.47 | 0.009 | 11 | 1.23 | 0.024 | 10 | 1.26 | 0.008 | 11 | 1.18 | 0.017 | 10 | 1.19 | 0.018 | |
| 0214522 | 21 | 0.34 | 0.008 | 10 | 0.33 | 0.004 | 21 | 0.51 | 0.004 | 10 | 0.51 | 0.005 | 14 | 0.71 | 0.009 | 11 | 0.72 | 0.010 | 14 | 0.86 | 0.008 | 11 | 0.87 | 0.013 | |
| 0215+015 | 10 | 0.71 | 0.007 | 9 | 0.84 | 0.010 | 10 | 0.56 | 0.014 | 9 | 0.68 | 0.008 | 7 | 0.55 | 0.021 | 9 | 0.56 | 0.018 | |||||||
| 0220349 | 13 | 0.80 | 0.010 | 14 | 0.81 | 0.005 | 13 | 0.83 | 0.007 | 14 | 0.85 | 0.005 | 16 | 0.74 | 0.020 | 10 | 0.73 | 0.005 | 16 | 0.69 | 0.019 | 10 | 0.65 | 0.017 | |
| 0252549 | 17 | 0.94 | 0.008 | ||||||||||||||||||||||
| 0302623 | 12 | 1.89 | 0.003 | 12 | 1.86 | 0.006 | 12 | 2.09 | 0.007 | 12 | 2.08 | 0.004 | 18 | 2.13 | 0.009 | 13 | 2.10 | 0.008 | 18 | 2.16 | 0.009 | 13 | 1.93 | 0.005 | |
| 0308611 | 14 | 1.67 | 0.008 | 15 | 1.72 | 0.017 | 14 | 1.36 | 0.014 | 15 | 1.46 | 0.011 | 11 | 0.90 | 0.024 | 12 | 0.94 | 0.016 | |||||||
| 0334546 | 12 | 0.39 | 0.004 | 11 | 0.37 | 0.004 | 12 | 0.52 | 0.005 | 11 | 0.50 | 0.005 | 14 | 0.49 | 0.007 | 16 | 0.48 | 0.005 | 14 | 0.38 | 0.016 | 16 | 0.37 | 0.035 | |
| 0336019 | 7 | 2.50 | 0.012 | 8 | 2.34 | 0.009 | |||||||||||||||||||
| 0346279 | 9 | 1.25 | 0.009 | 11 | 1.08 | 0.007 | 9 | 1.22 | 0.030 | 11 | 1.01 | 0.015 | 7 | 1.05 | 0.016 | 11 | 0.90 | 0.022 | 7 | 0.96 | 0.027 | 10 | 0.81 | 0.030 | |
| 0355483 | 13 | 0.35 | 0.005 | 34 | 0.35 | 0.038 | 13 | 0.46 | 0.009 | 34 | 0.46 | 0.005 | 11 | 0.40 | 0.017 | 35 | 0.41 | 0.009 | |||||||
| 0405385 | 11 | 1.45 | 0.043 | 76 | 1.33 | 0.003 | 11 | 1.38 | 0.056 | 76 | 1.27 | 0.007 | 14 | 1.13 | 0.056 | 77 | 1.08 | 0.011 | 14 | 0.92 | 0.052 | 77 | 0.90 | 0.009 | |
| 0420014 | 6 | 2.27 | 0.012 | 11 | 2.10 | 0.011 | 6 | 2.45 | 0.006 | 11 | 2.28 | 0.005 | 6 | 2.37 | 0.007 | 15 | 2.50 | 0.008 | 6 | 2.02 | 0.013 | 14 | 2.69 | 0.011 | |
| 0422+004 | 10 | 0.51 | 0.018 | 10 | 0.024 | 0.068 | |||||||||||||||||||
| 0426380 | 15 | 1.44 | 0.008 | 22 | 1.62 | 0.004 | |||||||||||||||||||
| 0434188 | 8 | 0.98 | 0.010 | 13 | 0.97 | 0.007 | 8 | 1.07 | 0.013 | 13 | 1.06 | 0.007 | |||||||||||||
| 0437454 | 11 | 0.32 | 0.025 | 35 | 0.34 | 0.009 | 10 | 0.33 | 0.016 | 35 | 0.33 | 0.014 | |||||||||||||
| 0440003 | 11 | 0.029 | 0.059 | 11 | 1.68 | 0.011 | 11 | 0.018 | 0.043 | 10 | 1.48 | 0.015 | |||||||||||||
| 0450469 | 15 | 0.34 | 0.012 | 21 | 0.42 | 0.003 | 15 | 0.41 | 0.016 | 21 | 0.48 | 0.004 | 11 | 0.46 | 0.034 | 24 | 0.49 | 0.006 | |||||||
| 0454810 | 16 | 1.87 | 0.014 | 17 | 2.03 | 0.006 | 16 | 1.72 | 0.019 | 17 | 1.79 | 0.010 | 13 | 1.28 | 0.010 | 17 | 1.16 | 0.012 | |||||||
| 0457+024 | 7 | 1.30 | 0.007 | 12 | 1.31 | 0.011 | 7 | 1.75 | 0.007 | 12 | 1.80 | 0.009 | 7 | 2.00 | 0.013 | 10 | 2.05 | 0.025 | 7 | 1.94 | 0.014 | 9 | 1.97 | 0.029 | |
| 0502+049 | 6 | 0.64 | 0.005 | 9 | 0.72 | 0.027 | 6 | 0.81 | 0.018 | 9 | 0.77 | 0.011 | 10 | 0.91 | 0.024 | 8 | 0.85 | 0.021 | |||||||
| 0522611 | 11 | 0.65 | 0.007 | 13 | 0.61 | 0.008 | 11 | 0.66 | 0.005 | 13 | 0.65 | 0.007 | 15 | 0.67 | 0.010 | 14 | 0.69 | 0.007 | 15 | 0.73 | 0.015 | 13 | 0.75 | 0.022 | |
| 0528250 | 8 | 0.63 | 0.020 | 14 | 0.63 | 0.009 | 8 | 0.86 | 0.014 | 14 | 0.86 | 0.005 | |||||||||||||
| 0537286 | 8 | 0.45 | 0.007 | 13 | 0.39 | 0.006 | 8 | 0.67 | 0.018 | 13 | 0.56 | 0.005 | |||||||||||||
| 0537441 | 12 | 6.43 | 0.006 | 35 | 6.29 | 0.004 | |||||||||||||||||||
| 0607157 | 10 | 4.02 | 0.012 | 11 | 5.74 | 0.005 | 10 | 3.20 | 0.013 | 12 | 4.15 | 0.023 | 8 | 2.40 | 0.013 | 11 | 2.80 | 0.031 | 8 | 2.43 | 0.009 | 10 | 2.61 | 0.008 | |
| 0642349 | 16 | 0.79 | 0.008 | 11 | 0.77 | 0.009 | 16 | 0.94 | 0.007 | 11 | 0.93 | 0.011 | 11 | 0.82 | 0.019 | 12 | 0.82 | 0.010 | 11 | 0.73 | 0.026 | 12 | 0.73 | 0.020 | |
| 0646306 | 11 | 1.08 | 0.014 | 16 | 0.99 | 0.012 | 11 | 1.10 | 0.024 | 16 | 1.05 | 0.011 | 13 | 0.82 | 0.037 | 11 | 0.91 | 0.024 | 13 | 0.76 | 0.021 | 11 | 0.76 | 0.032 | |
| 0648165 | 10 | 1.52 | 0.009 | 12 | 1.64 | 0.007 | 10 | 1.47 | 0.008 | 12 | 1.52 | 0.009 | |||||||||||||
| 0727115 | 13 | 4.86 | 0.005 | 12 | 4.18 | 0.007 | 13 | 5.09 | 0.012 | 12 | 4.34 | 0.007 | 10 | 3.97 | 0.009 | 14 | 3.69 | 0.011 | 10 | 3.27 | 0.013 | 13 | 2.90 | 0.013 | |
| 0728320 | 13 | 0.23 | 0.026 | 11 | 0.22 | 0.011 | 13 | 0.31 | 0.034 | 11 | 0.33 | 0.007 | |||||||||||||
| 0733174 | 9 | 1.31 | 0.010 | 12 | 1.29 | 0.004 | 9 | 1.88 | 0.004 | 12 | 1.84 | 0.007 | 13 | 2.59 | 0.012 | 15 | 2.47 | 0.011 | 13 | 2.74 | 0.006 | 15 | 2.72 | 0.004 | |
| 0736+017 | 9 | 1.32 | 0.012 | 13 | 1.03 | 0.019 | 9 | 1.41 | 0.013 | 13 | 1.22 | 0.012 | 8 | 1.53 | 0.013 | 10 | 1.65 | 0.022 | 8 | 1.75 | 0.010 | 10 | 2.02 | 0.010 | |
| 0808+019 | 9 | 1.02 | 0.014 | 12 | 0.57 | 0.021 | 9 | 0.97 | 0.011 | 12 | 0.59 | 0.023 | 13 | 0.80 | 0.025 | 13 | 0.56 | 0.022 | |||||||
| 0829+046 | 11 | 1.18 | 0.007 | 11 | 1.23 | 0.007 | 11 | 1.12 | 0.000 | 11 | 1.10 | 0.013 | 8 | 1.00 | 0.004 | 12 | 0.98 | 0.016 | 8 | 0.97 | 0.016 | 12 | 0.93 | 0.017 | |
| 0834201 | 10 | 2.24 | 0.013 | 12 | 2.13 | 0.010 | 10 | 1.84 | 0.004 | 12 | 1.75 | 0.005 | 14 | 1.64 | 0.011 | 13 | 1.62 | 0.012 | |||||||
| 0837+035 | 9 | 0.69 | 0.014 | 11 | 0.68 | 0.007 | 9 | 0.75 | 0.004 | 11 | 0.74 | 0.012 | 8 | 0.71 | 0.016 | 10 | 0.72 | 0.011 | |||||||
| 1021006 | 9 | 0.52 | 0.009 | 7 | 0.51 | 0.003 | 9 | 0.77 | 0.008 | 7 | 0.76 | 0.005 | 12 | 1.01 | 0.007 | 8 | 1.03 | 0.008 | 12 | 0.99 | 0.015 | 6 | 1.01 | 0.017 | |
| 1034293 | 11 | 1.80 | 0.057 | 10 | 2.32 | 0.012 | 11 | 1.17 | 0.092 | 10 | 1.78 | 0.113 | |||||||||||||
| 1036154 | 9 | 0.41 | 0.013 | 11 | 0.41 | 0.007 | 9 | 0.39 | 0.006 | 11 | 0.39 | 0.007 | |||||||||||||
| 1048313 | 15 | 0.73 | 0.026 | 10 | 0.72 | 0.019 | 15 | 0.87 | 0.011 | 10 | 0.86 | 0.025 | 11 | 0.91 | 0.023 | 9 | 0.94 | 0.010 | 11 | 0.85 | 0.030 | 9 | 0.93 | 0.015 | |
| 1057797 | 11 | 2.10 | 0.007 | 15 | 2.09 | 0.009 | 14 | 1.49 | 0.002 | 19 | 1.33 | 0.014 | 14 | 1.01 | 0.010 | 17 | 1.04 | 0.015 | |||||||
| 1105680 | 12 | 1.04 | 0.008 | 15 | 1.01 | 0.007 | 12 | 1.20 | 0.003 | 16 | 1.22 | 0.004 | 11 | 0.92 | 0.010 | 14 | 1.00 | 0.009 | |||||||
| 1115122 | 11 | 0.68 | 0.019 | 9 | 0.59 | 0.003 | 11 | 0.65 | 0.018 | 9 | 0.58 | 0.012 | 9 | 0.62 | 0.009 | 9 | 0.61 | 0.013 | |||||||
| 1127145 | 9 | 2.84 | 0.005 | 9 | 2.82 | 0.005 | 9 | 3.57 | 0.003 | 9 | 3.58 | 0.003 | 13 | 4.39 | 0.008 | 11 | 4.50 | 0.013 | 12 | 5.06 | 0.007 | 9 | 5.19 | 0.007 | |
| 1143245 | 17 | 1.03 | 0.008 | 10 | 1.03 | 0.006 | 17 | 1.43 | 0.003 | 10 | 1.40 | 0.004 | 10 | 1.68 | 0.010 | 11 | 1.66 | 0.013 | |||||||
| 1144379 | 12 | 2.33 | 0.075 | 9 | 2.14 | 0.017 | 12 | 2.47 | 0.146 | 9 | 2.04 | 0.031 | |||||||||||||
| 1148001 | 9 | 1.16 | 0.006 | 9 | 1.14 | 0.002 | 9 | 1.61 | 0.002 | 9 | 1.58 | 0.002 | 11 | 2.14 | 0.005 | 8 | 2.19 | 0.004 | 11 | 2.63 | 0.004 | 8 | 2.64 | 0.009 | |
| 1148671 | 13 | 1.15 | 0.005 | 15 | 1.11 | 0.009 | 13 | 1.69 | 0.006 | 15 | 1.66 | 0.002 | 12 | 1.29 | 0.017 | 12 | 1.10 | 0.013 | |||||||
| 1243072 | 14 | 1.08 | 0.007 | 6 | 1.06 | 0.006 | 14 | 0.87 | 0.007 | 6 | 0.86 | 0.001 | 11 | 0.63 | 0.004 | 7 | 0.66 | 0.003 | 11 | 0.54 | 0.012 | 7 | 0.55 | 0.018 | |
| 1255316 | 15 | 1.47 | 0.009 | 8 | 1.47 | 0.013 | 15 | 1.55 | 0.016 | 8 | 1.56 | 0.009 | 18 | 1.12 | 0.020 | 11 | 0.98 | 0.017 | |||||||
| 1256220 | 16 | 0.60 | 0.012 | 7 | 0.74 | 0.027 | 16 | 0.52 | 0.014 | 7 | 0.56 | 0.022 | 11 | 0.56 | 0.009 | 7 | 0.57 | 0.007 | 11 | 0.64 | 0.040 | 7 | 0.66 | 0.017 | |
| 1334127 | 10 | 5.27 | 0.008 | 7 | 4.88 | 0.019 | |||||||||||||||||||
| 1351018 | 14 | 0.85 | 0.007 | 6 | 0.84 | 0.009 | 14 | 0.98 | 0.003 | 6 | 0.96 | 0.014 | 11 | 0.82 | 0.018 | 6 | 0.83 | 0.014 | |||||||
| 1354152 | 11 | 0.88 | 0.007 | 7 | 0.84 | 0.009 | 11 | 0.96 | 0.004 | 7 | 0.87 | 0.010 | 14 | 0.76 | 0.013 | 7 | 0.75 | 0.008 | |||||||
| 1402012 | 14 | 0.23 | 0.013 | 7 | 0.23 | 0.009 | 14 | 0.34 | 0.007 | 7 | 0.33 | 0.005 | 11 | 0.43 | 0.017 | 7 | 0.43 | 0.018 | 11 | 0.50 | 0.027 | 7 | 0.48 | 0.014 | |
| 1406076 | 11 | 1.01 | 0.011 | 7 | 1.00 | 0.010 | 11 | 0.76 | 0.010 | 7 | 0.80 | 0.011 | |||||||||||||
| 1435218 | 14 | 0.57 | 0.008 | 8 | 0.56 | 0.010 | 14 | 0.63 | 0.004 | 8 | 0.58 | 0.007 | |||||||||||||
| 1443162 | 12 | 0.44 | 0.012 | 7 | 0.39 | 0.019 | 12 | 0.43 | 0.015 | 7 | 0.40 | 0.008 | |||||||||||||
| 1502+036 | 13 | 0.60 | 0.020 | 6 | 0.71 | 0.002 | 13 | 0.57 | 0.014 | 6 | 0.66 | 0.008 | |||||||||||||
| 1504166 | 12 | 2.54 | 0.016 | 7 | 2.49 | 0.004 | 12 | 2.71 | 0.019 | 7 | 2.64 | 0.008 | |||||||||||||
| 1519273 | 15 | 1.41 | 0.029 | 7 | 1.77 | 0.018 | 15 | 1.44 | 0.037 | 7 | 1.72 | 0.023 | 10 | 1.09 | 0.040 | 8 | 1.28 | 0.009 | 10 | 0.98 | 0.035 | 8 | 0.91 | 0.009 | |
| 1535+004 | 10 | 0.43 | 0.007 | 7 | 0.42 | 0.003 | 10 | 0.56 | 0.004 | 7 | 0.55 | 0.006 | 15 | 0.64 | 0.009 | 7 | 0.63 | 0.009 | 15 | 0.68 | 0.014 | 7 | 0.65 | 0.018 | |
| 1540828 | 15 | 0.58 | 0.007 | 15 | 0.58 | 0.004 | 15 | 0.67 | 0.008 | 15 | 0.68 | 0.005 | 16 | 0.74 | 0.005 | 15 | 0.74 | 0.008 | 16 | 0.89 | 0.013 | 15 | 0.85 | 0.026 | |
| 1549790 | 22 | 3.01 | 0.003 | 14 | 0.002 | 0.068 | 14 | 5.47 | 0.009 | ||||||||||||||||
| 1555140 | 9 | 0.41 | 0.015 | 8 | 0.41 | 0.004 | 9 | 0.59 | 0.007 | 8 | 0.58 | 0.004 | 9 | 0.65 | 0.006 | 7 | 0.66 | 0.009 | |||||||
| 1556245 | 9 | 0.27 | 0.015 | 8 | 0.28 | 0.042 | 9 | 0.38 | 0.028 | 8 | 0.39 | 0.033 | |||||||||||||
| 1610771 | 16 | 3.17 | 0.005 | 13 | 3.27 | 0.004 | 16 | 3.19 | 0.005 | 13 | 3.25 | 0.006 | |||||||||||||
| 1619680 | 24 | 1.41 | 0.004 | 9 | 1.34 | 0.003 | 23 | 1.93 | 0.002 | 9 | 1.86 | 0.003 | 16 | 2.04 | 0.006 | 9 | 1.88 | 0.007 | 16 | 1.66 | 0.012 | 9 | 1.54 | 0.009 | |
| 1622297 | 11 | 2.25 | 0.020 | 10 | 2.19 | 0.031 | 11 | 2.32 | 0.011 | 10 | 2.24 | 0.014 | 10 | 2.12 | 0.021 | 9 | 2.09 | 0.016 | |||||||
| 1718649 | 14 | 3.60 | 0.003 | 9 | 3.42 | 0.004 | 14 | 4.42 | 0.002 | 9 | 4.33 | 0.004 | 17 | 4.14 | 0.000 | 9 | 4.10 | 0.006 | 18 | 3.47 | 0.004 | 9 | 3.41 | 0.005 | |
| 1741038 | 11 | 3.23 | 0.009 | 6 | 3.81 | 0.006 | 11 | 2.53 | 0.010 | 6 | 2.74 | 0.012 | 13 | 1.89 | 0.014 | 6 | 1.94 | 0.009 | 13 | 1.56 | 0.010 | 6 | 1.47 | 0.005 | |
| 1758651 | 20 | 0.70 | 0.007 | 8 | 0.67 | 0.004 | 20 | 0.66 | 0.019 | 8 | 0.63 | 0.005 | 14 | 0.61 | 0.008 | 9 | 0.58 | 0.011 | 14 | 0.69 | 0.009 | 9 | 0.65 | 0.026 | |
| 1815553 | 14 | 1.10 | 0.006 | 8 | 0.92 | 0.003 | 14 | 1.17 | 0.004 | 8 | 1.01 | 0.003 | 17 | 0.97 | 0.008 | 6 | 1.05 | 0.008 | |||||||
| 1921293 | 12 | 23.9 | 0.008 | 11 | 20.9 | 0.006 | 12 | 19.68 | 0.006 | 11 | 18.06 | 0.004 | 9 | 12.94 | 0.010 | 10 | 13.45 | 0.008 | 9 | 11.28 | 0.011 | 8 | 11.70 | 0.011 | |
| 1925610 | 8 | 0.98 | 0.010 | 7 | 0.91 | 0.006 | 12 | 0.96 | 0.011 | 7 | 0.95 | 0.004 | 21 | 0.74 | 0.015 | 7 | 0.76 | 0.012 | 21 | 0.69 | 0.013 | 7 | 0.70 | 0.011 | |
| 1937101 | 9 | 0.59 | 0.012 | 6 | 0.60 | 0.008 | 8 | 0.73 | 0.007 | 6 | 0.76 | 0.005 | 12 | 0.86 | 0.012 | 7 | 0.86 | 0.011 | 12 | 0.87 | 0.008 | 7 | 0.80 | 0.010 | |
| 1958179 | 9 | 1.17 | 0.013 | 6 | 0.66 | 0.004 | 9 | 1.42 | 0.010 | 6 | 0.72 | 0.004 | 8 | 1.67 | 0.007 | 6 | 0.88 | 0.006 | |||||||
| 2016615 | 19 | 0.33 | 0.008 | 19 | 0.005 | 0.020 | 12 | 0.70 | 0.012 | ||||||||||||||||
| 2058297 | 8 | 0.60 | 0.009 | 8 | 0.61 | 0.005 | 8 | 0.70 | 0.007 | 8 | 0.68 | 0.004 | 9 | 0.71 | 0.005 | 8 | 0.66 | 0.004 | 9 | 0.53 | 0.005 | 8 | 0.63 | 0.016 | |
| 2106413 | 9 | 2.46 | 0.007 | 11 | 2.29 | 0.005 | 9 | 2.15 | 0.003 | 11 | 2.16 | 0.005 | 10 | 1.80 | 0.007 | 7 | 1.74 | 0.007 | 10 | 1.72 | 0.013 | 7 | 1.64 | 0.010 | |
| 2109811 | 15 | 0.60 | 0.006 | 15 | 0.61 | 0.008 | 16 | 0.54 | 0.007 | 8 | 0.46 | 0.021 | |||||||||||||
| 2121+053 | 11 | 1.03 | 0.008 | 5 | 0.97 | 0.014 | 11 | 1.25 | 0.010 | 5 | 1.14 | 0.010 | 9 | 1.34 | 0.013 | 5 | 1.16 | 0.007 | 9 | 1.33 | 0.012 | 5 | 1.07 | 0.015 | |
| 2126158 | 9 | 0.97 | 0.003 | 7 | 0.96 | 0.005 | 9 | 1.19 | 0.004 | 7 | 1.19 | 0.004 | 9 | 0.90 | 0.010 | 11 | 0.92 | 0.007 | |||||||
| 2128123 | 10 | 2.55 | 0.005 | 8 | 2.63 | 0.005 | 10 | 2.31 | 0.007 | 8 | 2.27 | 0.004 | 9 | 1.87 | 0.006 | 7 | 1.79 | 0.007 | 9 | 1.57 | 0.009 | 7 | 1.49 | 0.007 | |
| 2134+004 | 7 | 0.005 | 0.016 | 7 | 8.91 | 0.004 | 7 | 0.006 | 0.016 | 7 | 3.43 | 0.003 | |||||||||||||
| 2142758 | 13 | 0.70 | 0.008 | 12 | 0.70 | 0.007 | 13 | 0.87 | 0.009 | 12 | 0.87 | 0.005 | |||||||||||||
| 2146783 | 17 | 0.82 | 0.005 | 12 | 0.79 | 0.003 | 17 | 1.10 | 0.005 | 12 | 1.08 | 0.004 | |||||||||||||
| 2149307 | 12 | 1.50 | 0.014 | 6 | 1.32 | 0.006 | 12 | 1.71 | 0.010 | 6 | 1.62 | 0.005 | 17 | 1.39 | 0.016 | 6 | 1.41 | 0.016 | 17 | 1.16 | 0.013 | 6 | 1.18 | 0.018 | |
| 2155304 | 20 | 0.43 | 0.024 | 6 | 0.49 | 0.008 | 21 | 0.44 | 0.021 | 6 | 0.50 | 0.005 | 20 | 0.41 | 0.034 | 9 | 0.47 | 0.020 | |||||||
| 2243123 | 14 | 2.43 | 0.005 | 7 | 2.32 | 0.003 | 14 | 2.35 | 0.003 | 7 | 2.25 | 0.005 | 11 | 1.95 | 0.016 | 7 | 1.90 | 0.008 | 11 | 1.78 | 0.014 | 7 | 1.76 | 0.012 | |
| 2245328 | 11 | 0.56 | 0.008 | 11 | 0.010 | 0.034 | |||||||||||||||||||
| 2312319 | 9 | 0.44 | 0.006 | 8 | 0.42 | 0.008 | 9 | 0.58 | 0.007 | 8 | 0.56 | 0.005 | 12 | 0.74 | 0.011 | 7 | 0.74 | 0.009 | |||||||
| 2320035 | 9 | 0.76 | 0.010 | 8 | 0.76 | 0.007 | 9 | 0.80 | 0.005 | 7 | 0.83 | 0.010 | 11 | 0.81 | 0.010 | 9 | 0.83 | 0.007 | 11 | 0.85 | 0.009 | 9 | 0.84 | 0.011 | |
| 2326477 | 16 | 1.67 | 0.006 | 8 | 1.62 | 0.006 | 16 | 1.74 | 0.007 | 8 | 1.71 | 0.010 | 13 | 2.13 | 0.007 | 9 | 2.10 | 0.009 | 13 | 2.56 | 0.013 | 8 | 2.55 | 0.027 | |
| 2329384 | 10 | 0.48 | 0.006 | 10 | 0.007 | 0.021 | 18 | 0.64 | 0.007 | ||||||||||||||||
| 2332017 | 11 | 0.55 | 0.004 | 7 | 0.52 | 0.007 | 11 | 0.64 | 0.009 | 7 | 0.62 | 0.011 | |||||||||||||
| 2333528 | 16 | 1.30 | 0.008 | 9 | 1.28 | 0.005 | 16 | 1.54 | 0.004 | 9 | 1.55 | 0.002 | 12 | 1.72 | 0.010 | 8 | 1.73 | 0.008 | |||||||
| 2345167 | 11 | 2.73 | 0.009 | 7 | 3.06 | 0.002 | 11 | 3.01 | 0.007 | 7 | 3.18 | 0.005 | 13 | 2.44 | 0.007 | 7 | 2.50 | 0.013 | |||||||
| 2355534 | 14 | 1.66 | 0.009 | 8 | 1.61 | 0.006 | 14 | 1.76 | 0.005 | 8 | 1.76 | 0.004 | |||||||||||||
| 8.6 GHz | 4.8 GHz | 2.4 GHz | 1.4 GHz | |||||||||||||||||||||||||||||
|---|---|---|---|---|---|---|---|---|---|---|---|---|---|---|---|---|---|---|---|---|---|---|---|---|---|---|---|---|---|---|---|---|
| May 94 | August 94 | May 94 | August 94 | May 94 | August 94 | May 94 | August 94 | |||||||||||||||||||||||||
| Source | N | N | N | N | N | N | N | N | ||||||||||||||||||||||||
| name | mJy | deg | mJy | deg | mJy | deg | mJy | deg | mJy | deg | mJy | deg | mJy | deg | mJy | deg | ||||||||||||||||
| 0003066 | 16 | 35 | 0.171 | 34.1 | 7 | 71 | 0.042 | 24.5 | 16 | 65 | 0.081 | 47.5 | 7 | 94 | 0.055 | 41.8 | ||||||||||||||||
| 0044846 | 15 | 18 | 0.139 | 9.9 | 15 | 28 | 0.056 | 6.3 | ||||||||||||||||||||||||
| 0104408 | 17 | 66 | 0.098 | -6.0 | 9 | 82 | 0.042 | 2.3 | 17 | 90 | 0.028 | 19.4 | 9 | 69 | 0.074 | 21.3 | 13 | 27 | 0.079 | -74.7 | 9 | 35 | 0.056 | -66.5 | ||||||||
| 0122003 | 9 | 33 | 0.077 | 33.3 | 8 | 34 | 0.089 | 38.3 | ||||||||||||||||||||||||
| 0146+056 | 9 | 91 | 0.032 | -64.2 | 7 | 93 | 0.017 | -63.8 | 9 | 88 | 0.033 | -66.7 | 7 | 78 | 0.027 | -65.1 | 7 | 27 | 0.042 | -69.7 | 7 | 22 | 0.065 | -72.9 | ||||||||
| 0150334 | 17 | 24 | 0.080 | 30.8 | 10 | 19 | 0.104 | 19.3 | 17 | 19 | 0.107 | 28.3 | 10 | 16 | 0.138 | 19.6 | 12 | 25 | 0.074 | 67.2 | 9 | 23 | 0.248 | 71.5 | ||||||||
| 0202172 | 9 | 18 | 0.123 | -32.3 | 10 | 26 | 0.080 | -42.6 | 9 | 81 | 0.053 | -82.7 | 10 | 61 | 0.066 | -81.4 | 11 | 57 | 0.028 | -45.7 | 10 | 51 | 0.033 | -44.7 | 11 | 39 | 0.070 | -10.5 | 10 | 39 | 0.212 | -13.3 |
| 0215+015 | 10 | 09 | 0.346 | 34.0 | 9 | 27 | 0.575 | -35.5 | ||||||||||||||||||||||||
| 0220349 | 13 | 26 | 0.089 | -76.0 | 14 | 18 | 0.074 | -71.8 | 13 | 25 | 0.065 | -61.1 | 14 | 18 | 0.110 | -55.6 | 16 | 16 | 0.145 | -43.3 | 10 | 16 | 0.086 | -43.9 | ||||||||
| 0252549 | 17 | 39 | 0.039 | -86.1 | ||||||||||||||||||||||||||||
| 0302623 | 12 | 34 | 0.214 | -73.0 | 12 | 37 | 0.048 | -68.4 | 12 | 45 | 0.074 | -60.1 | 12 | 44 | 0.176 | -51.8 | 18 | 46 | 0.083 | -28.7 | 13 | 39 | 0.119 | -25.2 | 18 | 38 | 0.160 | 48.3 | 13 | 44 | 0.157 | 51.6 |
| 0308611 | 14 | 21 | 0.343 | 1.9 | 15 | 25 | 0.069 | -3.6 | 14 | 25 | 0.146 | 5.2 | 15 | 26 | 0.227 | 10.6 | 11 | 44 | 0.080 | -49.8 | 12 | 30 | 0.144 | -52.8 | ||||||||
| 0336019 | 7 | 18 | 0.240 | -37.1 | 8 | 22 | 0.150 | -71.1 | ||||||||||||||||||||||||
| 0346279 | 9 | 30 | 0.085 | 19.0 | 11 | 19 | 0.089 | 19.7 | 9 | 39 | 0.068 | 29.7 | 11 | 24 | 0.105 | 26.5 | 7 | 28 | 0.153 | 41.7 | 11 | 28 | 0.068 | 44.3 | 7 | 27 | 0.115 | -82.6 | 10 | 27 | 0.353 | -78.4 |
| 0405385 | 11 | 29 | 0.186 | -22.8 | 76 | 22 | 0.071 | -26.3 | 11 | 47 | 0.112 | -24.5 | 76 | 35 | 0.068 | -21.8 | 14 | 15 | 0.553 | -12.8 | 77 | 22 | 0.087 | -9.4 | ||||||||
| 0420014 | 6 | 68 | 0.079 | -69.1 | 11 | 74 | 0.030 | -67.1 | 6 | 83 | 0.045 | -75.3 | 11 | 76 | 0.059 | -74.1 | 6 | 43 | 0.154 | 79.3 | 15 | 59 | 0.141 | 80.6 | 6 | 24 | 0.224 | 59.0 | 14 | 28 | 0.318 | 44.6 |
| 0426380 | 15 | 21 | 0.290 | -58.1 | 22 | 94 | 0.016 | 64.6 | ||||||||||||||||||||||||
| 0440003 | 11 | 29 | 0.059 | 40.6 | 11 | 54 | 0.069 | 65.6 | 11 | 18 | 0.132 | -65.0 | 15 | 13 | 0.618 | 35.7 | ||||||||||||||||
| 0450469 | 15 | 21 | 0.139 | 18.3 | 21 | 19 | 0.066 | 23.1 | 11 | 30 | 0.064 | 32.2 | 24 | 26 | 0.086 | 35.7 | ||||||||||||||||
| 0454810 | 16 | 55 | 0.110 | 4.9 | 17 | 44 | 0.138 | 11.1 | 16 | 41 | 0.139 | 14.8 | 17 | 34 | 0.154 | -2.6 | 13 | 17 | 0.221 | 31.5 | 17 | 39 | 0.260 | 42.8 | ||||||||
| 0457+024 | 7 | 29 | 0.126 | 17.3 | 12 | 33 | 0.070 | 19.6 | ||||||||||||||||||||||||
| 0502+049 | 6 | 36 | 0.051 | -38.8 | 9 | 40 | 0.052 | -38.7 | 6 | 56 | 0.028 | -32.7 | 9 | 52 | 0.032 | -29.8 | 10 | 25 | 0.160 | 3.4 | 8 | 32 | 0.289 | 11.1 | ||||||||
| 0537441 | 12 | 42 | 0.501 | -53.9 | 35 | 135 | 0.034 | -82.7 | ||||||||||||||||||||||||
| 0607157 | 10 | 37 | 0.246 | 10.8 | 11 | 93 | 0.078 | -10.9 | 10 | 17 | 0.358 | -29.4 | 12 | 26 | 0.604 | -46.3 | 8 | 58 | 0.091 | 29.7 | 11 | 58 | 0.075 | 29.7 | 8 | 48 | 0.106 | -33.3 | 10 | 57 | 0.216 | -31.6 |
| 0642349 | 16 | 23 | 0.083 | 24.0 | 11 | 21 | 0.060 | 25.0 | 16 | 14 | 0.190 | -9.5 | 11 | 17 | 0.158 | -9.2 | ||||||||||||||||
| 0646306 | 11 | 32 | 0.038 | -31.6 | 16 | 24 | 0.103 | -33.4 | 11 | 48 | 0.034 | -24.7 | 16 | 34 | 0.104 | -23.6 | 13 | 19 | 0.067 | 8.9 | 11 | 14 | 0.149 | 16.6 | ||||||||
| 0727115 | 13 | 44 | 0.269 | -19.5 | 12 | 56 | 0.077 | 77.5 | 13 | 66 | 0.100 | -64.7 | 12 | 25 | 0.411 | 30.7 | 10 | 50 | 0.104 | 77.1 | 14 | 69 | 0.100 | -77.6 | 10 | 59 | 0.142 | -75.7 | 13 | 75 | 0.113 | -71.0 |
| 0736+017 | 9 | 55 | 0.037 | 35.4 | 13 | 72 | 0.018 | 28.9 | 9 | 79 | 0.028 | 38.5 | 13 | 81 | 0.018 | 40.6 | 8 | 100 | 0.034 | 63.5 | 10 | 103 | 0.025 | 62.7 | 8 | 119 | 0.049 | -83.0 | 10 | 129 | 0.082 | -83.8 |
| 0808+019 | 9 | 19 | 0.227 | -4.9 | 12 | 11 | 0.402 | -8.2 | 13 | 22 | 0.247 | -11.4 | 13 | 10 | 0.449 | 11.3 | ||||||||||||||||
| 0829+046 | 11 | 25 | 0.112 | 20.0 | 11 | 20 | 0.103 | 23.1 | 11 | 18 | 0.061 | -11.0 | 11 | 14 | 0.150 | -14.8 | 8 | 54 | 0.028 | -4.0 | 12 | 48 | 0.056 | -1.6 | 8 | 47 | 0.060 | 25.7 | 12 | 43 | 0.197 | 32.1 |
| 0834201 | 10 | 15 | 0.261 | 26.8 | 12 | 16 | 0.085 | -18.1 | 14 | 20 | 0.586 | 59.7 | 13 | 14 | 0.171 | 62.5 | ||||||||||||||||
| 0837+035 | 9 | 22 | 0.057 | 19.6 | 11 | 23 | 0.050 | 21.3 | 9 | 38 | 0.038 | 25.5 | 11 | 33 | 0.064 | 25.6 | 8 | 21 | 0.104 | 58.6 | 10 | 18 | 0.110 | 60.0 | ||||||||
| 1021006 | 9 | 17 | 0.118 | -32.6 | 7 | 17 | 0.045 | -31.2 | 9 | 19 | 0.126 | -20.1 | 7 | 17 | 0.100 | -20.8 | ||||||||||||||||
| 1034293 | 11 | 23 | 0.259 | 25.2 | 10 | 51 | 0.145 | 2.8 | 11 | 37 | 0.199 | 14.5 | 10 | 32 | 0.274 | -2.3 | ||||||||||||||||
| 1048313 | 15 | 21 | 0.101 | -72.9 | 10 | 23 | 0.054 | -73.5 | 11 | 20 | 0.124 | -41.1 | 9 | 29 | 0.066 | -43.3 | 11 | 16 | 0.167 | 43.2 | 9 | 35 | 0.142 | 46.9 | ||||||||
| 1057797 | 11 | 13 | 0.442 | 43.0 | 15 | 34 | 0.094 | 81.6 | 14 | 19 | 0.107 | -76.1 | 19 | 23 | 0.155 | -61.8 | 14 | 8 | 0.410 | 61.9 | 17 | 25 | 0.372 | 55.3 | ||||||||
| 1115122 | 11 | 18 | 0.113 | -16.3 | 9 | 12 | 0.147 | -4.7 | 11 | 26 | 0.072 | 8.5 | 9 | 22 | 0.087 | 13.3 | 9 | 41 | 0.024 | -12.9 | 9 | 34 | 0.086 | -16.4 | ||||||||
| 1127145 | 9 | 91 | 0.086 | -17.7 | 9 | 108 | 10.09 | -17.8 | 9 | 152 | 0.056 | -20.1 | 9 | 132 | 0.097 | -20.0 | 13 | 84 | 0.069 | 20.9 | 11 | 76 | 0.076 | 21.5 | 12 | 43 | 0.057 | 81.7 | 9 | 229 | 0.143 | 80.3 |
| 1144379 | 12 | 50 | 0.244 | 32.4 | 9 | 86 | 0.272 | 47.7 | 12 | 75 | 0.059 | 33.8 | 9 | 62 | 0.146 | 60.8 | ||||||||||||||||
| 1148001 | 9 | 44 | 0.046 | -52.2 | 9 | 47 | 0.013 | -54.5 | 9 | 77 | 0.019 | -49.0 | 9 | 67 | 0.049 | -5 | 11 | 117 | 0.023 | -43.3 | 8 | 104 | 0.026 | -43.0 | 11 | 143 | 0.050 | -37.4 | 8 | 136 | 0.097 | -40.1 |
| 1243072 | 14 | 21 | 0.124 | 27.2 | 6 | 13 | 0.068 | 16.1 | 14 | 26 | 0.109 | 20.6 | 6 | 20 | 0.174 | 18.9 | 11 | 23 | 0.076 | 36.5 | 7 | 19 | 0.094 | 34.6 | 11 | 27 | 0.096 | 66.4 | 7 | 19 | 0.705 | 65.1 |
| 1255316 | 15 | 46 | 0.085 | -54.5 | 8 | 44 | 0.036 | -54.2 | 15 | 48 | 0.051 | -58.9 | 8 | 41 | 0.054 | -59.7 | 18 | 66 | 0.034 | -20.3 | 11 | 54 | 0.168 | -20.1 | ||||||||
| 1256220 | 16 | 15 | 0.146 | 48.1 | 7 | 16 | 0.084 | 69.0 | 11 | 20 | 0.121 | 16.6 | 7 | 18 | 0.047 | 17.6 | 11 | 23 | 0.110 | -30.3 | 7 | 28 | 0.501 | -30.9 | ||||||||
| 1334127 | 10 | 119 | 0.164 | 78.6 | 7 | 163 | 0.102 | -75.4 | ||||||||||||||||||||||||
| 1351018 | 14 | 18 | 0.168 | -40.2 | 6 | 14 | 0.097 | -45.0 | ||||||||||||||||||||||||
| 1406076 | 11 | 25 | 0.085 | -44.6 | 7 | 18 | 0.078 | -63.6 | 11 | 18 | 0.160 | -45.2 | 7 | 15 | 0.190 | -54.6 | ||||||||||||||||
| 1435218 | 14 | 14 | 0.158 | -9.9 | 8 | 21 | 0.079 | -12.3 | 14 | 23 | 0.071 | -5.0 | 8 | 24 | 0.090 | -6.8 | ||||||||||||||||
| 1443162 | 12 | 38 | 0.038 | -51.3 | 7 | 31 | 0.041 | -50.3 | 12 | 36 | 0.065 | -59.2 | 7 | 25 | 0.072 | -58.6 | ||||||||||||||||
| 1504166 | 12 | 61 | 0.088 | 33.8 | 7 | 70 | 0.039 | 29.3 | 12 | 42 | 0.128 | 19.7 | 7 | 41 | 0.194 | 17.1 | ||||||||||||||||
| 1519273 | 15 | 45 | 0.195 | -30.2 | 7 | 18 | 0.287 | -20.0 | 15 | 62 | 0.319 | -24.0 | 7 | 26 | 0.331 | -35.2 | 10 | 24 | 0.305 | 17.5 | 8 | 28 | 0.085 | 41.4 | 10 | 07 | 0.597 | 46.2 | 8 | 21 | 0.540 | -33.9 |
| 1610771 | 16 | 106 | 0.077 | -68.5 | 13 | 135 | 0.015 | -67.2 | 16 | 122 | 0.054 | -71.7 | 13 | 104 | 0.088 | -68.1 | ||||||||||||||||
| 1622297 | 11 | 100 | 0.045 | 16.4 | 10 | 108 | 0.042 | 12.8 | 11 | 119 | 0.015 | 9.9 | 10 | 121 | 0.030 | 9.0 | 10 | 165 | 0.033 | -26.3 | 9 | 142 | 0.020 | -25.3 | ||||||||
| 1718649 | 14 | 12 | 0.240 | -10.7 | 9 | 17 | 0.350 | -20.1 | 17 | 26 | 0.448 | 36.2 | 9 | 11 | 0.384 | -15.9 | 18 | 11 | 0.221 | 7.9 | 9 | 20 | 0.684 | 10.9 | ||||||||
| 1741038 | 11 | 29 | 0.252 | 69.0 | 6 | 25 | 0.263 | -76.9 | 11 | 21 | 0.168 | 52.5 | 6 | 31 | 0.131 | 60.3 | 13 | 22 | 0.146 | 66.4 | 6 | 21 | 0.075 | 79.2 | 13 | 17 | 0.275 | -73.1 | 6 | 16 | 0.354 | -38.9 |
| 1815553 | 14 | 42 | 0.059 | 81.5 | 8 | 18 | 0.040 | 80.1 | 14 | 40 | 0.052 | -84.1 | 8 | 15 | 0.352 | -36.6 | ||||||||||||||||
| 1921293 | 12 | 486 | 0.096 | -31.5 | 11 | 515 | 0.056 | -67.1 | 12 | 567 | 0.076 | 17.7 | 11 | 249 | 0.103 | 82.3 | 9 | 604 | 0.022 | 18.9 | 10 | 295 | 0.085 | 22.8 | 9 | 359 | 0.074 | -21.9 | 8 | 462 | 0.034 | -25.8 |
| 1925610 | 8 | 37 | 0.067 | 64.2 | 7 | 42 | 0.031 | 69.6 | 12 | 35 | 0.076 | 58.7 | 7 | 29 | 0.105 | 61.2 | 21 | 30 | 0.076 | 77.6 | 7 | 24 | 0.059 | 12.4 | 21 | 32 | 0.075 | -13.3 | 7 | 34 | 0.193 | -7.2 |
| 1937101 | 8 | 19 | 0.116 | -22.6 | 6 | 18 | 0.142 | -28.5 | 12 | 15 | 0.413 | 64.3 | 7 | 14 | 0.352 | 68.1 | ||||||||||||||||
| 1958179 | 9 | 26 | 0.085 | 84.3 | 6 | 21 | 0.053 | 79.9 | 9 | 39 | 0.114 | 69.0 | 6 | 28 | 0.059 | 78.0 | 8 | 44 | 0.060 | 32.5 | 6 | 36 | 0.035 | 43.2 | ||||||||
| 2058297 | 8 | 16 | 0.111 | 1.2 | 8 | 16 | 0.101 | -85.9 | 8 | 20 | 0.053 | 43.2 | 8 | 18 | 0.076 | 83.0 | 9 | 19 | 0.064 | -73.1 | 8 | 18 | 0.065 | -76.0 | 9 | 18 | 0.076 | 65.4 | 8 | 20 | 0.384 | 46.9 |
| 2106413 | 9 | 58 | 0.100 | 66.8 | 11 | 65 | 0.026 | 68.0 | 9 | 41 | 0.067 | 44.8 | 11 | 22 | 0.218 | 51.6 | 10 | 51 | 0.045 | 69.6 | 7 | 47 | 0.057 | 72.9 | 10 | 61 | 0.072 | 81.4 | 7 | 54 | 0.197 | 35.0 |
| 2121+053 | 11 | 36 | 0.070 | 59.3 | 5 | 17 | 0.170 | 76.1 | 11 | 45 | 0.073 | 63.7 | 5 | 25 | 0.190 | 58.7 | 9 | 35 | 0.133 | 65.4 | 5 | 31 | 0.050 | 51.5 | 9 | 42 | 0.107 | 68.4 | 5 | 25 | 0.433 | 55.8 |
| 2128123 | 10 | 11 | 0.572 | 18.1 | 8 | 18 | 0.123 | -12.6 | 10 | 21 | 0.222 | -61.9 | 8 | 24 | 0.188 | -63.6 | 9 | 17 | 0.131 | -44.4 | 7 | 14 | 0.147 | -46.4 | 9 | 32 | 0.068 | -52.9 | 7 | 32 | 0.229 | -5 |
| 2134+004 | 7 | 100 | 0.082 | -88.2 | 7 | 47 | 0.272 | 40.5 | 7 | 33 | 0.244 | 33.9 | 7 | 14 | 0.784 | 15.4 | ||||||||||||||||
| 2142758 | 13 | 15 | 0.124 | 73.0 | 12 | 20 | 0.069 | 72.4 | 13 | 16 | 0.124 | 70.6 | 12 | 18 | 0.139 | 78.4 | ||||||||||||||||
| 2149307 | 12 | 73 | 0.025 | 44.1 | 6 | 79 | 0.030 | 41.0 | 12 | 83 | 0.049 | 57.1 | 6 | 73 | 0.019 | 55.4 | 17 | 38 | 0.077 | 81.3 | 6 | 33 | 0.079 | 83.9 | 17 | 28 | 0.166 | 65.8 | 6 | 28 | 0.242 | 63.0 |
| 2155304 | 21 | 18 | 0.237 | -24.5 | 6 | 16 | 0.085 | -26.3 | 20 | 17 | 0.236 | -20.6 | 9 | 14 | 0.337 | -26.9 | ||||||||||||||||
| 2243123 | 14 | 52 | 0.080 | 21.1 | 7 | 48 | 0.048 | 15.9 | 14 | 14 | 0.229 | 36.6 | 7 | 22 | 0.277 | 24.8 | 11 | 31 | 0.099 | -15.6 | 7 | 24 | 0.180 | -17.5 | 11 | 36 | 0.105 | -39.1 | 7 | 36 | 0.204 | -41.4 |
| 2312319 | 9 | 14 | 0.096 | -83.8 | 8 | 17 | 0.056 | -82.7 | 9 | 24 | 0.090 | -85.1 | 8 | 23 | 0.081 | -82.6 | 12 | 31 | 0.077 | -74.1 | 7 | 28 | 0.059 | -72.3 | ||||||||
| 2326477 | 16 | 47 | 0.114 | -23.3 | 8 | 52 | 0.025 | -31.3 | 16 | 89 | 0.032 | -3 | 8 | 81 | 0.063 | -29.1 | 13 | 128 | 0.017 | -19.1 | 9 | 111 | 0.039 | -19.2 | 13 | 137 | 0.040 | -61.8 | 8 | 126 | 0.108 | 1.0 |
| 2329384 | 10 | 25 | 0.077 | 71.7 | 10 | 28 | 0.051 | 87.5 | ||||||||||||||||||||||||
| 2332017 | 11 | 21 | 0.167 | -24.9 | 7 | 17 | 0.103 | -22.4 | 11 | 32 | 0.084 | -33.5 | 7 | 23 | 0.060 | -31.9 | ||||||||||||||||
| 2345167 | 11 | 60 | 0.117 | 16.2 | 7 | 48 | 0.031 | 3.3 | 11 | 55 | 0.132 | 9.7 | 7 | 43 | 0.204 | 13.7 | 13 | 49 | 0.165 | -1.0 | 7 | 46 | 94 | 9.4 | ||||||||
| 2355534 | 14 | 31 | 0.154 | -4.2 | 8 | 25 | 0.073 | -15.4 | 14 | 48 | 0.126 | -10.6 | 8 | 49 | 0.107 | -13.4 | ||||||||||||||||
| PKS | May 1994 | August 1994 | ||||||
|---|---|---|---|---|---|---|---|---|
| Source | ||||||||
| name | ||||||||
| 0003066 | -0.06 | 0.24 | 0.34 | 0.17 | -0.13 | 0.24 | 0.43 | 0.18 |
| 0013005 | -0.33 | -0.14 | 0.09 | -0.13 | -0.41 | -0.10 | 0.12 | -0.14 |
| 0023263 | -0.93 | -0.74 | -0.66 | -0.78 | -0.99 | -0.73 | -0.68 | -0.80 |
| 0044846 | -0.27 | -0.10 | -0.15 | -0.17 | ||||
| 0048427 | 0.24 | 0.36 | 0.33 | 0.31 | 0.14 | 0.41 | 0.39 | 0.32 |
| 0056572 | -0.20 | 0.01 | 0.10 | -0.03 | -0.23 | -0.01 | 0.09 | -0.05 |
| 0104408 | 0.88 | 0.76 | 0.46 | 0.71 | 0.89 | 0.94 | 0.30 | 0.73 |
| 0122003 | -0.09 | 0.05 | 0.02 | 0.00 | -0.08 | 0.03 | 0.10 | 0.01 |
| 0131522 | 0.24 | 0.12 | -0.39 | 0.01 | ||||
| 0138097 | -0.08 | 0.16 | 0.09 | 0.06 | -0.03 | 0.16 | 0.25 | 0.12 |
| 0142278 | -0.09 | 0.09 | -0.17 | -0.04 | -0.29 | 0.02 | -0.06 | -0.10 |
| 0146+056 | -0.09 | 0.30 | 0.50 | 0.24 | -0.11 | 0.30 | 0.50 | 0.23 |
| 0150334 | -0.28 | -0.08 | -0.03 | -0.13 | -0.36 | -0.12 | -0.05 | -0.18 |
| 0202172 | 0.02 | 0.21 | 0.08 | 0.11 | -0.07 | 0.22 | 0.10 | 0.09 |
| 0208512 | 0.03 | -0.09 | -0.07 | -0.04 | ||||
| 0214522 | -0.70 | -0.48 | -0.36 | -0.52 | -0.74 | -0.49 | -0.36 | -0.53 |
| 0215+015 | 0.40 | 0.04 | -0.16 | 0.09 | 0.35 | 0.28 | 0.10 | 0.25 |
| 0220349 | -0.07 | 0.17 | 0.12 | 0.08 | -0.09 | 0.21 | 0.20 | 0.12 |
| 0252549 | 0.06 | 0.09 | -0.02 | 0.05 | ||||
| 0302623 | -0.17 | -0.03 | -0.03 | -0.07 | -0.19 | 0.00 | 0.13 | -0.02 |
| 0308611 | 0.34 | 0.46 | 0.18 | 0.34 | 0.28 | 0.46 | 0.23 | 0.33 |
| 0334546 | -0.50 | 0.07 | 0.50 | 0.01 | -0.53 | 0.05 | 0.48 | 0.00 |
| 0336019 | -0.04 | 0.11 | 0.21 | 0.09 | -0.16 | 0.07 | 0.10 | 0.01 |
| 0346279 | 0.05 | 0.21 | 0.17 | 0.14 | 0.11 | 0.17 | 0.18 | 0.15 |
| 0355483 | -0.43 | 0.17 | 0.22 | -0.01 | ||||
| 0405385 | 0.08 | 0.29 | 0.38 | 0.25 | 0.08 | 0.24 | 0.33 | 0.22 |
| 0420014 | -0.13 | 0.04 | 0.30 | 0.07 | -0.13 | -0.14 | -0.13 | -0.13 |
| 0422+004 | 0.18 | 0.19 | -0.05 | 0.11 | ||||
| 0426380 | 0.37 | 0.56 | 0.37 | 0.44 | 0.14 | 0.42 | 0.46 | 0.34 |
| 0434188 | -0.15 | 0.25 | 0.61 | 0.23 | -0.15 | 0.29 | 0.64 | 0.26 |
| 0437454 | -0.06 | -0.05 | -0.13 | -0.08 | 0.09 | 0.00 | 0.12 | 0.07 |
| 0440003 | -0.19 | 0.02 | 0.20 | 0.01 | ||||
| 0450469 | -0.31 | -0.16 | -0.16 | -0.21 | -0.23 | -0.02 | 0.01 | -0.08 |
| 0454463 | -0.28 | -0.26 | -0.50 | -0.34 | ||||
| 0454810 | 0.15 | 0.15 | 0.35 | 0.21 | 0.21 | 0.39 | 0.30 | 0.31 |
| 0457+024 | -0.50 | -0.19 | 0.06 | -0.22 | -0.55 | -0.18 | 0.07 | -0.22 |
| 0502+049 | -0.40 | -0.22 | 0.09 | -0.19 | -0.12 | -0.21 | 0.08 | -0.09 |
| 0522611 | -0.02 | -0.02 | -0.17 | -0.06 | -0.12 | -0.08 | -0.17 | -0.12 |
| 0528250 | -0.52 | -0.43 | 0.05 | -0.32 | -0.54 | -0.38 | 0.14 | -0.28 |
| 0537286 | -0.67 | -0.42 | -0.09 | -0.40 | -0.59 | -0.42 | 0.02 | -0.35 |
| 0537441 | 0.32 | 0.47 | 0.31 | 0.37 | 0.34 | 0.28 | 0.51 | 0.37 |
| 0607157 | 0.39 | 0.41 | -0.03 | 0.27 | 0.55 | 0.56 | 0.13 | 0.43 |
| 0642349 | -0.30 | 0.20 | 0.20 | 0.04 | -0.33 | 0.18 | 0.23 | 0.03 |
| 0646306 | -0.03 | 0.42 | 0.14 | 0.19 | -0.10 | 0.20 | 0.33 | 0.14 |
| 0648165 | 0.06 | 0.02 | -0.21 | -0.04 | 0.13 | 0.03 | -0.28 | -0.03 |
| 0727115 | -0.08 | 0.36 | 0.36 | 0.22 | -0.06 | 0.23 | 0.44 | 0.20 |
| 0728320 | -0.54 | -0.20 | 0.12 | -0.21 | -0.70 | -0.44 | 0.26 | -0.31 |
| 0733174 | -0.62 | -0.46 | -0.11 | -0.40 | -0.60 | -0.42 | -0.18 | -0.41 |
| 0736+017 | -0.12 | -0.11 | -0.24 | -0.15 | -0.30 | -0.43 | -0.37 | -0.37 |
| 0808+019 | 0.09 | 0.28 | 0.17 | 0.19 | -0.06 | 0.08 | 0.00 | 0.01 |
| 0829+046 | 0.09 | 0.17 | 0.05 | 0.11 | 0.20 | 0.16 | 0.09 | 0.15 |
| 0834201 | 0.34 | 0.17 | -0.28 | 0.09 | 0.33 | 0.11 | -0.22 | 0.08 |
| 0837+035 | -0.16 | 0.08 | 0.16 | 0.03 | -0.14 | 0.04 | 0.14 | 0.01 |
| 1021006 | -0.68 | -0.39 | 0.04 | -0.35 | -0.67 | -0.44 | 0.03 | -0.37 |
| 1034293 | 0.73 | 0.82 | -0.07 | 0.52 | 0.45 | 0.29 | 0.42 | 0.38 |
| 1036154 | 0.10 | 0.03 | -0.10 | 0.01 | 0.08 | 0.00 | -0.03 | 0.02 |
| 1048313 | -0.30 | -0.06 | 0.12 | -0.08 | -0.30 | -0.15 | 0.04 | -0.14 |
| 1057797 | 0.01 | 0.48 | 0.71 | 0.40 | 0.05 | 0.60 | 0.45 | 0.38 |
| 1105680 | -0.24 | 0.39 | 0.93 | 0.35 | -0.33 | 0.28 | 0.91 | 0.27 |
| 1115122 | 0.08 | 0.08 | -0.17 | 0.00 | 0.03 | -0.07 | -0.15 | -0.06 |
| 1127145 | -0.39 | -0.30 | -0.26 | -0.31 | -0.41 | -0.33 | -0.26 | -0.33 |
| 1143245 | -0.56 | -0.23 | 0.20 | -0.21 | -0.53 | -0.24 | 0.28 | -0.18 |
| 1144379 | -0.10 | 0.22 | -0.20 | -0.01 | 0.09 | 0.11 | 0.36 | 0.18 |
| 1148001 | -0.56 | -0.41 | -0.37 | -0.45 | -0.56 | -0.47 | -0.34 | -0.46 |
| 1148671 | -0.65 | -0.15 | 0.68 | -0.06 | -0.68 | -0.10 | 0.86 | 0.00 |
| 1243072 | 0.37 | 0.46 | 0.27 | 0.38 | 0.36 | 0.38 | 0.33 | 0.36 |
| 1253055 | 0.32 | 0.29 | 0.15 | 0.26 | 0.29 | 0.26 | 0.41 | 0.31 |
| 1255316 | -0.09 | 0.29 | 0.23 | 0.15 | -0.10 | 0.38 | 0.37 | 0.22 |
| 1256220 | 0.25 | -0.11 | -0.22 | -0.03 | 0.49 | -0.04 | -0.26 | 0.06 |
| 1334127 | 0.29 | 0.56 | 0.44 | 0.44 | 0.33 | 0.35 | 0.52 | 0.39 |
| 1351018 | -0.24 | 0.25 | 0.34 | 0.12 | -0.22 | 0.20 | 0.37 | 0.12 |
| 1354152 | -0.16 | 0.34 | 0.35 | 0.18 | -0.05 | 0.20 | 0.39 | 0.18 |
| 1402012 | -0.61 | -0.36 | -0.26 | -0.41 | -0.59 | -0.38 | -0.19 | -0.39 |
| 1406076 | 0.49 | 0.50 | 0.00 | 0.34 | 0.37 | 0.45 | 0.09 | 0.32 |
| 1435218 | -0.17 | -0.15 | -0.12 | -0.15 | -0.07 | -0.14 | -0.01 | -0.08 |
| 1443162 | 0.04 | 0.12 | -0.20 | 0.00 | -0.03 | 0.06 | -0.10 | -0.02 |
| 1502+036 | 0.07 | 0.10 | 0.22 | 0.13 | 0.12 | 0.64 | 0.48 | 0.42 |
| 1504166 | -0.11 | -0.02 | -0.05 | -0.06 | -0.10 | 0.02 | -0.04 | -0.04 |
| 1519273 | -0.03 | 0.40 | 0.20 | 0.20 | 0.04 | 0.43 | 0.62 | 0.36 |
| 1535+004 | -0.46 | -0.20 | -0.10 | -0.25 | -0.45 | -0.21 | -0.03 | -0.23 |
| 1540828 | -0.25 | -0.14 | -0.34 | -0.23 | -0.29 | -0.11 | -0.27 | -0.21 |
| 1549790 | -0.63 | -0.21 | -0.14 | -0.33 | ||||
| 1555140 | -0.60 | -0.14 | 0.81 | 0.00 | -0.61 | -0.18 | 0.85 | -0.01 |
| 1556245 | -0.59 | -0.53 | -0.47 | -0.53 | -0.54 | -0.47 | 1.42 | 0.07 |
| 1610771 | -0.01 | -0.02 | -0.21 | -0.07 | 0.01 | 0.01 | -0.12 | -0.03 |
| 1619680 | -0.53 | -0.08 | 0.38 | -0.09 | -0.56 | -0.01 | 0.36 | -0.08 |
| 1622297 | -0.05 | 0.12 | 0.06 | 0.05 | -0.04 | 0.10 | -0.18 | -0.03 |
| 1718649 | -0.35 | 0.09 | 0.32 | 0.02 | -0.40 | 0.08 | 0.34 | 0.00 |
| 1741038 | 0.41 | 0.42 | 0.35 | 0.40 | 0.56 | 0.49 | 0.51 | 0.52 |
| 1758651 | 0.10 | 0.11 | -0.24 | 0.00 | 0.10 | 0.13 | -0.22 | 0.01 |
| 1815553 | -0.10 | 0.27 | 0.32 | 0.16 | -0.15 | -0.06 | 0.01 | -0.06 |
| 1921293 | 0.33 | 0.60 | 0.25 | 0.41 | 0.25 | 0.42 | 0.25 | 0.32 |
| 1925610 | 0.03 | 0.37 | 0.11 | 0.19 | -0.08 | 0.31 | 0.15 | 0.14 |
| 1937101 | -0.37 | -0.23 | -0.01 | -0.21 | -0.40 | -0.16 | 0.12 | -0.15 |
| 1958179 | -0.34 | -0.23 | -0.12 | -0.23 | -0.16 | -0.29 | -0.32 | -0.26 |
| 2016615 | -0.69 | -0.51 | -0.49 | -0.56 | ||||
| 2052474 | -0.23 | -0.10 | -0.17 | -0.16 | -0.31 | -0.12 | 0.08 | -0.12 |
| 2058297 | -0.25 | -0.03 | 0.54 | 0.07 | -0.20 | 0.04 | 0.10 | -0.02 |
| 2106413 | 0.23 | 0.25 | 0.09 | 0.20 | 0.10 | 0.31 | 0.11 | 0.18 |
| 2109811 | -0.03 | 0.18 | 0.27 | 0.14 | ||||
| 2121+053 | -0.33 | -0.10 | 0.01 | -0.14 | -0.27 | -0.02 | 0.14 | -0.05 |
| 2126158 | -0.35 | 0.40 | 0.89 | 0.31 | -0.36 | 0.38 | 0.86 | 0.28 |
| 2128123 | 0.17 | 0.30 | 0.32 | 0.27 | 0.25 | 0.34 | 0.33 | 0.31 |
| 2134+004 | -0.23 | 0.42 | 1.20 | 0.45 | ||||
| 2142758 | -0.36 | -0.27 | -0.27 | -0.30 | -0.37 | -0.25 | -0.21 | -0.28 |
| 2146783 | -0.51 | 0.23 | 0.68 | 0.13 | -0.53 | 0.21 | 0.61 | 0.09 |
| 2149307 | -0.22 | 0.29 | 0.33 | 0.14 | -0.34 | 0.20 | 0.33 | 0.06 |
| 2155304 | -0.03 | 0.10 | 0.07 | 0.05 | -0.04 | 0.08 | -0.03 | 0.01 |
| 2243123 | 0.05 | 0.26 | 0.17 | 0.17 | 0.05 | 0.24 | 0.14 | 0.15 |
| 2245328 | 0.07 | -0.16 | -0.41 | -0.16 | ||||
| 2312319 | -0.46 | -0.35 | -0.28 | -0.36 | -0.50 | -0.38 | -0.24 | -0.38 |
| 2320035 | -0.09 | -0.02 | -0.09 | -0.06 | -0.16 | 0.01 | -0.02 | -0.05 |
| 2326477 | -0.07 | -0.29 | -0.40 | -0.25 | -0.09 | -0.29 | -0.36 | -0.25 |
| 2329384 | -0.48 | -0.01 | 0.32 | -0.06 | ||||
| 2332017 | -0.25 | -0.11 | -0.02 | -0.13 | -0.30 | -0.13 | 0.07 | -0.12 |
| 2333528 | -0.29 | -0.16 | -0.19 | -0.21 | -0.33 | -0.16 | 0.05 | 0.18 |
| 2345167 | -0.16 | 0.29 | 0.01 | 0.06 | -0.07 | 0.20 | 0.18 | 0.11 |
| 2355534 | -0.25 | 0.18 | 0.04 | 0.00 | -0.14 | 0.04 | 0.06 | -0.01 |
| Source | 8.6 GHz | 4.8 GHz | 2.4 GHz | |||
|---|---|---|---|---|---|---|
| name | ||||||
| 0104408 | 0.011 | 0.003 | 0.013 | 0.004 | 0.044 | 0.007 |
| 0346279 | 0.009 | 0.007 | 0.030 | 0.015 | 0.016 | 0.022 |
| 0405385 | 0.043 | 0.003 | 0.056 | 0.007 | 0.056 | 0.011 |
| 0422+004 | 0.018 | 0.024 | ||||
| 0437454 | 0.025 | 0.009 | 0.016 | 0.014 | ||
| 0440003 | 0.029 | 0.011 | 0.018 | |||
| 0450469 | 0.012 | 0.003 | 0.016 | 0.004 | 0.034 | 0.006 |
| 0502+049 | 0.005 | 0.027 | 0.018 | 0.011 | ||
| 0528250 | 0.020 | 0.009 | 0.014 | 0.005 | ||
| 0607157 | 0.012 | 0.005 | 0.013 | 0.023 | 0.013 | 0.031 |
| 0646306 | 0.014 | 0.012 | 0.024 | 0.011 | 0.037 | 0.024 |
| 0728320 | 0.026 | 0.011 | 0.034 | 0.007 | ||
| 0808+019 | 0.014 | 0.021 | 0.011 | 0.023 | 0.025 | 0.022 |
| 1034293 | 0.057 | 0.012 | 0.092 | 0.113 | ||
| 1048313 | 0.026 | 0.019 | 0.011 | 0.025 | 0.023 | 0.010 |
| 1144379 | 0.075 | 0.017 | 0.146 | 0.031 | ||
| 1256220 | 0.012 | 0.027 | 0.014 | 0.022 | 0.009 | 0.007 |
| 1502+036 | 0.020 | 0.002 | 0.014 | 0.008 | ||
| 1519273 | 0.029 | 0.018 | 0.037 | 0.023 | 0.040 | 0.009 |
| 1556245 | 0.015 | 0.042 | 0.028 | 0.033 | ||
| 1622297 | 0.020 | 0.031 | 0.011 | 0.014 | 0.021 | 0.016 |
| 2155304 | 0.024 | 0.008 | 0.021 | 0.005 | 0.034 | 0.020 |
| Source | 8.6 GHz | 4.8 GHz | 2.4 GHz | |||
|---|---|---|---|---|---|---|
| name | ||||||
| 0150334 | -0.006 | -0.009 | -0.002 | 0.005 | -0.003 | -0.004 |
| 0727115 | 0.009 | -0.006 | 0.011 | |||
| 1334127 | 0.000 | 0.010 | 0.001 | |||
| 1504166 | 0.002 | 0.003 | -0.001 | 0.007 | 0.010 | 0.011 |
| 1622297 | 0.003 | 0.072 | -0.085 | |||
| 2106413 | 0.004 | 0.020 | 0.001 | 0.000 | -0.002 | -0.001 |
| 2149307 | -0.001 | 0.003 | 0.015 | |||
| 2155304 | 0.024 | -0.005 | 0.010 | |||
| 2312319 | -0.011 | 0.009 | 0.016 | |||