Muon Density Measurements with the KASCADE Central Detector
Abstract
Frequency distributions of local muon densities in high-energy extensive air-showers (EAS) are presented as signature of the primary cosmic ray energy spectrum in the knee region. Together with the gross shower variables like shower core position, angle of incidence, and the shower sizes, the KASCADE experiment is able to measure local muon densities for two different muon energy thresholds. The spectra have been reconstructed for various core distances, as well as for particular subsamples, classified on the basis of the shower size ratio . The measured density spectra of the total sample exhibit clear kinks reflecting the knee of the primary energy spectrum. While relatively sharp changes of the slopes are observed in the spectrum of EAS with small values of the shower size ratio, no such feature is detected at EAS of large ratio in the energy range of 1–10 PeV. Comparing the spectra for various thresholds and core distances with detailed Monte Carlo simulations the validity of EAS simulations is discussed.
keywords:
cosmic rays; air shower; muon component, energy spectrum, mass compositionPACS:
96.40.Pq 96.40.De, , , , ,††thanks: now at: Humboldt University Berlin, Germany, , , , , , , , , , , , , ,††thanks: corresponding author; email: haungs@ik3.fzk.de, , , , ,††thanks: now at: Warsaw University of Technology, Poland, ,††thanks: now at: University of Leeds, U.K.,††thanks: now at: ETH Zurich, Switzerland, , , , , , , , , , ,††thanks: present address: Habichtweg 4, D-76646 Bruchsal, Germany, , , , ,††thanks: now at: University of Heidelberg, Germany, , , ,
=
1 Introduction
Measurements of the energy spectrum and the elemental composition
of the primary cosmic radiation constrain
theoretical models of the sources, acceleration mechanisms and
transport of the radiation through the interstellar space.
While for lower energies direct measurements by satellites or
balloon-borne detectors yield spectroscopic results
(see ref.[1]), for primary energies above some
eV only indirect measurements via extensive air shower
(EAS) observations can be performed.
It is well known that the energy spectrum of the primary cosmic
radiation shows a kink (mostly referred to as “knee”) at
energies around 3 PeV [2].
Though the first evidence of the existence of this knee has been
presented more than 40 years ago [3],
the knowledge of the detailed structure of the spectrum in the
PeV region is still scarce, and the origin of the knee not yet
understood.
Most of the earth-bound air shower experiments use large
detector arrays to measure charged particles
and reconstruct shower sizes of the individual
events by adjusting a particular lateral distribution
function to the measured densities.
The resulting shower size spectra
reflect the primary energy spectrum, but a quantitative conversion
to energy has to invoke a model of the shower development and on an
assumption of a mass composition.
Hence the determination of the energy spectrum is affected by
different systematic uncertainties, especially by the
dependence on the model of high-energy interactions. This also leads
to a mutual dependence of the
results for the energy spectrum and mass composition.
When comparing recent results of earth-bound air shower experiments,
like CASA-MIA [4], TIBET [5] or
Akeno [6],
significant differences in the absolute magnitudes of the total flux,
the knee position and slope of the energy spectrum are noticed.
A recent non-parametric analysis of KASCADE data [7]
reports equally large differences on the energy spectra,
depending on the high-energy hadronic interaction model,
illustrating the considerable influence of the interaction
models underlying the Monte Carlo simulations.
To identify the ultimate sources of the disagreements,
it would be useful to analyze different experiments on basis
of a coherent methodology as well as to compare the resulting
features for various sets of different EAS parameters in the
individual experiments.
In the present paper we endeavor to analyze
the frequency distribution of local muon densities at
fixed distances from the shower core.
The local muon density spectra reflect the gross features of the
primary energy spectrum, as the muon content for a certain
distance to the shower center observed at sea-level
is mainly determined by the primary energy.
While the reconstruction of electron or muon size spectra
necessarily implies a choice of the form of the lateral
distribution function, spectra of the muon density
are free from this bias.
Thus with “independent” measurements of such spectra
for different fixed core distances allow a check on
the lateral distribution obtained from simulations.
In addition, the layout of the KASCADE experiment [8],
with a central detector system consisting of densely
packed muon counters with different shielding, enables
the study of density spectra for two different muon
energy thresholds.
Hence the consistency of the simulations with respect to the
muon energy spectrum can be performed.
2 Experimental setup and data handling
KASCADE (KArlsruhe Shower Core and Array DEtector)
is a multi-detector setup [8]
at Forschungszentrum Karlsruhe (m a.s.l.),
Germany, for EAS measurements
in the primary energy range around the knee.
The main detector components of KASCADE used for the
present analysis are an
“array” of 252 stations, located on a squared grid
with m spacing and a “central detector” comprising
additional detector systems.
The array is organized in 16 subarrays (
stations each) and provides the data necessary for the
reconstruction of the basic EAS characteristics like
electron and muon size (total number of electrons and muons
in the EAS), core location, and arrival direction of individual
air showers.
The special arrangement of shielded and unshielded detectors
on top of each other allows an independent
estimation of the total electron and muon number
for each individual shower. The densities are estimated
and corrected iteratively for punch-through effects (-counters)
and muon contamination (-counters).
Lateral correction functions from simulations of EAS and
detectors are used.
The reconstructed particle densities are fitted by
Nishimura-Kamata-Greisen (NKG) functions in the experimental
accessible distance ranges (10-200 m for the
electron component, 40-200 m for the muon component).
The densities obtained are then integrated from zero to infinity for
the total numbers and . In addition we quote
the so-called truncated numbers for which the NKG functions
are integrated in a limited range only
( and
).
These truncated numbers provide reduced systematic uncertainties
since extrapolations into the radial range outside our
measurement areas are avoided.
Uncertainties are estimated by Monte Carlo calculations and range
below 20% for the total numbers and even better for the
truncated numbers.
The location of the shower core once inside a fiducial area
is determined to better than 3 m.
The arrival direction of the shower is reconstructed from the
arrival times of EAS particles ().
These procedures are described in detail elsewhere [11].
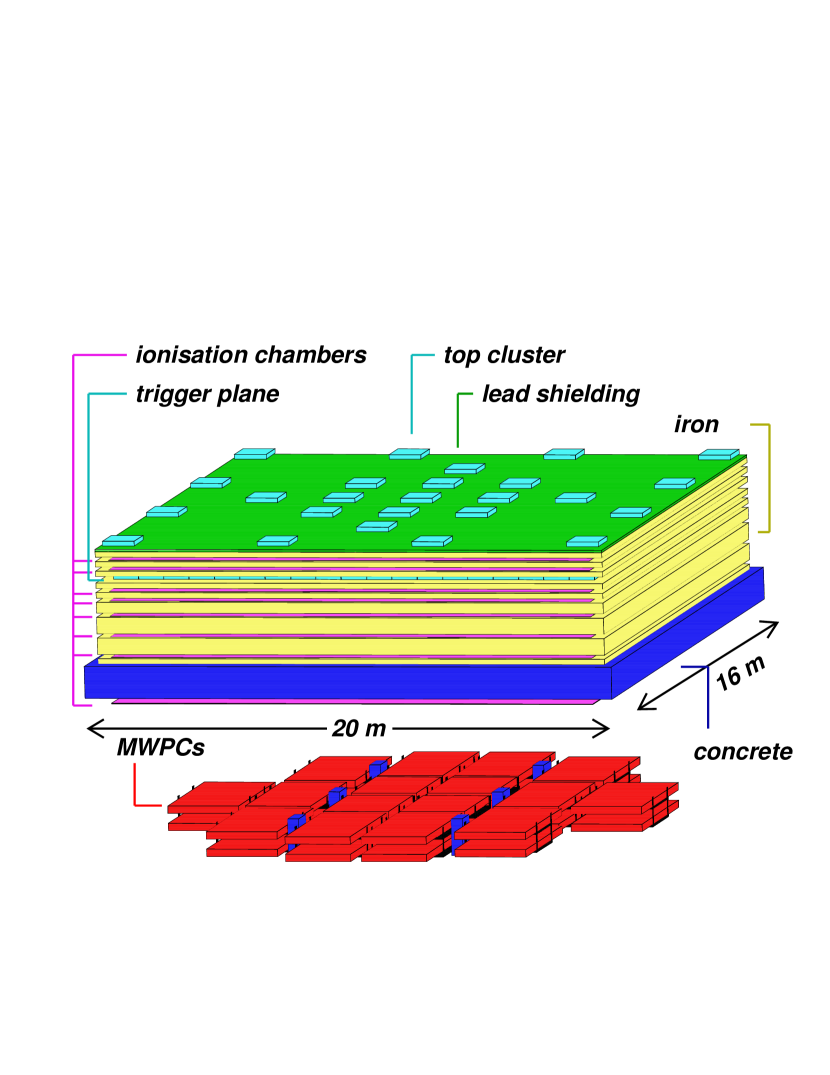
The KASCADE central detector is placed at the geometrical
center of the detector array. It consists
of four different detector systems (Fig. 1),
covering a total area of 1620 m2.
The local muon density of EAS is measured
with the multiwire proportional chambers (MWPC)
and the trigger plane.
Below the hadron calorimeter [9],
with a total thickness of
5 cm lead, 154 cm steel, and 77 cm concrete corresponding
to a threshold for vertical muons of 2.4 GeV,
a setup of 32 large
multiwire proportional chambers is installed
[10].
The chambers of three different sizes
(5 m2, 8.2 m2, and 8.8 m2)
are arranged in two layers with 38 cm vertical distance.
In total each layer has a sensitive area of 129 m2.
A single chamber consists of two layers of cathode strips
at angles of with respect to a layer of
anode wires in between.
The chambers are operated with an argon-methane gas mixture.
The electronics allows a digital readout of all wires and strips,
i.e. in total of c. 32,000 channels.
Hits of through-going particles are reconstructed as the
intersection of the anode wires and the cathode strips.
Thresholds and delays are adjustable for each channel separately.
A continuous monitoring of the reconstruction efficiency
during measurements is performed.
The chambers have a spatial resolution of about 5 mm.
The reconstruction of high-energy muons in the MWPC
starts from the reconstructed hits in each plane
and the shower direction. The reconstructed direction is
required to agree with the shower direction within
in zenith and in azimuth
(the azimuth cut is not used for showers
with zenith angles of ).
These cuts appear reasonable as for core distances below 100 m
high-energy muon tracks are nearly parallel to the shower axis.
It is known from simulations that in the considered range of primary
energy (PeV) and core distances the muon
density (for GeV) very rarely exceeds 1 per m2.
Therefore reconstruction ambiguities are negligible.
High-energy -electrons which are produced to
a small amount in the absorber are eliminated by
calculating the height of the intersection of two nearby tracks.
If they cross inside the central detector,
the track with the larger deviation from the shower
axis is rejected while the other is accepted as a muon only.
About of tracks are rejected by this cut.
The spatial resolution of single tracks is about 1.0 cm,
the angular resolution is .
The number of tracked muons is also corrected for
the reconstruction efficiency which is estimated for each single
data acquisition run (h) separately.
The efficiency was found to be very stable with a mean value of
[10].
The local muon density for each EAS
is defined by divided by the total sensitive
area of the MWPC setup.
Due to the layout of the chambers, depends on the
angle of incidence of the shower and is calculated for each event
individually (m2 for the
selected EAS). Only that area where muons parallel to the
shower axis would penetrate the whole absorber and both chamber
planes, is taken into account for the calculation of the
muon density.
The second detector system is a layer
of 456 plastic scintillation detectors in the third gap of the
calorimeter, called trigger plane [9].
Each detector consists of two square plates of
plastic scintillators (47.547.5cm3)
separated by a wavelength-shifter, which is read out by a
single photomultiplier. Fast electronics records low-energy
(muons) and high-energy deposits (cascading hadrons) and
provides a trigger for the calorimeter and other detector systems.
In the present analysis the trigger plane with an active area
of 208 m2 is used to estimate the local density
of muons with a threshold of 490 MeV for vertical incidence.
The muon density at the trigger plane
is reconstructed in the following way:
To remove signals from cascading hadrons in the absorber an
upper limit of the energy deposit of MeV in each
of the 456 scintillation counters is imposed. Detectors
with larger energy deposits and their immediate neighbours
are not considered for further reconstruction.
For the remaining detectors, the energy deposit
and the sensitive area, both corrected for the
shower direction, are summed up.
The number of reconstructed muons
is then calculated by the sum of the energy deposits divided
by the mean energy deposit of a single muon in the shower.
According to Monte Carlo calculations this mean value
depends slightly on the core distance
( in MeV) and is corrected for.
is the distance in meter of the core
position to the center of the trigger plane (or MWPC)
projected to a plane perpendicular to the
shower axis.
The density is obtained as ratio of
and the sensitive area of the
trigger plane for each individual event
(m2).
The MWPC setup is triggered by
trigger plane and top cluster, but not by the detector array.
But the array, trigger plane and the top cluster
are triggering all other components.
The trigger plane fires if more than 7 detectors have signals
mip or if at least one detector has
MeV (for single hadron detection).
The top cluster triggers if more than 8 (out of 50) detectors
show a signal. An array trigger is activated if
half of the stations of at least one subarray
show an energy deposit (mip).
One of the central detector triggers in conjunction with
the array trigger have to be active to initiate the
event reconstruction.
After some general cuts (core position less than m
from array center, ,
), more than
two million events have been used for the present analysis,
recorded in circa 282 days of measuring time.
Measured fluxes have been corrected by for the dead-time
of the data acquisition system.
3 Local muon density spectra
3.1 All-particle spectra
It is reasonable to assume that at a fixed distance from the shower
axis the local muon densities map the energy of the primary
particles [11] and that muon density
spectra carry information about the primary energy spectra.
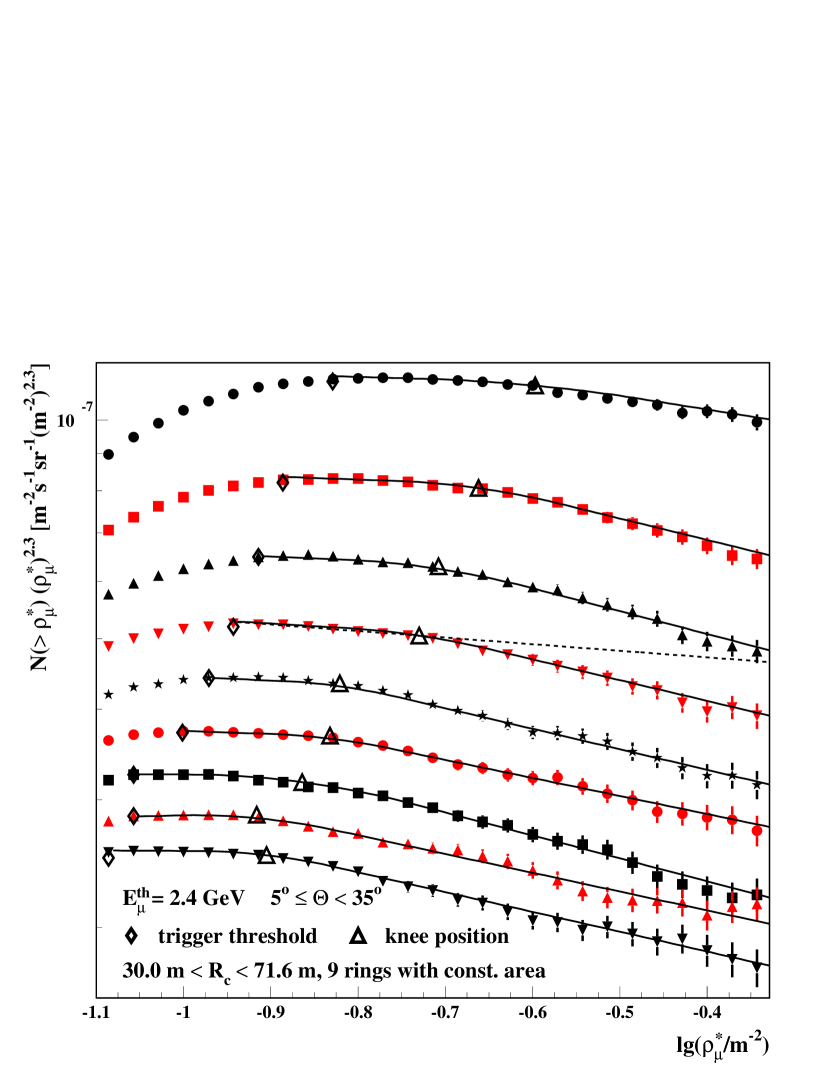
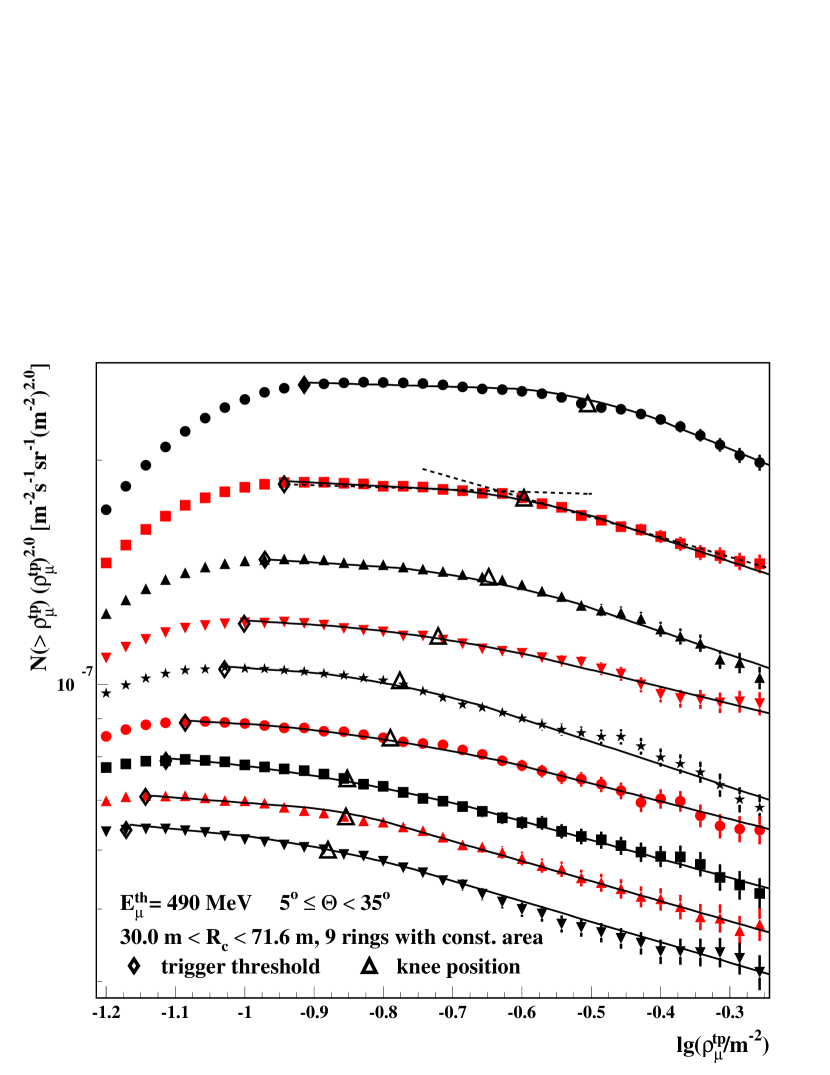
The reconstruction of muon density spectra have been
performed for two energy thresholds and for nine
core distance ranges (Figures 2 and 3).
These ranges are chosen in such a way that
the sampling area are of equal size (1473.4 m2) and large enough
to get reasonable statistical accuracy but retain small systematic
uncertainties due to the extension of the core distance bins.
To suppress punch-through effects of the hadronic or electromagnetic
component, EAS with m are excluded.
EAS with m are excluded, too, because they
can have their core outside the KASCADE
array (m) if they are very inclined.
The -spectra are affected by trigger efficiencies
at low densities. The limitation at high densities are given
by reconstruction uncertainties.
For the MWPC system (higher energy threshold) these uncertainties
begin at a fixed muon density of m-2 due to ambiguities in the track reconstruction and
punch-through effects of cascading hadrons. The hadronic
energy and hadron particle density in EAS are increasing
similarly to the muon density at all core distances [11].
In case of the trigger plane the cut on the deposited energy
(MeV) in each scintillation detector has a systematic
influence on local densities above
m-2.
Here the density will be reduced since the intrinsic density
fluctuations in the EAS together with fluctuations in the energy
deposit lead to detector signals exceeding MeV without
punch-through effects.
Figure 2 and Figure 3 show the
flux spectra for the two muon thresholds in integral form.
The flux values are multiplied by
and ,
respectively.
All spectra show a slight, but significant kink with decreasing
density for increasing core distance.
For the fit procedure the flux
is assumed to follow a power law below and above the knee region.
The following form of the differential spectra is assumed:
The fit procedure estimates the indices of these power laws, the position of the knee (if existing), and the boundaries of the different regions. The values of the boundaries are estimated by the method of finite and dividing differences [12]. Especially the lower thresholds of the spectra, where they begin to deviate from a power law dependence are defined by this method. With increasing core distances these trigger thresholds move to lower muon densities because of the decreasing lateral distribution function. The position of the knee is calculated as the weighted center of gravity of the bins inside the knee region. The fit functions are included in Figures 2 and 3, as well as the particular position of the bending.
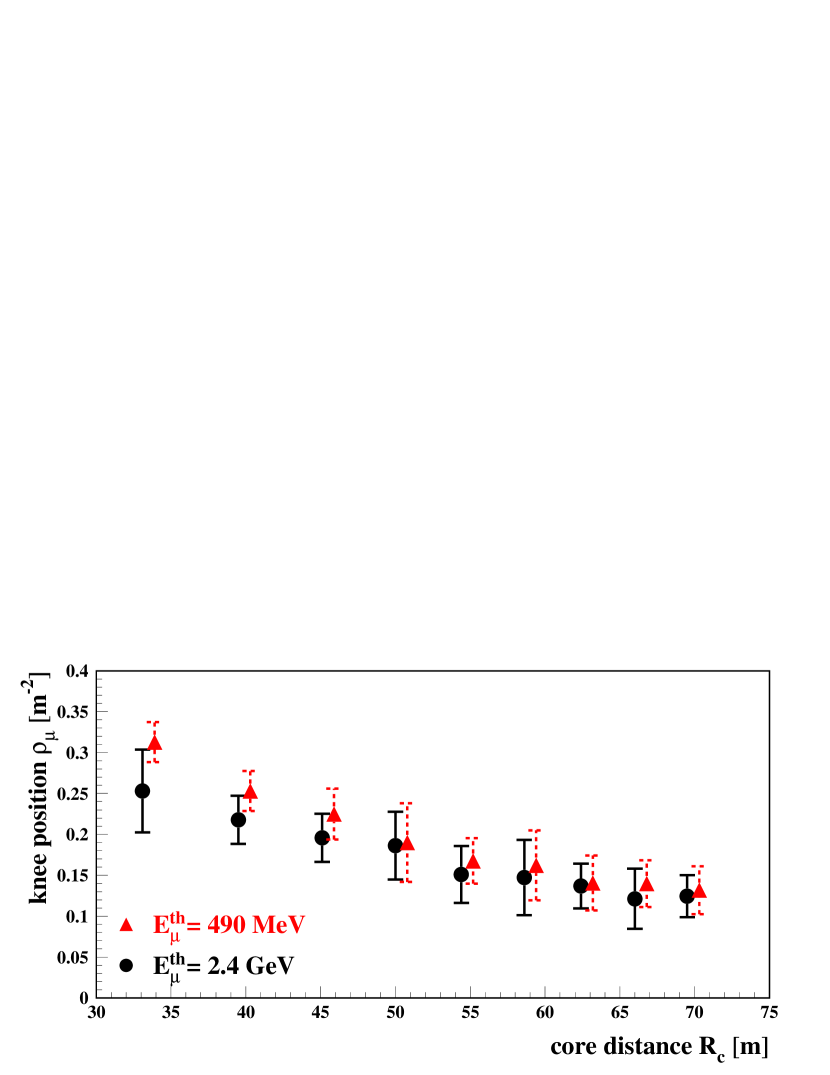
The “width” of the knee region for all spectra amounts to
.
It is a remarkable observation that within the statistical
uncertainty the knee positions for all spectra
occur at the same EAS flux, for both thresholds
and all core distances (at a differential flux of
m-2s-1sr).
Figure 4 displays the knee positions
for all reconstructed spectra. If we assume
that the knee is a feature of the primary energy spectrum,
the data points mark the lateral distribution of muons for two
different energy thresholds for a fixed primary cosmic ray
energy.
This shows that, for the EAS registered, the fraction of muons
between MeV and GeV is small.
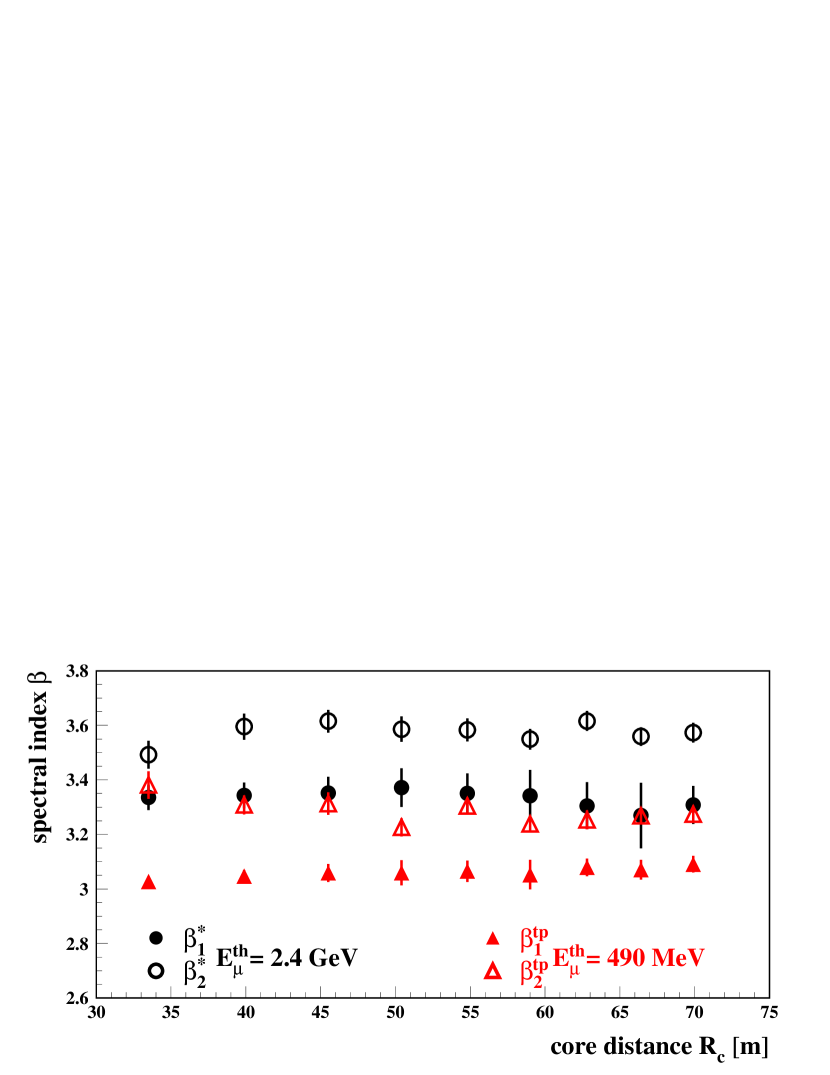
Figure 5 shows the power law indices
of the density spectra.
A higher muon energy threshold results in steeper
spectra. This indicates a comparatively larger increase of the
muon density per primary energy interval with increasing muon
energy threshold.
The spectra for different core distances are almost parallel
leading to nearly constant indices for a given muon energy
threshold. This confirms previous experimental
results [11] of only slight changes of the shape
of the muon lateral distributions with increasing
primary energy (which is different for the
electromagnetic component of EAS).
For both energy thresholds there is a clear difference
in the indices below and above the knee.
Several tests were performed to check the robustness of the
shape of the reconstructed spectra against
experimental uncertainties or systematic features of the analysis.
Differently chosen functional forms for the fit procedure to the
differential spectra result in similar indices of the power laws.
The significance of the knee remains stable (see also dashed
lines in Figure 3).
The assumption of a single power law for the spectra
(e.g. dashed line Figure 2)
leads to reduced -values
of around , whereas the used procedures fit
the data with -values close to one.
In addition, it has been found that effects of the
binning of the density and of the core ranges,
or of the azimuthal distribution of the showers are negligible
and within the statistical uncertainty of the spectra.
Variations of the chosen zenith angle range shift the total
spectrum in slightly, but the form of the spectra
remains stable. This is reasonable, because differently
inclined showers (of the same primary energy) generate slightly
different numbers of muons, while the variation of the density
with energy does not change.
3.2 Spectra of EAS subsamples
The ratio of the muon to electron content of EAS is traditionally considered as a mass-sensitive observable [13, 14], since heavy ion induced EAS tend to have a large ratio due to the faster development of the electromagnetic component in the atmosphere. The shower sizes and have been reconstructed for each individual event from the data of the array stations and the EAS have been classified according to the ratio and then


divided in “electron-rich” and “electron-poor”.
The shower sizes are converted to the sizes of vertical showers
to eliminate the influence of the different zenith angles:
where , , and are the reconstructed
quantities of the EAS, and g/cm2 is the
observation level.
The quantities and denote
the absorption lengths of the electron and muon components
in the atmosphere.
The values were obtained from
Monte Carlo simulations and parameterised as
g/cm2
and .
Especially the electron number depends significantly
on the zenith angle due to the rapidly increasing atmospheric
absorption.
The separation of the total sample of EAS in
“electron-rich” and “electron-poor” showers
is performed by a cut in the ratio
.
This value is optimized by Monte Carlo calculations
(see section 4.1).
The classification is done independently using
the local muon densities at the central detector.
For both subsamples the spectra are
deduced in the same way as the “all-particle” spectra.
As example Figure 6 shows
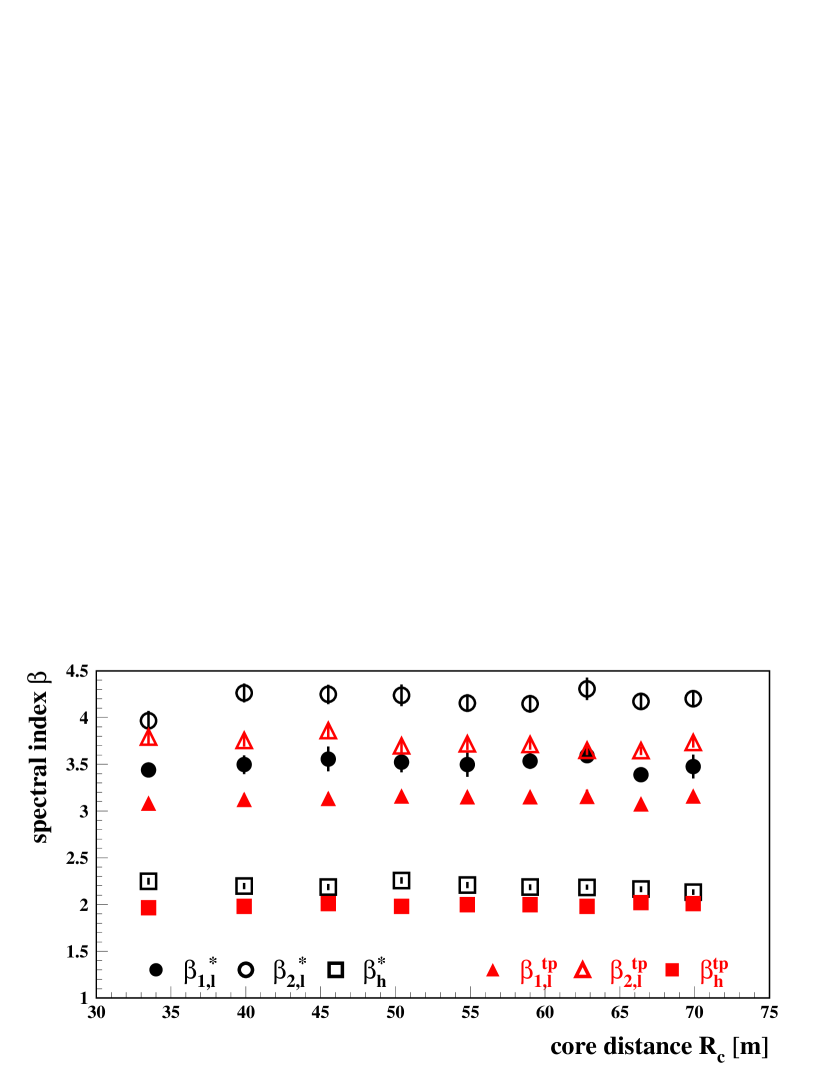
the reconstructed local muon density spectra for m for all, for the electron-rich (predominantly light ion induced), and for the electron-poor (predominantly heavy ion induced) showers. The general features of the spectra are similar for all core distance ranges; the component of electron-rich EAS dominates the flux below the knee while it strongly decreases after the kink. No knee is seen in the component of electron-poor EAS, and the spectra can be described by a single power law. The resulting slopes of the spectra, especially the differences of the slope-values for the two thresholds and subsamples, are very similar for the various core distances as shown in Figure 7. Whereas the assumed fit functions describe the all-particle spectra well, the spectra for the electron-rich EAS are not well described by power laws above the knee. Also for the electron-poor sample slight deviations from a pure power law dependence at the high energy end are observed. This holds for all radial ranges. An energy dependent separation efficiency of the primary masses as well as astrophysical sources (composition, acceleration, propagation) can cause these deviations from simple power law dependencies.
4 Comparisons with simulations
4.1 Air-shower simulations
For the interpretation of the measured muon density spectra in terms of the primary energy spectrum a-priori knowledge inferred from Monte Carlo simulations of the air-shower development is necessary. The present analysis is based on CORSIKA simulations (version 5.62) [15] and a full and detailed simulation of the detector response. The simulations have been performed using the interaction model QGSJET [16] for the high-energy interactions and GHEISHA [17] for interactions below GeV and subsequent decays. The electromagnetic part of the showers is treated by EGS4 [18]. Observation level, earth’s magnetic field, and the particle thresholds are chosen in accordance with the experimental situation of KASCADE. The U.S. standard atmosphere [15] was adopted. The simulations cover the energy range of – eV divided into 7 overlapping energy bins with a spectral index of . For each bin 200 showers are simulated except for the two highest energy ranges where only 100 and 50 showers were generated, respectively. The calculations are performed for three zenith angular ranges (, , ) and for three primary masses: protons, oxygen and iron nuclei. The response of KASCADE is simulated by a detailed detector simulation program based on the GEANT [19] package. Each generated shower is passed ten times through the detector simulation. The shower cores are randomly distributed over the KASCADE array within a circular area of m radius around the center. Hence, a total statistics of 103,500 EAS is used. The output of the simulations is analyzed by the same procedures
as applied to the measured data, reducing systematic uncertainties.
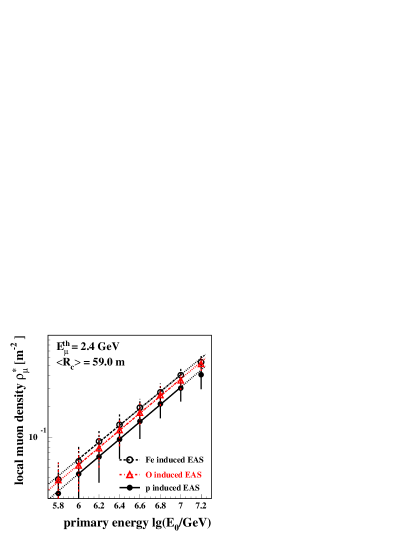
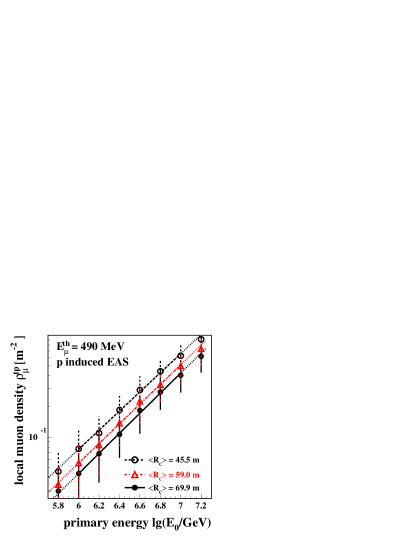
Figure 8 displays examples of
as a function of
for different muon thresholds, core distances, and primary masses.
The selection cuts have been applied as to the measured data.
The error bars indicate the width of the distributions.
They decrease with increasing energy and mass.
A power law dependence is fitted in a restricted
energy range to reduce
the influence of showers with primary energies outside the
simulation range.
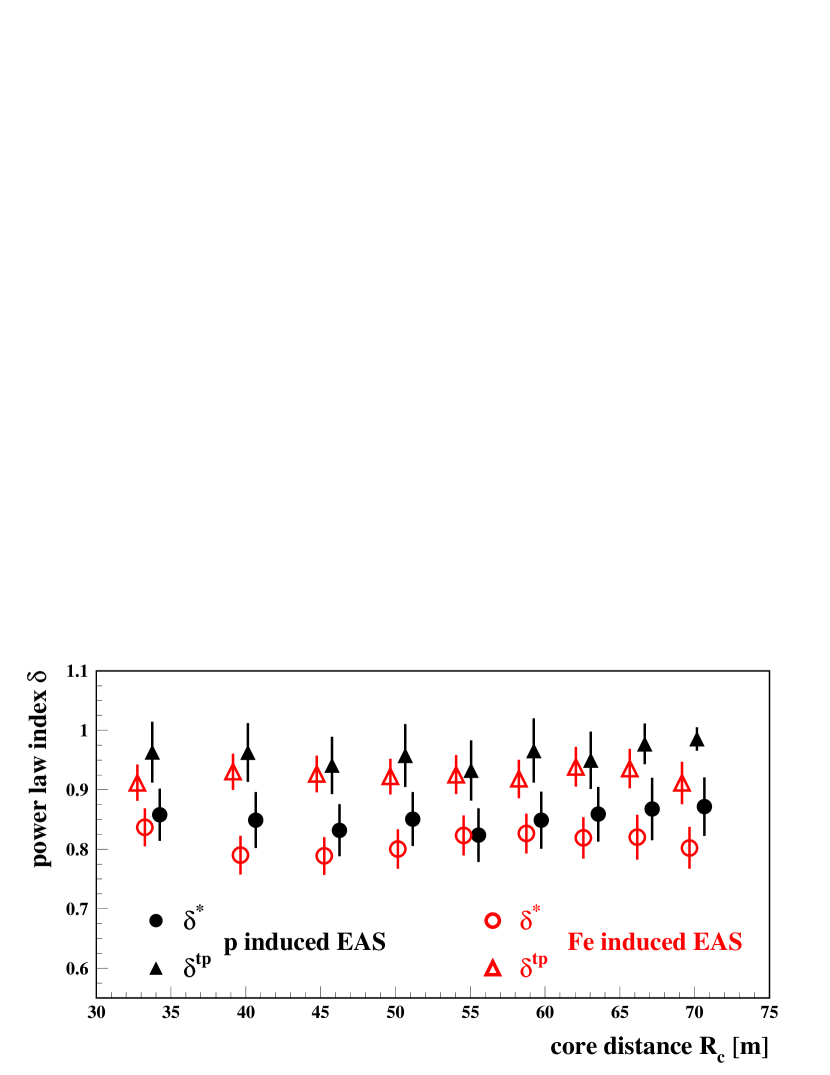
Figure 9 shows the resulting power law
indices for all core distances


in case of primary protons and iron nuclei.
The slopes are nearly independent of the radial distance,
confirming the weak dependence of the shape of the muon lateral
distribution with primary energy [11].
But the slopes depend on muon threshold and primary mass.
Systematic uncertainties are at the 10%
level and indicated in Figure 9.
These systematics are estimated by varying the energy and angular
spectrum of the simulated events, as well as modifying the degree
of fluctuation of the observables resulting from the simulations.
The uncertainty of the high-energy
interaction model itself is tested with a set of simulations based
on the VENUS high-energy interaction model [20].
The slope of the -dependence
differs systematically by for both
energy thresholds, but this systematics is not included
in the error bars in Figure 9.
The detailed simulations allow also to verify that the
cut on the shower size ratio
is energy independent.
The distribution of for the
measured events, and the quality of the mass
separation as provided by the simulation calculations
are shown in Figure 10. To divide
the total sample in electron-rich and electron-poor EAS
a cut of is chosen.
By this most of the proton induced showers belong to the
“electron-rich” class, whereas primary
iron and medium nuclei are associated to the “electron-poor”
class. Obviously the classification is nearly energy
independent (Figure 10 right).
Also, the qualitative behavior of the electron-poor and
electron-rich distributions was found to be insensitive
to small changes of .
4.2 Features of the energy spectra
When relating the density spectra to the primary energy spectrum of cosmic rays a power law spectrum is assumed. The energy spectrum can be written as , where has to be deduced from the EAS simulations and is taken from the experimental results. Thus the spectral index can be expressed by with from the simulations (, see Figure 9). If the correct elemental composition is adopted, all measured muon density spectra (of the total sample or of a certain subsample) should result consistently in the true primary energy spectrum, irrespective which core distance and muon energy threshold are considered. Hence by use of the results of various core distance ranges and different muon energy thresholds systematic effects induced by the Monte Carlo simulations could be checked. E. g., a possible

dependence of the slopes and of the knee position on
core distance would indicate an insufficient
description of the muon lateral distribution by the simulations
while a comparison of the spectra observed with different
muon energy thresholds could reveal inconsistencies of the
simulated muon energy spectrum.
As an example, Figure 11 shows the variation of the
resulting exponents of the primary all-particle
spectrum below the knee derived for both muon energy
thresholds under the assumption that the primaries are protons.
The smaller fluctuations in with
increasing atomic number result in a decrease of the spectral
index of the resulting primary energy spectrum for the assumption
of a heavier composition.
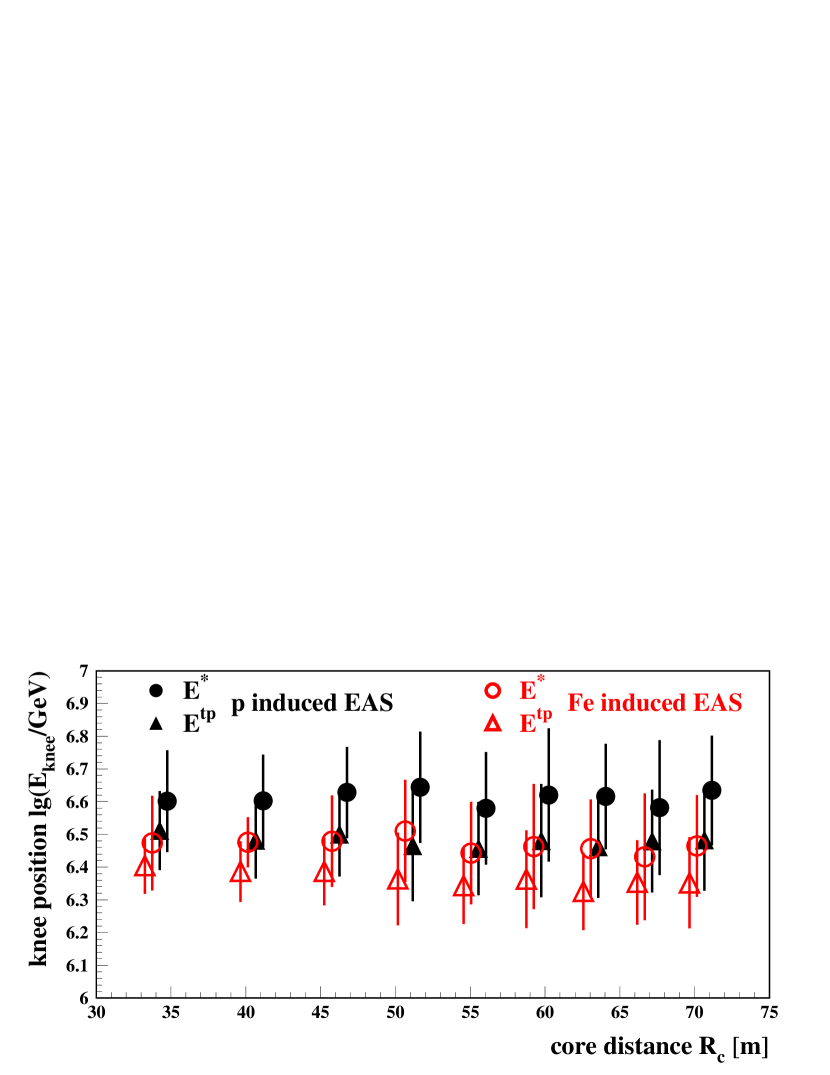
Figure 12 compares the knee positions determined
under the assumptions of proton primaries with the results found
for the case assuming iron primaries.
The knee positions resulting from iron nuclei as primaries are
systematically shifted to smaller energies as compared to a
pure proton composition. This is due to the fact that the
| all-particle spectrum | |||
|---|---|---|---|
| for primary proton | for primary oxygen | for primary iron | |
| 2.68 | 2.66 | 2.51 | |
| 2.89 | 2.85 | 2.71 | |
| lgGeV) | 6.61 | 6.53 | 6.47 |
| (10.4 ) | (12.5 ) | (13.9 ) | |
| 2.89 | 2.96 | 2.75 | |
| 3.11 | 3.18 | 2.96 | |
| lgGeV) | 6.48 | 6.43 | 6.37 |
| (3.0 ) | (2.3 ) | (3.7 ) | |
| electron-rich sample | electron-poor sample | |
| for primary proton | for primary iron | |
| 2.83 | 2.40 | |
| 3.41 | ||
| lgGeV) | 6.70 | |
| 2.97 | 2.69 | |
| 3.53 | ||
| lgGeV) | 6.53 |
local muon density is increasing with the primary mass
(see Figure 8 left).
The density spectra for the different
core distances are independent of each other
and the resulting slopes and knee positions of the primary
energy spectrum agree within their statistical uncertainties.
This supports the confidence in the lateral distribution
predicted by the Monte Carlo simulations, and allows
to present results averaged over all core distance bins
(Table 1).
Nevertheless there remain obvious systematic differences in
the results for the two muon energy thresholds, observed for
all core distances.
The systematic differences might arise from possibly incorrect
assumptions on mass composition due to the sensitivity of the muon
spectrum to primary mass.
Such an effect, however, should be considerably reduced when
analysing the electron-rich and electron-poor subsamples which
should be enriched in light and heavy primaries, respectively.
For these samples no variation with core distance is again
observed, and Table 1 presents
average values. But the systematic differences for the two
thresholds remain.
In order to check the influence of heavier contributions
the electron-rich EAS sample has been additionally analyzed
assuming larger fractions of helium and even oxygen
primaries. A flattening of the spectra and a shift of the knee
position to lower energies occurs by up to 5% (with the extreme
assumption of 100% oxygen). When assuming a pure oxygen
composition for the electron-poor sample the primary spectrum
steepens by . Such effects do not
explain the systematic discrepancy displayed by the results
from the two different muon energy thresholds.
Therefore we conclude that an incorrect description of the
muon energy spectrum by the Monte Carlo simulations is the
origin of the discrepancy.
The effect does not only occur for the QGSJet model used for
the present analysis. A smaller sample of reference showers
generated with the VENUS model has been used to study the
observed difference. A general shift to a steeper primary
energy spectrum () and a
lower knee position is found.
That may be associated to differences in the modelling of
the high-energy interaction [7].
However, the inconsistency with respect to the two different
muon energy thresholds persists.
The considered muon energies are comparatively low, and are
treated in the CORSIKA simulation
code mainly by the low-energy interaction model GHEISHA.
Thus the inconsistencies are most probably due to the
low-energy model.
There are in fact indications for deficiencies of the code
from another study [21].
5 Summary and conclusions
Frequency spectra of local muon densities of EAS
in the PeV region were measured and analyzed for various
core distances and for two muon energy thresholds.
For both thresholds the all-particle spectra show the knee
structure, i.e. two power laws with increasing steepness
in the knee region.
Compared to shower size spectra
based on the charged particle or electron
number [22, 23], the
muon density spectra show a relatively smooth knee with
a small, but clear change of the power law exponent.
With help of the muon to electron number ratio, estimated
on an event-by-event basis, the registered EAS are divided into
electron-rich and electron-poor subsamples.
The subsample of the electron-rich EAS shows the same knee features
as the total sample but with a more pronounced knee.
The electron-poor sample shows no change
of slope within the density range investigated.
An identical feature has also been observed
in combined energy and composition analyses of
size spectra measured by KASCADE [24] albeit then
based on Monte Carlo simulations.
Simulations indicate that electron-rich showers originate
from light primary nuclei.
This feature holds irrespectively of details of the
interaction models.
Hence we conclude that the knee reflects a feature of the light
particle spectrum and that the spectrum of heavy particles
does not change slope in the range of our measurements.
Such a behaviour is expected if the knee
is caused either by interstellar magnetic fields or a change of the
interaction in the atmosphere since in these cases the knee of nuclei
should be displaced by a factor of Z or A, respectively, to that
of protons.
Detailed EAS and detector simulations were used to interpret
the measured muon density spectra in terms of the primary
energy spectrum.
Independent of the elemental composition assumed all measured spectra
should result in the same primary energy spectrum, irrespectively of
core distance or muon threshold.
However, only when assuming the true composition the derived energy
spectrum will be the correct one.
This agreement for different spectra actually is observed
for varying core distances.
Hence we conclude that the muon lateral distribution
is sufficiently well represented by the simulations.
In contrast, the results for the two energy thresholds lead
to different exponents and positions of the kinks.
These differences are larger than the systematic uncertainties
due to the unknown composition, especially in the case of
the subsamples.
Thus, the measurements presented here reveal that the Monte Carlo
simulations are not capable to describe the muon energy distribution
correctly.
Such indications arise also from studies of the muon lateral
distributions for different muon energy thresholds with
KASCADE [25].
In view of these systematic discrepancies,
it is difficult to draw definite conclusions
but some general features of
the primary energy spectrum can be stated:
The all-particle energy spectrum exhibits a knee
at eV
with a change of the spectral index of order
.
This knee is only seen in the light ion subsample, at the same
position but with a distinctly larger steepening of
.
The heavy ion component of the cosmic ray flux displays no
steepening in the energy range of 1–10 PeV and a smaller slope
than the light component below the knee.
Within the uncertainties the findings about the all-particle
spectrum are compatible with recent results from
KASCADE [7] and other
experiments [4, 5, 6].
From the experimental point of view the study of muon density
spectra establishes a new approach to investigate the energy
spectrum of cosmic rays.
Although the statistical accuracy is limited
the measured spectra reflect the features
of the primary energy spectrum in an astonishingly direct manner.
But considerable inconsistencies arise when attempting to convert
the measured muon density spectra into the primary energy spectrum
based on simulations.
It is only due to multiparameter measurements of experiments
such as KASCADE that the deficiencies of the simulations get
revealed.
Thus improvements of the hadronic interaction models
incorporated in the simulations appear to
be the most important prerequisite for a consistent
interpretation of the data in
terms of elemental composition and energy spectrum of primary
cosmic rays in the knee region.
Acknowledgments
The authors would like to thank the members of the engineering and technical staff of the KASCADE collaboration who contributed to the success of the experiment with enthusiasm and commitment. The work has been supported by the Ministery for Research of the Federal Government of Germany, by a grant of the Romanian National Agency for Science, Research and Technology as well as by a research grant (No. 94964) of the Armenian Government and by the ISTC project A116. The collaborating group of the Cosmic Ray Division of the Soltan Institute of Nuclear Studies in Lodz and of the University of Lodz is supported by the Polish State Committee for Scientific Research. The KASCADE collaboration work is embedded in the frame of scientific-technical cooperation (WTZ) projects between Germany and Armenia (No. 002-98), Poland (No.POL-99/005), and Romania (No.RUM-014-97).
References
- [1] B. Wiebel-Sooth, P. L. Biermann, and H. Meyer, Astron. Astrophys. 330 (1998) 389.
- [2] N. N. Kalmykov and G. B. Khristiansen, J. Phys. G: Nucl. Part. Phys. 21 (1995) 1279.
- [3] G. V. Kulikov and G. B. Khristiansen, Soviet Physics JETP 35(8) (1959) 441.
- [4] M. A. K. Glasmacher et al., Astroparticle Physics 10 (1999) 291.
- [5] K. Asakimori et al., Proc. 23th ICRC, Calgary, Vol. 2, p. 25, 1993.
- [6] M. Nagano et al., J. Phys. G: Nucl. Phys. 10 (1984) 1295.
- [7] T. Antoni et al. - KASCADE collaboration, A Non-Parametric Approach to Infer the Energy Spectrum and the Mass Composition of Cosmic Rays, Astroparticle Physics (2001) in press.
- [8] H. O. Klages et al., Nucl. Phys. B, Proc. Suppl. 52B (1997) 92.
- [9] J. Engler et al., Nucl. Instr. and Meth. A 427 (1999) 528.
- [10] H. Bozdog et al., The detector system for measurement of multiple cosmic muons in the central detector of KASCADE, Nucl. Instr. and Meth. A (2001) in press.
- [11] T. Antoni et al. - KASCADE collaboration, Astroparticle Physics 14 (2001) 245.
- [12] S. H. Sokhoyan et al., Proc. of the Workshop ANI 98, eds. A.A. Chilingarian, H.Rebel, M.Roth, M.Z. Zazyan, Report FZKA 6215, Forschungszentrum Karlsruhe, p. 55, 1998.
- [13] P. R. Blake and W. F. Nash, J. Phys. G: Nucl. Part. Phys. 24 (1998) 217.
- [14] T. Antoni et al. - KASCADE collaboration, Nucl. Phys. B, Proc. Suppl. 75A (1999) 234.
- [15] D. Heck et al., Report FZKA 6019, Forschungszentrum Karlsruhe, 1998.
- [16] N. N. Kalmykov, S. S. Ostapchenko, and A. I. Pavlov, Nucl. Phys. B, Proc. Suppl. 52B (1997) 17.
- [17] H. Fesefeldt, Report PITHA-85/02, RWTH Aachen, 1985.
- [18] W. R. Nelson, H. Hirayama, and D. W. O. Rogers, Report SLAC 265, Stanford Linear Accelerator Center, 1985.
- [19] Application Software Group, GEANT - Detector Description and Simulation Tool, 1993, CERN Long Writeups W5015.
- [20] K. Werner, Physics Reports 232 (1993) 87.
- [21] J. Wentz et al., Proc. 26th ICRC, Salt Lake City, Vol. 2, p. 92, 1999.
- [22] M. Aglietta et al., Astroparticle Physics 10 (1999) 1.
- [23] R. Glasstetter et al. - KASCADE collaboration, Nucl. Phys. B, Proc. Suppl. 75A (1999) 238.
- [24] K-H. Kampert et al. - KASCADE collaboration, Proc. 26th ICRC, Salt Lake City, Vol. 3, p. 159, 1999.
- [25] A. Haungs et al. - KASCADE collaboration, Report FZKA 6263, Forschungszentrum Karlsruhe, 1999.