Keck Adaptive Optics Observations of the Radio Galaxy 3C294:
A Merging System at ?
Abstract
We present seeing-limited and adaptive optics (AO) images of the radio galaxy 3C294 in the and infrared bands obtained at Keck Observatory. The infrared emission of 3C294 is dominated by two distinct components separated by (9 kpc). The eastern knot contains an unresolved core that contributes of the -band light; we identify this core with the active nucleus. The western component is about 2.5 times brighter. The most plausible interpretation of the near-infrared morphology is an ongoing merger event, with the active nucleus located in the less massive of the two galaxies.
1 Introduction
Powerful radio galaxies offer a unique way to investigate the evolution of very massive galaxies over a large range in redshift. The near-infrared Hubble relation is well represented by models of passive evolution of massive () galaxies which formed at high redshifts (Lilly 1988, van Breugel et al. 1999). Comparison with high-redshift field galaxies (Cowie 1997) confirms that radio galaxies form indeed the high-luminosity envelope. Deep spectroscopic observations of a few relatively weak radio sources, in which the active nuclei do not dominate the restframe UV radiation, have shown directly that radio galaxies at have old ( Gyr) stellar populations, which must have formed at (Spinrad et al. 1997).
Radio galaxy morphologies, when imaged at visible wavelengths, often show spectacular clumpy structures aligned with the axis of the radio source. This “alignment effect” appears to be at odds with the tightness of the near-infrared relation and the passive evolution inferred from the diagram. Its exact nature has remained unclear and evidence has been found for scattered light from hidden quasar-like active nuclei, for nebular recombination continuum, and even for jet-induced star formation (McCarthy 1993).
To investigate the morphological evolution of massive elliptical galaxies with redshift it is therefore important to obtain high spatial resolution at infrared wavelengths, where the AGN-related emission is fainter and the old stellar component brighter. Recent -band observations with NICMOS/HST have shown that at most galaxy morphologies appear rounder, more symmetric and centrally concentrated than at shorter wavelengths, although even at restframe R-band wavelengths some of the complex aligned structures can still be seen (Zirm et al. 1999). After subtracting these aligned structures and modeling the symmetric galaxy components, the galaxy surface brightness profiles show power laws, consistent with the relaxed morphological appearances. In several cases the images also show that the near-IR surface brightness peaks at local minima in WFPC2 optical images, suggesting the presence of central dust lanes or disks. Some objects exhibit relatively bright nuclear point sources in the near-IR, possibly showing obscured quasar-like AGN.
NICMOS/HST observations of radio galaxies at generally reveal much more complex structures than for their lower redshift counterparts (Pentericci et al. 1999, McCarthy 1999). These sources have more often strong nuclear point sources, show nearly always complex and asymmetric morphologies, and exhibit the alignment effect. This is in part because the observations of these higher redshift objects are necessarily at shorter restframe wavelengths, but also because of strong morphological evolution. -band images of high-redshift radio galaxies obtained with the NIRC camera at Keck Observatory in to seeing have also shown dramatic evidence for this, with multiple components which are often aligned with their radio sources at , to more symmetric and compact morphologies at (van Breugel et al. 1998). Such morphological evolution, from clumpy (but not necessarily aligned) to more symmetric and relaxed structures, would be expected in hierarchical galaxy formation scenarios. It is thus clear that near-IR observations at high resolution can substantially contribute to our understanding of the structures, evolution, and environments of radio galaxies.
3C294 is a powerful radio galaxy at ; a VLA image at cm shows a Z-shaped structure with a relatively weak core (McCarthy et al. 1990). The galaxy is associated with a large cloud of ionized gas radiating in Lyman and other emission lines. The cloud is aligned with the inner part of the radio structure, and extends over (McCarthy et al. 1990). At the redshift of 3C294, 1′′ corresponds to 9.1 kpc for km s-1 Mpc-1, , ; the linear extent of the Lyman cloud is thus kpc.
A bright () star is projected west of the radio galaxy core. 3C294 is thus an ideal target for observations with present-day adaptive optics (AO) systems, which require a bright natural reference star near the target source. Previous AO observations of 3C294 have been carried out in the band with the Hokupa’a system mounted on the 3.6 m Canada-France-Hawaii Telescope (Stockton et al. 1999). The galaxy was clearly resolved in these observations, but the core could not be identified unambiguously. The overall morphology appeared triangular, and was interpreted by Stockton et al. (1999) as an illumination cone due to dust scattering from a quasar nucleus.
Here we present new seeing-limited and AO observations of 3C294 in the and near-IR bands obtained at Keck Observatory. The greater sensitivity and resolution afforded by a 10 m aperture gives substantially improved morphological information, which results in an improved understanding of the origin of the emission, and of the evolutionary state of 3C294.
2 Observations and Data Reduction
2.1 NIRC Observations
Direct infrared images of 3C294 were obtained on June 25, 2000 (UT date) with the NIRC camera on the Keck I telescope. NIRC’s detector is a pixel InSb array; the field-of-view is with a sampling of per pixel (Matthews & Soifer 1994). We used an exposure time of 10 s to avoid saturation by the bright star west of 3C294, and observed at a parallactic angle at which the radio galaxy is well separated from the diffraction spikes caused by the support structure of the secondary mirror of the telescope (see Figure 1). We collected 54 frames each in the infrared and bands, giving total on-source integration times of 9 minutes in each band. The source was dithered on the detector in a nine-point pattern to allow for easy sky correction and elimination of bad pixels. The UKIRT faint standard star FS23 was observed immediately before 3C294. The seeing was fairly good ( to ), but the observations were affected by cirrus and are not photometric.
Standard infrared data reduction techniques were applied to the data. The sky emission in each pixel was determined from the median of the nine images in each dither pattern and subtracted before the nine images were centered and co-added. The resulting mosaic images were added and divided by a flat field obtained on the sky during twilight.
2.2 Adaptive Optics Observations
High-resolution infrared observations of 3C294 were carried out on June 24, 2000 (UT date). We used the adaptive optics system mounted on the Keck II telescope, which uses a Shack-Hartmann sensor and a fast low-noise CCD camera for wavefront sensing, and a Xinetics mirror with 349 actuators for wavefront correction (see Wizinowich et al. 2000). The star west of 3C294 was used as wavefront reference for the AO system. Infrared images were obtained with the slit viewing camera (SCAM) of the NIRSPEC spectrograph (McLean et al. 2000). SCAM employs a pixel Picnic HgCdTe array; the pixel scale for observations in conjunction with the AO system is /pixel, giving a field-of-view of . Since this field is too small to observe 3C294 and the guide star simultaneously, we periodically moved back to the guide star to assess the AO system performance by measuring its Strehl ratio.
The exposure times were 300 s for 3C294, and 2 s for the guide star; a five-point dither pattern with a step size of was used in both cases. The dithering and switching between 3C294 and the guide star was done by moving the telescope on the sky, and performing compensating changes in the position of a motorized field steering mirror located behind the visible/IR beam splitter in the wavefront sensor arm of the optics. We obtained 20 individual images of 3C294 in and 15 images in , i.e., the total on-source integration times were 100 and 75 minutes, respectively. The UKIRT faint standard star FS29 was observed after 3C294. The seeing was good () and the sky clear. Under these conditions, the AO system produced images with diffraction-limited cores () and a Strehl ratio of in on reference stars.
The data reduction was done essentially in the same way as for the NIRC data. A slight complication arose from the fact that we were using the slit viewing camera of a spectrograph. Since no closed position of the slit mechanism was provided, we used the narrowest slit available (), and masked the corresponding area in the center of the chip in the data reduction. This was not a major problem because of the dither pattern, which ensured that each sky position fell onto a valid area of the chip in at least four out of five exposures.
Since the bright star was not in the field-of-view of the observations of 3C294, and the radio galaxy was not detected with sufficient signal-to-noise in the individual exposures, the registration of the 20 frames had to be done “blindly”. The AO system keeps the guide star at a fixed position on the wavefront sensor camera, and the offset of the SCAM detector with respect to the wavefront sensor can be derived from the information about the position of the field steering mirror in the FITS headers. A correction has to be applied for differential refraction between the effective wavelength of the wavefront sensor camera ( nm) and the band.
3 Results
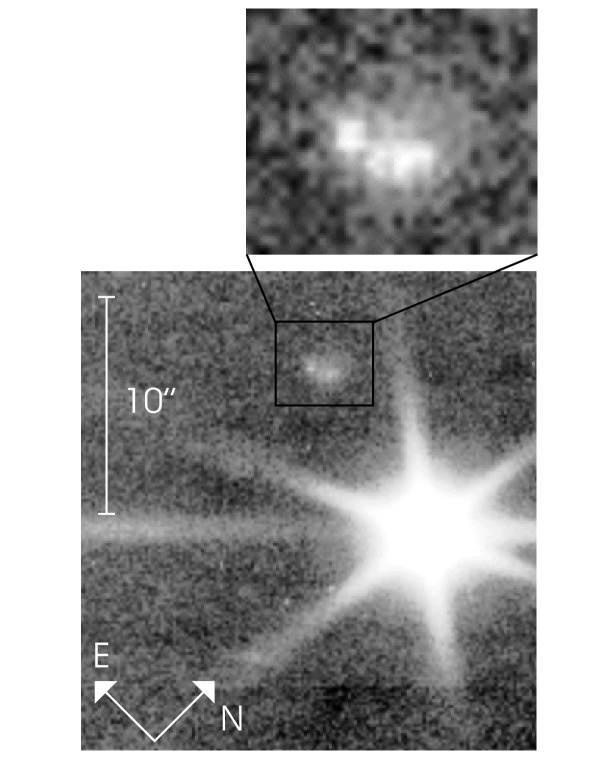
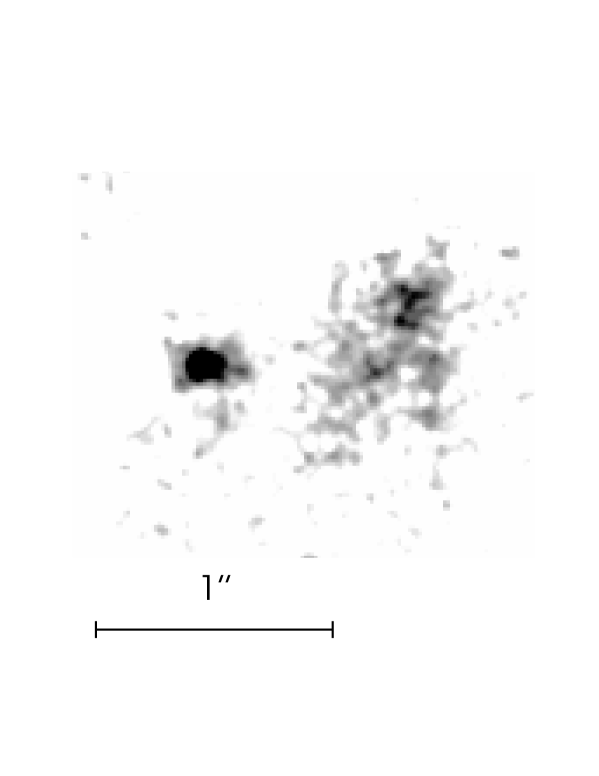
The final NIRC -band and AO -band images of 3C294 are shown in Fig. 1 and 2, respectively. Note that no deconvolution has been applied in either case. Two bright components separated by are apparent in both images; the NIRC image also shows faint diffuse emission. The AO image shows that the eastern component (the “core”) is much more compact than the western component. The NIRC -band and AO -band images are very similar to the images shown, but have slightly poorer signal-to-noise.
Adopting , for FS23 and , for FS29, we derive , for the integrated emission of 3C294, and , for the core. We estimate photometric errors of at least mag due to the non-photometric conditions, but our measurements are in excellent agreement with previous results (, McCarthy et al. 1990; , Stockton et al. 1999). A comparison of the photometric data from NIRC and AO gives the interesting result that only % of the flux and % of the emission come from the “core”.
The width of the core can be determined by comparing the AO image of 3C294 to the exposures of the guide star. The guide star is a double star with 1:1.6 intensity ratio and separation (at the time of our observations). It is thus well resolved in our AO data, and it is easy to obtain radial profiles for both components separately, i.e., the duplicity is not a problem. It is necessary, however, to check the quality of the registration of the 20 individual exposures that were stacked to obtain Fig. 2. We performed this test by building similar mosaics composed of exposures of the guide stars. We first stacked guide star exposures in the same way as we did for 3C294, i.e., by using the information about the position of the field steering mirror in the FITS headers to register the individual frames. The resulting mosaic image had a FWHM of 2.78 pixels, corresponding to . We then stacked the same frames by computing cross-correlations between the individual exposures; the mosaic constructed in this way had a FWHM of 2.79 pixels or , identical to within the errors to the first. We conclude that “blind” stacking based on the field steering mirror positions did not have a measurable effect on the FWHM of the resulting mosaic.
The FWHM of the eastern component of 3C294 was measured to be 3.38 pixels, i.e., . Quadratic subtraction of the FWHM of the guide star gives a formal size of . We also compared radial profiles of the eastern component with profiles of the guide star that had been convolved with Gaussians of varying widths. From these comparisons we derive a conservative upper limit of for the FWHM of the core of 3C294. It should be noted that these measurements are still consistent with the core being unresolved, since angular anisoplanatism, the fairly low signal-to-noise ratio in Fig. 2, or an underlying emission from a larger stellar component could all contribute to an apparent broadening of the core compared to the guide star.
An important question concerns the registration of the infrared emission with respect to the radio structure. We can measure the position of the infrared core (which can clearly be identified in Fig. 1) with respect to the guide star from the NIRC data; it is east and north of the star, with an estimated error of about . Performing the same measurement with the AO data is more complicated, since we have to rely on the calibration of the field steering mirror (which we checked and found to be better than 1%), and because the two components of the guide star are resolved. The offset between the -band core and the center-of-light of the two components of the guide star determined from the AO observations is east and north, in excellent agreement with the NIRC value. In the following we will use the result of the more straightforward NIRC measurement.
The guide star is star U1200-07227692 in the USNO-A2.0 catalog (Monet et al. 1998). Several attempts have been made to determine the position of this star, with results disagreeing among each other by (Véron 1966, Kristian et al. 1974, Riley et al. 1980, Stockton et al. 1999). We believe that the best estimate is the USNO-A2.0 catalog position 14h06m4332, +34∘11′235 (J2000 on the ICRS reference frame), derived directly from a solution of the Schmidt plates on which USNO-A2.0 is based. The typical error of the catalog is . Combining this position with the offset determined above, the position of the infrared core of 3C294 is found to be 14h06m4409, +34∘11′250. The position of the radio core in the ICRS frame is 14h06m4408, +34∘11′250 (McCarthy et al. 1990, Stockton et al. 1999). The almost perfect agreement between the positions of the infrared and radio cores may be somewhat fortuitous in view of the slightly discrepant positions of the guide star in the literature. Nevertheless, the positional agreement, as well as the pointlike appearance of the infrared core, strongly suggest the identification of this component with the active nucleus.
4 Discussion
Our seeing-limited and adaptive optics images of 3C294 are the first to show sufficient detail for a comprehensive interpretation of the nature of the near-infrared emission of this galaxy. Most notably, we detect two clearly distinct knots separated by (9 kpc) in the east-west direction, i.e., nearly perpendicular to the radio axis. The eastern knot contains an unresolved (or barely resolved) core, which we identify with the active nucleus.
Our AO image is in general agreement with the one obtained by Stockton et al. (1999) from their Hokupa’a AO observations. However, because of our higher quality data, we can now clearly identify the nucleus, which appears offset by to the east from the main body of the galaxy. This leads us to a different conclusion from Stockton et al. (1999), who suggested that the morphology of 3C294 might be due to scattered light from a hidden quasar-like nucleus, located near the southern tip of the -band emission. From our new images it appears much more plausible to ascribe the bulk of the near-IR emission to an old stellar population, with a contribution by the active nucleus.
The near-IR color of 3C294 is typical for galaxies at redshift . The -band K-correction is relatively small and does not depend strongly on redshift or type of galaxy (e.g., Cowie et al. 1994); assuming we obtain for 3C294. Comparing this value to (Mobasher et al. 1993), we derive . With the “standard” mass-to-light-ratio , the total mass of 3C294 is then estimated to be . McCarthy et al. (1990) have used spatially resolved observations of the Lyman line to derive a dynamical estimate of enclosed within 60 kpc, but newer data (McCarthy et al. 1996) bring this estimate up to within 90 kpc, which would imply . These dynamical mass estimate rest on somewhat shaky ground, however, since it is not clear at all that the emission line kinematics in 3CR galaxies reflect the underlying gravitational fields (Baum & McCarthy 2000), and the distorted structure apparent in our near-IR images of 3C294 may cast further doubts on the applicability of simple virial arguments.
The near-infrared morphology of 3C294 revealed by our Keck images is indicative of an ongoing merger event, consistent with the expectation from hierarchical models of structure formation. These models predict that many present-day massive galaxies have merged with a galaxy of nearly equal mass at (Kauffmann & White 1993). It is tempting to speculate that the galaxy-galaxy interaction may have triggered the radio activity, and that it may be responsible for the distortion (Z-shape) of the radio structure. Assuming an advance speed of the radio hot spots of km s-1 (McCarthy et al. 1990), the age of the radio source is of order yr. This is to be compared with the dynamical time scale of the merger, which is yr. The order-of-magnitude difference in the two time scales may indicate that it takes some time for the gas to settle around the black hole, after which the accretion proceeds on a shorter time scale. The radio and infrared morphologies of 3C294 appear therefore consistent with a scenario in which supermassive black holes grow through major merger events, in which the gas is accreted on a relatively short time scale, about yr (Kauffmann & Haehnelt 2000).
It is interesting to note that the active nucleus seems to be associated with the less luminous galaxy. Quantitative photometry is difficult because the AO data have insufficient surface brightness sensitivity to fully capture the extended emission, and the NIRC data insufficient resolution to fully separate the two components. Our best estimate is a ratio for the stellar -band luminosities of the western and eastern components.
Our observations clearly show that the -band luminosity of 3C294 is dominated by stars, not by the active nucleus. In fact the 4% of the -band light contained in the compact “core” sets a stringent upper limit to the AGN contribution. This agrees with results from lower-resolution imaging of 3CR galaxies, which indicate that few have nuclei contributing more than of the -band light (Best et al. 1997). It is the dominance of the old stellar population that produces a well-defined relation, and the locus of 3C294 in the diagram is indeed close to that of other 3CR galaxies at comparable redshifts (Best et al. 1998). On the other hand, this is surprising in view of the peculiar near-IR morphology of 3C294. If the activity of radio galaxies is generally tied to galaxy-galaxy interaction, one should not expect to find a uniform population of hosts in radio-selected samples, and therefore a large scatter in the relation. The fact that the radio source appears to be associated with the less massive of the two galaxies further complicates the picture, and appears to contradict models based on passive evolution at .
Near-IR imaging of a larger sample of radio galaxies with high angular resolution is clearly needed to clarify these issues. Adaptive optics with laser guide stars on 10 m class telescopes will be the ideal tool to perform these observations.
References
- (1) Baum, S.A., McCarthy, P.J. 2000. ApJ, 119, 2634
- (2) Best, P.N., Longair, M.S., & Röttgering, H.J.A. 1997. MNRAS, 292, 758
- (3) Best, P.N., Longair, M.S., & Röttgering, H.J.A. 1998. MNRAS, 295, 549
- (4) Cowie, L.L., Gardner, J.P., Hu, E.M., Songaila, A., Hodapp, K.W., Wainscoat, R.J. (1994). ApJ, 434, 114
- (5) Cowie, L.L., Hu, E.M., Songaila, A., Egami, E. 1997. ApJ, 481, L9
- (6) Kauffmann, G., Haehnelt, M. 2000. MNRAS, 311, 576
- (7) Kauffmann, G., White, S.D.M. 1993. MNRAS, 261, 921
- (8) Kristian, J., Sandage, A., Katem, B. 1974. ApJ, 191, 43
- (9) Lilly, S. 1988. ApJ, 333, 161
- (10) Matthews, K., Soifer, B.T. 1994. In Infrared Astronomy with Arrays, The Next Generation, ed. I.S. McLean, p. 239
- (11) McCarthy, P.J. 1993. ARAA, 31, 639
- (12) McCarthy, P.J. 1999. In The Hy-Redshift Universe: Galaxy Formation and Evolution at High Redshift. Eds. A.J. Bunker, W.J.M. van Breugel, ASP Conf. Vol. 193, p. 23
- (13) McCarthy, P.J., Baum, S.A., Spinrad, H. 1996. ApJS, 106, 281
- (14) McCarthy, P.J., Spinrad, H., Dickinson, M., van Breugel, W., Liebert, J. Djorgovski, S., & Eisenhardt, P. 1990. ApJ, 365, 487
- (15) McLean, I.S., Graham, J.R., Becklin, E.E., Figer, D.F., Larkin, J.E., Levenson, N.A., & Teplitz, H.I. 2000. Proc. SPIE Vol. 4008, 1048
- (16) Mobasher, B., Sharples, R.M., Ellis, R.S. 1993. MNRAS, 263, 560
- (17) Monet, D., et al. 1998. USNO-A2.0 Catalog, US Naval Observatory, Washington, DC
- (18) Pentericci, L., Röttgering, H.J.A., Miley, G.K., McCarthy, P., Spinrad, H., van Breugel, W.J.M., & Macchetto, F. 1999. A&A, 341, 329
- (19) Riley, J.M., Longair, M.S., & Gunn, J.E. 1980. MNRAS, 192, 233
- (20) Spinrad, H., Dey, A., Stern, D., Dunlop, J., Peacock, J., Jimenez, R., Windhorst, R. 1997. ApJ, 484, 581
- (21) Stockton, A., Canalizo, G., & Ridgway, S.E. 1999. ApJ, 519, L131
- (22) van Breugel, W.J.M., Stanford, S.A., Spinrad, H., Stern, D., Graham, J.R. 1998. ApJ, 502, 614
- (23) van Breugel, W., De Breuck, C., Stanford, S.A., Stern, D., Röttgering, H., Miley, G. 1999. ApJ, 518, L61
- (24) Véron, P. 1966. ApJ, 144, 861
- (25) Wizinowich, P.L., Acton, D.S., Lai, O., Gathright, J., Lupton, W., & Stomski, P.J. 2000. SPIE Vol. 4007, 2
- (26) Zirm, A., Dey, A., Dickinson, M., McCarthy, P.J., Eisenhardt, P., Djorgovski, S.G., Spinrad, H., Stanford, S.A., van Breugel, W. 1999. In The Hy-Redshift Universe: Galaxy Formation and Evolution at High Redshift. Eds. A.J. Bunker, W.J.M. van Breugel, ASP Conf. Vol. 193, p. 114