THE EVOLUTION OF BALMER ABSORPTION LINE STRENGTHSIN E/S0 GALAXIES FROM =0 TO =0.831
Abstract
We present new results from a systematic study of absorption line strengths of galaxies in clusters approaching redshifts of unity. In this paper, we specifically compare the strengths of the high-order Balmer absorption features of H and H in E/S0s in the four clusters Abell 2256 (=0.06), CL1358+62 (), MS2053–04 (), and MS1054–03 (). By comparing the correlation of Balmer line strength with velocity dispersion for E/S0s in the three clusters, we find moderate evolution in the zero-point of the (H+H)- relation with redshift. The trend is consistent with passive evolution of old stellar populations. Under the assumption that the samples can be compared directly, we use single-burst stellar population synthesis models to constrain the last major occurrences of star-formation in the observed E/S0s to be (95% confidence). We have compared the evolution of the Balmer absorption with the evolution of the -band fundamental plane and find that simple stellar population models agree very well with the data. While the best agreement occurs with a low value for , the data provide strong confirmation of the time-evolution in recent stellar population models.
Subject headings:
galaxies: evolution, galaxies: elliptical and lenticular, galaxies: clusters: individual (Abell 2256,CL1358+62,MS2053–04,MS1054–03)1. Introduction
The star-formation histories of early-type galaxies in distant clusters have been the focus of many recent studies (e.g., van Dokkum & Franx (1996); Bender, Ziegler, & Bruzual (1996); Ellis et al. (1997); Kelson et al. (1997); Ziegler & Bender (1997); van Dokkum et al. (1998); Pahre, de Carvalho, & Djorgovski (1998); Kelson et al. 2000c ; Ziegler et al. (2000)). While there is broad consensus is that E/S0 galaxies in distant clusters generally have old stellar populations, these results depend on the initial mass function (IMF), the cosmology, and the assumption that morphological evolution can be ignored. Whereas some of these effects can be taken into account using detailed models (see, e.g., van Dokkum & Franx (2001); Diaferio et al. (2000)), the interpretation is ultimately limited by the accuracy of the population synthesis models upon which any conclusion is based.
These assumptions can now be tested by measuring absorption line strengths as a function of redshift (time) in early-type cluster galaxies, The ”line strength” results can be compared to the evolution of colors and ratios, and the correlations between various age indicators can be compared to predictions of stellar population synthesis models. Together they can significantly increase our confidence in the deduced star-formation histories, and in the models themselves.
In this Letter we present first results on a new study of galaxy absorption line strengths to redshifts approaching unity, and compare the measured evolution with the evolution of the galaxy ratios, as derived from the fundamental plane (see van Dokkum et al. (1998); Kelson et al. 2000c and references therein). With this sample, we extend similar work by Bender et al. (1998) by a factor of two in redshift. Here we present the first results using E/S0 galaxies in the clusters Abell 2256 (=0.06), CL1358+62 (=0.33), MS2053–04 (=0.58), and MS1054–03 (=0.83), and discuss the resulting constraints on the star-formation histories, IMF, cosmological parameters, and the stellar population synthesis models themselves.
2. The Data
The CL1358+62, MS2053–04, and MS1054–03 spectroscopic data presented in this paper were obtained at the W.M. Keck Observatory using the Low Resolution Imaging Spectrograph (Oke et al. (1995)). The initial sample selection for the deep spectroscopy was based only on magnitude and preference for high-resolution spectroscopic follow-up was given to spectroscopically confirmed members (Fisher et al. (1998); Tran et al. (1999); van Dokkum et al. (2000); Tran et al. 2001, in prep. ). Hubble Space Telescope WFPC2 images in F814W were used to determine morphological classifications (Fabricant, Franx, & van Dokkum (2000); van Dokkum et al. (2000); Fabricant et al. 2001, in prep. ). In this paper we limit the discussion to the E/S0 galaxies, with more thorough discussion of the general cluster populations being prepared for a later paper.
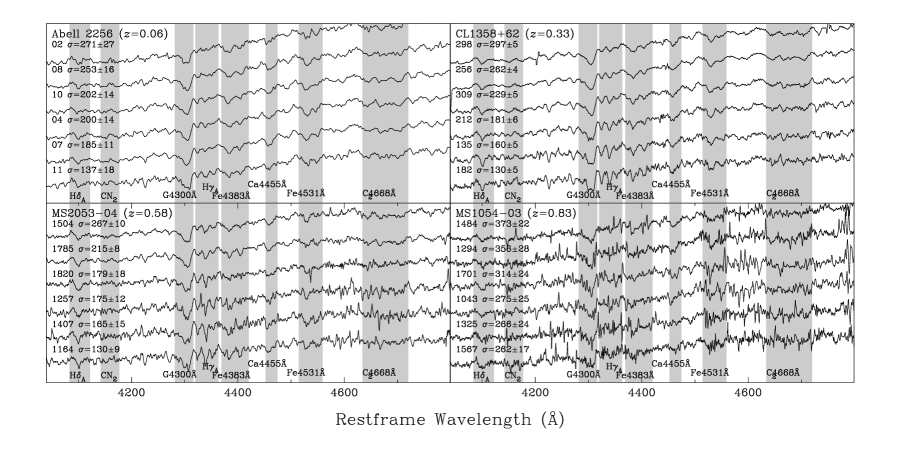
The CL1358+62 spectroscopic data and their reduction were published in Kelson et al. (2000b). The MS2053–04 and MS1054–03 data were similarly processed. The spectroscopic reductions described in Kelson et al. (2000b) provided data of the quality required for measurement of absorption line strengths, with one additional step for removing atmospheric H2O absorption at 6800 Å, 7600 Å, and 8200 Å. In each slit-mask we had included bright blue stars in order to accurately determine the telluric absorption in each exposure. The galaxy spectra presented in this paper have ratios ranging from 20-100 per Å (in the continuum). The resolution was typically km/s. The data for the local comparison sample of 9 early-type galaxies in Abell 2256 were obtained at the KPNO 4m and these data were processed and analyzed using the same procedures as were used with the high- data in an effort to minimize possible systematic errors. By doing so, we avoid any systematic effects between our distant samples and those published in the literature (e.g., Terlevich et al. (1999); Kuntschner (2000)). Figure 1 shows example spectra from each of the four clusters.
Velocity dispersions were measured using the direct fitting method of Kelson et al. (2000b). The raw velocity dispersions were corrected for aperture size to values equivalent to a aperture at the distance of Coma using the prescription of Jørgensen et al. (1995). The corrections were +2.3%, +4.7%, +5.6% and +6.0% for the galaxies in A2256, CL1358+62, MS2053–04, and MS1054–03, respectively.
Absorption line strengths were measured using the Trager et al. (1998) definitions for the Lick/IDS indices. For this letter, we use the indices of the Balmer lines H and H defined by Worthey & Ottavianni (1997), and will discuss the other indices in a later paper. The raw indices were corrected for both the instrumental broadening using the Worthey & Ottavianni (1997) estimates for the resolution of the Lick/IDS data, and for Doppler broadening.
Accurate estimation of the errors in absorption line strengths requires knowledge of the variance in the data due to noise (see, e.g., González (1993); Cardiel et al. (1998)). In work on distant (i.e., highly redshifted) galaxies, the photon statistics and electronics noise is supplemented by localized sources of noise, such as sharp residuals from the subtraction of the bright OH emission lines of the background, and residual fringing not removed by the flat-fields. Therefore, we estimate the variances using the residuals between the observed spectra and the high-resolution model SED from Vazdekis (1999), suitably broadened to match the instrumental resolution and Doppler broadening of the galaxy spectrum, which provides the lowest (as a function of age and [Fe/H]). We assume the square of the residuals between the observed and model SEDs in each index and continuum bandpass accurately reflects the variance due to noise in the data, and the errors in the absorption line strengths are derived by propagating these variances. Monte Carlo simulations have verified that this method provides accurate error estimates.
Because the metric apertures from which the galaxy spectra were extracted are systematically larger at high redshift than at low redshift, the Balmer line strengths needed to be corrected to a consistent aperture size. Unfortunately no published set of aperture corrections exist yet for the H and H line strengths. However, one can estimate the corrections by integrating the published mean major-axis H gradients of the E/S0 galaxies in Fornax (Kuntschner (1999)), weighted by an -law surface brightness profile, over a circular aperture. Utilizing the Worthey (1994) and Vazdekis et al. (1996) model prediction that HHH, we find that the required aperture corrections scale with effective aperture diameter as HH. One can also scale the Mg2 aperture correction prescription of Jørgensen et al. (1995) by the ratio of the gradients in (H+H) and Mg2 and recover the same scaling. Using the above scaling of line strength with aperture size, we correct the line strengths to a nominal aperture of size at the distance of CL1358+62 (=0.33). The resulting corrections were Å, Å, Å, for A2256, MS2053–04, and MS1054–03, respectively.
3. Evolution of the Balmer Line Strengths
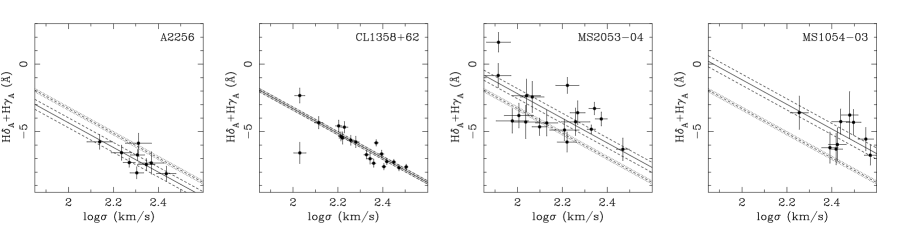
In Figure 2 we show the correlation between (H+H) (Worthey & Ottaviani (1997)) and velocity dispersion for E/S0 galaxies in A2256, CL1358+62, MS2053–04, and MS1054–03. For the large sample of early-type galaxies in CL1358+62, there is a well-defined correlation. This correlation spans a wide range of velocity dispersion and Balmer line strengths, from positive values (strong Balmer absorption) to negative values (weak Balmer absorption) which occur when the mean flux levels in the continuum side-bands are lower than the mean flux level within the index passbands.
The form of the best-fit linear relation in CL1358+62, shown with its - zero-point uncertainties, is . The CL1358+62 E/S0s exhibit a remarkably low scatter of 0.50Å, equivalent to 13% in velocity dispersion. When expressed in velocity dispersion, this scatter is as low as that in the fundamental plane (Kelson et al. 2000c ). We have also derived the CL1358+62 H- relation and have compared it to the relation for Fornax E/S0s (using the published data of Kuntschner (2000)). We find H at =0.33 compared to H in Fornax, with similarly low scatter. The lack of strong evolution in the slope of this correlation suggests that stellar population ages do not vary strongly along the sequence of early-type galaxies (similar to the conclusions drawn by Stanford, Eisenhardt, & Dickinson (1998); Kelson et al. 2000c ).
As can be seen in Figure 2, the moderately large observational uncertainties and/or the small sample sizes in the current dataset prevent an accurate measurement of the slope of the correlation between Balmer absorption and central velocity dispersion in A2256, MS2053–04 and MS1054–03.
Given the similarity in the slopes of the Balmer Balmer line-velocity dispersion relations for Fornax and CL1358+62, we adopt the slope of the CL1358+62 relation for the remainder of the analysis and assume that only the zero-point evolves with redshift. We determined the mean zero-points in the four clusters giving all points uniform weight, using the bi-weight location estimator (Beers, Flynn, & Gebhardt (1990)).
The zero-points for the four clusters, normalized to galaxies with a dispersion of km/s, are , , , and (in units of Å). The A2256, MS2053–04 and MS1054–03 early-type galaxies are offset in zero-point from CL1358+62 by Å Å and Å, respectively. The offsets (see Figure 2) are significant, 4-, 3- and 5-, and correspond to larger absorption at earlier epochs (i.e., younger ages), as expected.
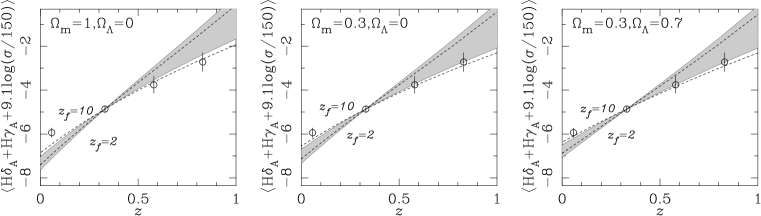
Figure 3 shows the evolution of the zero-point as a function of redshift. Assuming the galaxy populations in all three clusters can be compared directly, we show the predictions of single burst stellar population models from Worthey (1994; updated in Trager et al. (2000)) (shaded) and Vazdekis et al. (1996) (dashed lines). Models with star-formation redshifts of are shown.
Because the model predictions can be simplified to functions of the form, e.g., H, to a high degree of accuracy, we can decouple the time-evolution of the indices from the metallicity of a given model (while also rendering the adoption of km/s/Mpc unimportant). We find lower-limits of and (95% confidence limit) using the Worthey and Vazdekis models respectively, for , similar to conclusions drawn by past work (e.g., van Dokkum & Franx (1996); Bender, Ziegler, & Bruzual (1996); Kelson et al. (1997); van Dokkum et al. (1998)). As is always the case in this type of study, the conclusions depend on the assumptions that the individual cluster samples are co-eval, and that morphological evolution can be ignored (see, e.g., van Dokkum & Franx (2001)). Furthermore, we also remind the reader that early-type cluster galaxies may settle into their final configurations well after their last major epochs of star-formation leaving their morphological evolution decoupled from their star-formation histories (e.g., van Dokkum et al. (1999)).
4. Comparison with the Evolution of Ratios
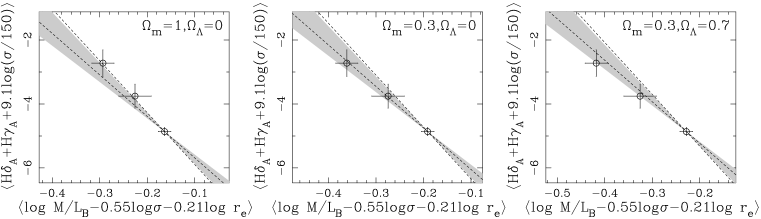
In past work we have established the evolution of the ratio for the same clusters using the fundamental plane relation (Kelson et al. (1997); van Dokkum et al. (1998); Kelson et al. 2000c ) and we now compare the mean evolution with that of the Balmer lines. The results are shown in Figure 4. Since the ratios are sensitive to cosmological parameters, we show the results for several values of and .
The models agree very well with the observed correlation between the evolution of the Balmer line strengths and the ratios. The slope of the predicted relation depends on the slope of the IMF through the ratio evolution (e.g., Tinsley & Gunn (1976)). Therefore, we show the Worthey (shaded) and Vazdekis (dashed lines) model predictions for a range of IMF slopes () about the Salpeter (1955) value. For standard IMFs and low values of , the models are consistent with our data (and the results of Bender et al. (1998)).
While late-time star-bursts and/or morphological evolution can bias the observed redshift evolution of the various age indicators (e.g., van Dokkum & Franx (2001)), each age-sensitive observable is affected similarly. Thus, comparisons like that in in Figure 4 provide tests of the population synthesis models which are free from any assumption of coevality, and are more powerful than simple examinations of galaxy properties as functions of redshift alone.
By extending our analysis to more spectral indices and galaxies of later morphological type, we will better constrain the stellar and morphological histories of cluster galaxies (see, e.g., Kelson et al. 2000c ). By doing so, we expect to quantitatively constrain the formation histories of distant galaxies, and better understand the evolution of cluster populations as a whole.
References
- Beers, Flynn, & Gebhardt (1990) Beers, T. C., Flynn, K., & Gebhardt, K. 1990, AJ, 100, 32
- Bender et al. (1998) Bender, R., Saglia, R.P., Ziegler, B., Belloni, P., Greggio, L, Hopp, U., & Bruzual, G. 1998, ApJ, 493, 529
- Bender, Ziegler, & Bruzual (1996) Bender, R., Ziegler, B., & Bruzual, G. 1996, ApJ, 463, L51
- Cardiel et al. (1998) Cardiel, N., Gorgas, J., Cenarro, J, & Gonz’alez, J.J. 1998, A&AS, 127, 597
- Diaferio et al. (2000) Diaferio, A., et al. 2000, MNRAS, submitted (astro-ph/0005485)
- Ellis et al. (1997) Ellis R. S., Smail, I., Dressler, A., Couch, W.J., Oemler, A., Butcher, H., & Sharples, R.M. 1997, ApJ, 483, 582
- Fabricant, Franx, & van Dokkum (2000) Fabricant, D.G., Franx, M., & van Dokkum, P.G. 2000, ApJ, astro-ph/0003360
- (8) Fabricant et al. 2001, in prep.
- Fisher et al. (1998) Fisher, D., Fabricant, D.G., Franx, M., & van Dokkum P.G. 1998, ApJ, 498, 195
- González (1993) González, J.J. 1993, Ph.D. thesis, Univ. Calif., Santa Cruz
- Jørgensen et al. (1995) Jørgensen I., Franx M., & Kjærgaard P. 1995, MNRAS, 276, 1341
- Jørgensen (1999) Jørgensen I. 1999, MNRAS, 306, 607
- Kelson (1998) Kelson, D.D. 1998, Ph.D. thesis, Univ. Calif., Santa Cruz
- Kelson et al. (1997) Kelson, D.D., van Dokkum, P.G., Franx, M., Illingworth, G.D., & Fabricant, D.G. 1997, ApJ, 478, L13
- (15) Kelson, D.D., Illingworth, G.D., van Dokkum, P.G., & Franx, M. 2000a, ApJ, 531, 137
- (16) Kelson, D.D., Illingworth, G.D., van Dokkum, P.G., & Franx, M. 2000b, ApJ, 531, 159
- (17) Kelson, D.D. Illingworth, G.D., van Dokkum, P.G., & Franx, M. 2000c, ApJ, 531, 184
- Kuntschner (1999) Kuntschner, H. 1999, Ph.D. dissertation
- Kuntschner (2000) Kuntschner, H. 2000, MNRAS, 315, 184
- Oke et al. (1995) Oke, J.B., et al. 1995, PASP, 107, 375
- Pahre, de Carvalho, & Djorgovski (1998) Pahre, M. A., de Carvalho, R. R., & Djorgovski, S. G. 1998, AJ, 116, 1606
- Salpeter (1955) Salpeter, E.E. 1955, ApJ, 121, 161
- Stanford, Eisenhardt, & Dickinson (1998) Stanford, S.A., Eisenhardt, P.R., & Dickinson, M. 1998, ApJ, 492, 461
- Terlevich et al. (1999) Terlevich, A.I., Kuntschner, H., Bower, R.G., Caldwell, N., & Sharples, R.M., 1999, MNRAS, 310, 445
- Tinsley & Gunn (1976) Tinsley, B.M. & Gunn, J.E. 1976, ApJ, 203, 52
- Trager et al. (1998) Trager, S.C., Worthey, G., Faber, S.M., Burstein, D., González, J.J. 1998, ApJS, 116, 1
- Trager et al. (2000) Trager, S.C., Faber, S.M., González, J.J., & Worthey, G. 2000, ApJ, submitted
- Tran et al. (1999) Tran, K.-V., Kelson, D.D., van Dokkum, P.G., Franx, G.D., & Magee, D. 1999, ApJ, 522, 39
- (29) Tran et al. 2001, in prep.
- van Dokkum & Franx (1996) van Dokkum, P. G., & Franx M. 1996, MNRAS, 281, 985
- van Dokkum & Franx (2001) van Dokkum, P. G., & Franx M. 2001, ApJ, submitted
- van Dokkum et al. (1998) van Dokkum, P. G., Franx, M., Kelson, D. D., & Illingworth, G. D. 1998, ApJ, 504, L17
- van Dokkum et al. (1999) van Dokkum, P. G., Franx, M., Fabricant, D., Kelson, D. D., & Illingworth, G. D. 1999, ApJ, 520, L95
- van Dokkum et al. (2000) van Dokkum, P.G., et al. 2000, ApJ, 541, 95
- Vazdekis (1999) Vazdekis, A. 1999, ApJ, 513, 224
- Vazdekis et al. (1996) Vazdekis, A., Casuso, E., Peletier, R.F., Beckman, J.E. 1996, ApJS, 106, 307
- Worthey (1994) Worthey, G. 1994, ApJS, 95, 107
- Worthey & Ottaviani (1997) Worthey, G. & Ottavianni, D.L. 1997, ApJS, 111, 377
- Ziegler & Bender (1997) Ziegler, B. L., & Bender, R. 1997, MNRAS, 291, 527
- Ziegler et al. (2000) Ziegler, B.L., Bower, R.G., Smail, I., Davies, R.L., & Lee, D., 2000, MNRAS, submitted