Mechanical Feedback:
From Stellar Wind Bubbles to Starbursts
Abstract
The current understanding of mechanical feedback is reviewed by evaluating the standard, adiabatic model for shell formation and evolution. This model is relevant to phenomena ranging from individual stellar-wind bubbles to galactic superwinds, forming the basis for our understanding of the multiphase ISM, IGM, and galactic evolutionary processes. Although significant discrepancies between the model and observation have been identified, to date there are none that require a fundamental revision. A variety of evidence, ranging over three orders of magnitude in spatial scale, is broadly consistent with the standard model. This includes kinematics of individual objects, observations of hot gas, the size distribution of H i shells, and outflow rates from starburst galaxies. However, some of the most pressing issues relating to shell evolution are still outstanding and obstruct efforts to resolve key questions like the fate of the hot gas.
1 Introduction
Mechanical feedback from massive stars is one of the principal drivers of evolutionary processes in galaxies. Our understanding of the feedback process is grounded in the conventional model for the evolution of stellar wind- and supernova-driven superbubbles (e.g., Pikel’ner 1968; Weaver et al. 1977): hot (log ), low-density () gas is generated within a double-shock structure, and the pressure of this hot gas, chemically enriched by the stellar products, drives the growth of the thin, radiatively-cooled shell. In the standard model, energy loss from the hot gas is considered to be negligible, yielding simple analytic expressions for the shell radius and expansion velocity as a function of time :
| (1) |
For a stellar wind-driven bubble, the input mechanical luminosity , where and are the stellar wind mass-loss rate and terminal velocity, respectively. For OB associations, supernovae quickly dominate over winds, in which case (e.g., Mac Low & McCray 1988), where and are the total number of supernovae and supernova energy, respectively, and is the time over which the supernovae occur.
The fate of this hot gas is crucial in understanding the phase balance and enrichment of the interstellar and intergalactic media. Is stellar feedback indeed the source of the diffuse, hot gas in the ISM? Do galactic superwinds from starbursts eject gas from galaxies? How does mechanical feedback affect the structure of the ISM and porosity, for example, to ionizing radiation? Do superbubbles trigger renewed star formation? To answer these basic questions, we must first evaluate the relevance of the standard, adiabatic model for shell evolution, which is applied over scales ranging from single stellar wind bubbles to galactic superwinds.
2 Single star bubbles
Single star bubbles of isolated OB stars are woefully understudied. Oey & Massey (1994) examined two nebular examples in M33, and spectroscopically classified the late-type O stars. The inferred stellar masses and ages implied wind parameters that were consistent with the observed sizes and shell ages predicted by the adiabatic model. However, the parameters were loosely constrained and the shell kinematics were not observed. H i shells with radii of several tens of pc have been identified as wind-blown bubbles around a number of Galactic O and Of stars (Cappa & Benaglia 1998; Benaglia & Cappa 1999). These are largely consistent with the standard model, and probe a specific subset of fairly evolved stars with old shells that have essentially stopped expanding.
Studies of Wolf-Rayet ring nebulae suggest shells that are too small, equivalent to an overestimate in by an order of magnitude (e.g., Treffers & Chu 1982; García-Segura & Mac Low 1995; Drissen et al. 1995). However, the progenitor star produces several wind phases, including both fast and slow winds, with strongly changing . Their cumulative effect on shell morphology is even more complex and poorly-understood than the wind evolution itself, and it is therefore unsurprising to find significant discrepancies between the predictions and observations of shell parameters. Hence it is desireable to study more of the simpler, single OB star bubbles.
3 Superbubbles
Superbubbles created by OB associations are more prominent than single-star bubbles, and thus have been studied more extensively. Soft X-ray emission has been detected from the interiors of many objects in projection, which is qualitatively consistent with the adiabatic superbubble model. Quantitatively, two classes of X-ray emission have been identified: objects with X-ray luminosity in excess of the standard model’s prediction (Chu & Mac Low 1990; Wang & Helfand 1991), and objects that remain undetected in X-rays (Chu et al. 1995). The X-ray–bright objects are suggested to be overluminous because of SNR impacts on the shell walls. Upper limits on the X-ray–dim objects remain consistent with predicted by the adiabatic model. It will thus be of great interest to determine for these objects with XMM-Newton or Chandra. The existence of hot gas within superbubbles also implies an interface region with the cooler shells where intermediate temperatures and ions should be present. Chu et al. (1994) searched a number sightlines through LMC superbubbles and confirmed the existence of C iv and Si iv absorption in all cases.
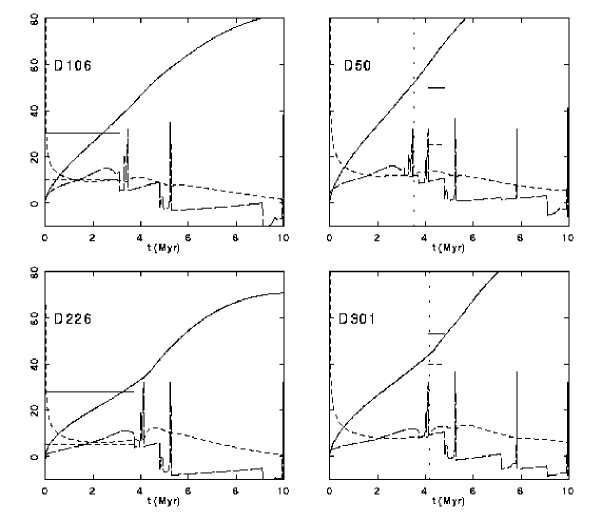
A stringent test of the adiabatic model is to compare the predicted and observed shell kinematics where the input mechanical power and other parameters are well-constrained. We obtained spectroscopic classifications of the OB associations in eight LMC superbubbles (Oey & Massey 1995; Oey 1996; Oey & Smedley 1998), thereby providing estimates of in these young, wind-dominated objects. The predicted growth rate for the shells was higher than implied by their observed and , equivalent to an overestimate in by an order of magnitude. However, even after adjusting in the models, over half the objects still showed observed expansion velocities that were typically a factor of two higher than predicted for the given . Similar discrepancies were reported for Galactic objects by Saken et al. (1992) and Brown et al. (1995). Figure 1 shows representative examples: the two objects in the left column show predicted (solid curves) and (dotted curves) in agreement with the observed values (horizontal segments); while the objects on the right show anomalously high observed . All the models have reduced by a factor of 10. The objects with anomalously high also each exhibit anomalously high and [S ii]/H, consistent with the suggestion by Chu & Mac Low (1990) and Wang & Helfand (1991) that SNR impacts have heated the shell. These would then also accelerate the shell walls, explaining the high observed . The observed stellar mass function in these objects also support this scenario, implying the former existence of 1–2 higher-mass stars corresponding to SN progenitors.
While the SNR impact hypothesis appears the most likely explanation for the high-velocity shells, a sudden drop in the ambient density can induce a “mini-blowout” with shell kinematics that can easily reproduce the anomalous observations (Oey & Smedley 1998; Mac Low et al. 1998; Franco & Silich 1999). Indeed, were it not for the high X-ray emission and additional evidence above, it would be impossible to distinguish between the two shell acceleration mechanisms from the kinematics alone.
We therefore see that the ambient density distribution is critical in determining the shell evolution. An underestimate in could, for example, contribute to the growth rate discrepancy described above, that is seen in all the objects. To clarify the effect of the ambient gas distribution, Oey et al. (2001) mapped the H i distribution within a radius of three nebular LMC superbubbles at 30′′ resolution, using the Australia Telescope Compact Array. The results show neutral environments that vary to an extreme: DEM L25 shows no H i shell component, but appears to be nestled in an H i hole; DEM L50 shows an H i shell with times more mass than the H component, but is otherwise in a large (1.4 kpc) H i void; and DEM L301 is in a non-descript neutral environment with no apparent correspondence to the optical shell. Thus, despite the similar appearance of the H nebulae, the H i distributions could not be more different. It is therefore extremely difficult to infer properties of ambient density distribution without direct, empirical determinations.
Another vital parameter for shell evolution is the ambient pressure, , which determines whether and when the superbubble growth becomes pressure-confined. While is usually relatively unimportant in young, high-pressure superbubbles such as the nebular objects modeled above, it is of vital importance in the mid- to late-stage evolution. It may also be relevant in high-pressure, ionized environments like dense star-forming regions (e.g., García-Segura & Franco 1996). The value of ultimately determines the final size of the objects, and conditions relative to blowout. The uniformity and distribution of in the multiphase ISM is therefore especially relevant to the global effect of superbubbles on the ISM (see below).
Finally, if the hot gas within superbubbles does not somehow blow out and merge into the hot, ionized medium (HIM), it is likely that the objects will cool and depart from energy conservation. Indeed, cooling of the hot interior has long been one of the principal questions for superbubble evolution and the fate of the hot gas. Thermal conduction at the interface between the cool shell wall and hot gas should cause a high rate of mass-loading into the interior, by evaporation. The evaporated shell material strongly dominates the mass in the hot region, which could be further supplemented by evaporation and ablation from small clouds overrun by the expanding shocks (e.g., Cowie & McKee 1977; McKee et al. 1984; Arthur & Henney 1996). If the interior density is sufficiently increased, radiative cooling will dominate, and the shells will no longer grow adiabatically. In addition, Silich et al. (2001) point out the importance of enhanced metallicity in the superbubble interiors, caused by the stellar and SN yields. Preliminary investigation for individual objects by Oey & Silich (2001, in preparation) shows enhancement in by almost an order of magnitude for low-metallicity () objects. The elemental yields therefore may also significantly enhance the cooling rate, facilitating the transition from adiabatic to momentum-conserving evolution.
4 Global mechanical feedback and superwinds
Quantifying the statistical properties of superbubbles in galaxies allows us to test the evolutionary model and also gain insight on the properties of the ISM. In particular, the so-called interstellar porosity (see below) is a conventional parameter for evaluating the relative importance of the HIM in the multiphase ISM.
4.1 Superbubble populations
Oey & Clarke (1997) derived expressions for the differential size distribution of superbubbles in a uniform ISM, using the analytic expressions for adiabatic evolution (equation 1). We considered a power-law mechanical luminosity function for the parent OB associations,
| (2) |
with , based on the typical H ii region luminosity function (H ii LF; e.g., Kennicutt et al. 1989; Oey & Clarke 1998a). The superbubble growth was also taken to be pressure-confined when the interior pressure . Star formation is assumed to be coeval within each OB association, with SNe therefore exploding over a period Myr, the lifetime of the lowest-mass SN progenitors. These simple assumptions yield two evolutionary paths for the superbubbles: objects whose growth stalls at radius due to pressure confinement at time ; and objects whose growth continues until . The characteristic timescale therefore determines the characteristic parameters and , which correspond to conditions for which an object stalls at .
The resultant size distribution for a constant superbubble creation rate , and single-valued is:
| (3) |
This is determined exclusively by growing objects, since the stall radius in this case is the same for all the shells, and represents the maximum in the distribution.
If all objects are created in a single burst, but now with a power-law (equation 2), then both growing and stalled objects contribute to the size distribution:
| (4) |
with . The stalled objects dominate the total for , beyond which the growing objects dominate, falling off with a much steeper -dependence.
For constant and power-law , the stalled objects again dominate, with a total :
| (5) |
where is an arbitrary period after during the which the superbubbles survive before disappearing. Here again, the stalled objects dominate, effectively yielding . The maximum in is at , corresponding to single-progenitor SNRs. At , growing, high- objects dominate with (equation 3). Oey & Clarke (1998b) show schematic representations of for the above three combinations of and .
We compared this result to the H i shell catalog for the Small Magellanic Cloud (SMC) compiled by Staveley-Smith et al. (1997). This is by far the most complete sample of H i shells obtained for any galaxy, as evidenced by the fact that the relative number counts of H ii regions and H i shells are in excellent agreement with their relative life expectancies. For shells having pc, the fitted power-law slope is , in excellent agreement with the general prediction of . Using from the observed H ii LF for the SMC (Kennicutt et al. 1989) yields a specific SMC prediction of , still in remarkable agreement with the observed value (Oey & Clarke 1997).
We note that different models for ISM structure yield different predictions for . For example, Stanimirović et al. (1999) suggest a possible fractal structure for the neutral ISM. From the same H i dataset of the SMC, they find a fractal dimension implying a size distribution for H i holes of . Within the uncertainties, this prediction cannot be empirically differentiated from our model with ; but it is worth noting that the predictions are in fact intrinsically different.
However, the superbubble size distribution presently is not a sensitive test in determining whether or not the objects evolve adiabatically. If all the internal energy is radiated away, the objects are predicted to follow the momentum-conserving law given by Steigman et al. (1975):
| (6) |
The stall radius in this case is only 1.3 times larger than for the adiabatic model. Furthermore, the size distribution follows the same law, (Oey & Clarke 1997). The observations of hot gas are therefore vital confirmation that the adiabatic model applies to a significant fraction of superbubbles.
It is also possible to derive the distribution of expansion velocities . This is naturally determined only by the growing objects (Oey & Clarke 1998b):
| (7) |
We again compared this prediction to the SMC H i shell catalog, and found a fitted power-law slope of , which is also in agreement with the prediction. Thus, in spite of the crude assumptions in deriving the shell size and velocity distributions, the data suggest that the neutral ISM in the SMC is fully consistent with superbubble activity dominating the structure. Although most other available H i shell catalogs are highly incomplete, preliminary results for a few other galaxies also show agreement with our model for the size distribution (Kim et al. 1999; Mashchenko et al. 1999; Oey & Clarke 1997).
4.2 ISM porosity and galactic superwinds
It is straightforward to use the analytic expression for (equation 5) to derive the interstellar porosity parameter , which is given by Oey & Clarke (1997) for 2- and 3-dimensional cases. is the ratio of: total area or volume occupied by superbubbles, to the total area or volume of the galaxy. Thus it is essentially the filling factor of hot gas, assuming hot gas is contained within all of the superbubbles. Determining has been the conventional way to evaluate the relative importance of the HIM (e.g., Cox & Smith 1974; McKee & Ostriker 1977; Heiles 1990). Values near unity indicate the HIM dominates the multiphase ISM, and values significantly imply an outflow, with the galaxy generating more hot gas than it can contain.
We can write in terms of a galaxy’s star-formation rate (SFR), :
| (8) |
for , a Salpeter (1955) IMF for stellar masses , and . and are the galaxy’s gaseous radius and scale height, respectively. We caution that depends on ambient interstellar parameters, for example, as indicated.
Table 1 shows the interstellar porosities for all the galaxies in the Local Group. Dwarf galaxy parameters are taken from Mateo (1998), and SFR’s for M31, M33, and the Magellanic Clouds from their H ii LF’s (Kennicutt et al. 1989). In general, we see that almost all the galaxies show low values with , implying that the HIM is not the dominant ISM component in these cases. The LMC is an exception, showing , so the HIM appears likely to dominate in this galaxy. The Milky Way results historically have been ambiguous and controversial (e.g., McKee & Ostriker 1977; Slavin & Cox 1993), and we obtain different answers from different methods. Taking the Galaxy’s SFR from the H ii LF of McKee & Williams (1997) and Smith & Kennicutt (1989) yields a low ; but using the SN rate of van den Bergh & Tammann (1991) yields .
Table 1: Porosities in the Local Group
| Galaxy | Q |
|---|---|
| M31 | 0.03 |
| M33 | 0.3 |
| LMC | 1.0 |
| SMC | 0.3 |
| IC 10 | 23 |
| LG dwarfs | 0.01 – 0.2 |
| Milky Way (H ii LF) | 0.2 |
| Milky Way (SN rate) | 1 |
However, by far the highest porosity is found for IC 10, the one starburst galaxy in the Local Group. IC 10 shows a value that is over an order of magnitude larger than for any other galaxy examined, therefore fulfilling the breakout criterion for a galactic superwind outflow. It is possible to estimate the mass-loss rate in this outflow , assuming that the material is largely evaporated from shell walls by thermal conduction. Mac Low & McCray (1988) have estimated the evaporation rate for an individual superbubble:
| (9) |
where is the mean mass per nucleon and is a conductivity coefficient. Integrating this over the superbubble size distribution yields :
| (10) |
The estimate of is necessarily crude, for example, we rather arbitrarily take , with the caveat that it may be limited by .
The maximum is obtained for the largest evaporating surface area of superbubbles, which occurs for . Porosities of imply strong interaction and destruction of the shells, or blowouts, probably reducing the available surface area. For IC 10, the derived normalization for yielding corresponds to . For comparison, the SFR required for (equation 8) is , which is only about 3 times more than ! Although the actual SFR for IC 10 is much larger (), yielding the higher original value, this rough calculation suggests that from galactic winds can be of similar magnitude as the parent starburst SFR. Indeed, an extensive absorption-line study of local starburst galaxies by Heckman et al. (2000) also concluded that empirically, the outflow and star-formation rates have the same order of magnitude for their sample.
Finally, we note the extensive body of numerical work on superbubbles and blowout conditions. These are too numerous to discuss here, but we refer the reader to Mac Low (1999) and Strickland & Stevens (2000), who provide overviews of this field. The details of the numerical predictions are presently difficult to confirm empirically, but observations with XMM-Newton and Chandra will be especially helpful to constrain the dominant processes.
5 Summary
We have seen that observations of mechanical feedback ranging from individual stellar wind bubbles to galactic superwinds are all roughly consistent with the conventional adiabatic model for bubble evolution. The empirical confirmation of hot, coronal gas supports the relevance of the adiabatic evolution for at least an important proportion of shell phenomena. Although kinematic discrepancies are often found for individual objects, these anomalies have plausible explanations, and presently there are no cases that suggest a need for any major revision of the conventional understanding. It is a remarkable strength that the adiabatic model apparently applies to phenomena over a range of size scales covering at least three orders of magnitude, from pc to kpc.
However, characterizing the dominant parameters and their effects on the shell evolution is still highly problematic. For example, critical ambient ISM conditions like the density, pressure, and ionization distributions remain elusive. The mechanisms and conditions for cooling of the interior energy need to be identified, and the energy budgets reliably determined. Perhaps the most fundamental question is the fate of the hot gas generated within the superbubbles: Does it escape and thereby constitute the HIM? Does it indeed escape from starburst galaxies, and from their gravitational potentials? These issues have vital consequences for almost all galactic evolutionary processes, and our understanding depends on further clarifying the bubble and superbubble process.
MSO gratefully acknowledges travel support from the Graduiertenkolleg and STScI Institute Fellowship. Some material in §4.2 was derived in 1998 at the Aspen Center for Physics.
-
References
-
Arthur, S. J. & Henney, W. J. 1996, ApJ, 457, 752
-
Benaglia, P. & Cappa, C. E. 1999, A&A, 346, 979
-
Brown, A. G. A., Hartmann, D., & Burton, W. B. 1995, A&A, 300, 903
-
Cappa, C. E. & Benaglia, P. 1998, AJ, 116, 1906
-
Chu, Y.-H., Chang, H.-W., Su, Y.-L., & Mac Low, M.-M., 1995, ApJ, 450, 157
-
Chu, Y.-H. & Mac Low, M-M., 1990, ApJ, 365, 510
-
Chu, Y.-H., Wakker, B., Mac Low, M.-M., & García-Segura, G. 1994, AJ, 108, 1696
-
Cowie, L. L. & McKee, C. F. 1977, ApJ, 211, 135
-
Cox, D. P. & Smith, B. W. 1974, ApJ, 189, L105
-
Drissen, L., Moffat, A. F. J., Walborn, N. R., & Shara, M. R. 1995, AJ, 110, 2235
-
García-Segura, G. & Franco, J. 1996, ApJ, 469, 171
-
García-Segura, G. & Mac Low, M.-M. 1995, ApJ, 455, 145
-
Heckman, T. M., Lehnert, M. D., Strickland, D. K., & Armus, L. 2000, ApJS, 129, 493
-
Heiles, C. 1990, ApJ, 354, 483
-
Kennicutt, R. C., Edgar, B. K., & Hodge, P. W. 1989, ApJ, 337, 761
-
Kim, S., Dopita, M. A., Staveley-Smith, L., & Bessell, M. S. 1999, AJ, 118, 2797
-
Mac Low, M.-M., in New Perspectives on the Interstellar Medium, eds. A. R. Taylor, T. L. Landecker, & G. Joncas, San Francisco: Astron. Soc. Pacific, 303
-
Mac Low, M.-M., Chang, T. H., Chu, Y.-H., Points, S. D., Smith, R. C., & Wakker, B. P. 1998, ApJ, 493, 260
-
Mac Low, M.-M. & McCray, R. 1988, ApJ, 324, 776
-
Magnier, E. A., Chu, Y.-H., Points, S. D., Hwang, U., & Smith, R. C. 1996, ApJ, 464, 829
-
Mashchenko, S. Y., Thilker, D. A., & Braun, R. 1999, A&A, 343, 352
-
Mateo, M. L. 1998, ARAA, 36, 435
-
McKee, C. F. & Ostriker, J. P. 1977, ApJ, 218, 148
-
McKee, C. F., Van Buren, D., & Lazareff, B. 1984, ApJ, 278, L115
-
McKee, C. F. & Williams, J. P. 1997, ApJ, 476, 144
-
Oey, M. S., 1996, ApJ, 467, 666
-
Oey, M. S. & Clarke, C. J. 1997, MNRAS, 289, 570
-
Oey, M. S. & Clarke, C. J. 1998a, AJ, 115, 1543
-
Oey, M. S. & Clarke, C. J. 1998b, in Interstellar Turbulence, eds. J. Franco & A. Carramiñana, Cambridge: Cambridge Univ. Press, 112
-
Oey, M. S., Groves, B., Staveley-Smith, L., & Smith, R. C. 2001, in preparation
-
Oey, M. S. & Massey, P., 1994, ApJ, 425, 635
-
Oey, M. S. & Massey, P., 1995, ApJ, 452, 210
-
Oey, M. S. & Smedley, S. A. 1998, AJ, 116, 1263
-
Pikel’ner, S. B. 1968, Astrophys. Lett., 2, 97
-
Saken, J. M., Shull, J. M., Garmany, C. D., Nichols-Bohlin, J., & Fesen, R. A. 1992, ApJ, 397, 537
-
Salpeter, E. E. 1955, ApJ, 121, 161
-
Silich, S. & Franco, J. 1999, ApJ, 522, 863
-
Silich, S. A., Tenorio-Tagle, G., Terlevich, R., Terlevich, E., & Netzer, H. 2001, MNRAS in press, astro-ph/0009092
-
Slavin, J. D. & Cox, D. P. 1993, ApJ, 417, 187
-
Smith, T. R. & Kennicutt, R. C. 1989, PASP, 101, 649
-
Stanimirović, S., Staveley-Smith, L., Dickey, J. M., Sault, R. J., & Snowden, S. L. 1999, MNRAS, 302, 417
-
Staveley-Smith, L., Sault, R. J., Hatzidimitriou, D., Kesteven, M. J., & McConnell, D. 1997, MNRAS 289, 225
-
Steigman, G., Strittmatter, P. A., & Williams, R. E. 1975, ApJ, 198, 575
-
Strickland, D. K. & Stevens, I. R. 2000, MNRAS, 314, 511
-
Treffers, R. R. & Chu, Y.-H. 1982, ApJ, 254, 569
-
van den Bergh, S. & Tammann, G. A. 1991, ARAA, 29, 363
-
Wang, Q. & Helfand, D. J. 1991, ApJ, 373, 497
-
Weaver, R., McCray, R., Castor, J., Shapiro, P., & Moore, R. 1977, ApJ, 218, 377