Temperature effects on the 15-85-m Spectra of Olivines and Pyroxenes
Abstract
Far-infrared spectra of laboratory silicates are normally obtained at room temperature even though the grains responsible for astronomical silicate emission bands seen at wavelengths m are likely to be at temperatures below K. In order to investigate the effect of temperature on silicate spectra, we have obtained absorption spectra of powdered forsterite and olivine, along with two orthoenstatites and diopside clinopyroxene, at 3.5 K and at room temperature (295 K). To determine the changes in the spectra the resolution must be increased from to 0.25 cm-1 at both temperatures since a reduction in temperature reduces the phonon density, thereby reducing the width of the infrared peaks. Several bands observed at 295 K split at 3.5 K. At 3.5 K the widths of isolated single bands in olivine, enstatites and diopside are of their 295 K-widths. However, in forsterite the 3.5-K–widths of the 31-, 49- and 69-m bands are, respectively, 90%, 45% and 31% of their 295 K widths. Due to an increase in phonon energy as the lattice contracts, 3.5-K–singlet peaks occur at shorter wavelengths than do the corresponding 295-K peaks; the magnitude of the wavelength shift increases from m at 25 m to m at 80 m. In olivines and enstatites the wavelength shifts can be approximated by polynomials of the form where K and the coefficients and differ between minerals; for diopside this formula gives a lower limit to the shift. Changes in the relative absorbances of spectral peaks are also observed. The temperature dependence of and bandwidth shows promise as a means to deduce characteristic temperatures of mineralogically distinct grain populations. In addition, the observed changes in band strength with temperature will affect estimates of grain masses and relative mineral abundances inferred using room-temperature laboratory data. Spectral measurements of a variety of minerals at a range of temperatures are required to fully quantify these effects.
keywords:
infrared spectroscopy; dust physics: temperature; silicates: crystalline1 INTRODUCTION
Mid and far-infrared spectra obtained with the Infrared Space Observatory Short- and Long-Wavelength Spectrometers (SWS and LWS, respectively) have revealed emission bands which have been associated with crystalline silicate dust. The environments include comets, young stellar objects and oxygen-rich dust in outflows and disks associated with late-type stars and planetary nebulae (e.g. Crovisier et al. 2000, Malfait et al. 1999, Waters et al. 1996, Sylvester et al. 1999 and Cohen et al. 1999, respectively). Simple spectral fits indicate that much of the optically thin silicate emission occurs at temperatures in the 50-100 K range (e.g. Sylvester et al. 1999). However, previous laboratory studies (e.g. Mennella et al. 1998, Henning & Mutschke 1997, Day 1976, Agladze et al. 1996) have shown that the optical properties of silicates vary between 295 K and 10 K. In MgO the frequency and FWHM() of the 24.5 m (295K) TO mode (Jasperse et al. 1964) vary nearly linearly with temperature between 7.5 and 1950 K (Kachare et al. 1972). A similar study of the effect of 423–873K-temperatures on 3-12m PAH bands by Joblin et al. (1995) revealed changes in band structure, bandwidth and frequency which indicate that free (as opposed to condensed) PAH molecules carry the astronomical 3.3m band.
Due to a lack of laboratory data, both simple black body fits and radiative transfer models of these environments have used silicate laboratory spectra obtained at room temperature. In addition to fitting ISO data, spectra obtained for a range of samples and temperatures will also be required for comparison with data from SIRTF, FIRST and the NGST. To begin to quantify the effect of temperature on silicates we compare spectra of two olivines, two orthoenstatites and diopside clinopyroxene at 295 K and 3.5 K.
1.1 Choice of Spectral Resolution
At cryogenic temperatures the vibrational states of a solid are substantially depopulated in comparison to their values at 295 K in accord with statistical thermodynamics. From the damped harmonic oscillator model, the width of a peak is related to the lifetime between phonon scattering events [Wooten 1972, Hofmeister 1999]. As the number of states decreases, the possibilities of scattering decrease, and the peaks must therefore sharpen. The vibrational bands observed in cryogenic m spectra of crystalline silicates [Day 1976, Henning & Mutschke 1997] are sharper and deeper than those obtained at room temperature. Medium (1-2 cm-1) resolution spectra (Henning & Mutschke 1997, Mutschke pers. commun. and Mennella et al. 1998) indicate that the bands of crystalline silicates shift in wavelength as the temperature is reduced, and that the magnitude of the shift increases with wavelength. If the spectral resolution is insufficient, very narrow peaks are under-sampled, leading to rounded profiles and incorrect measurements of the wavelength shifts. Therefore, higher-resolution measurements are crucial in the far-IR where lower-resolution data (Mennella et al. 1998) showed that the isolated m (143 cm-1) peak of forsterite has a 24 K width of 4 cm-1 and a 2 cm-1 shift between 295 K and 24 K. We therefore present 0.25 cm-1-resolution transmission spectra of crystalline minerals from the olivine and pyroxene groups at 3.5 K and 295 K.
2 Lattice structures and 295 K Band Assignments
2.1 Olivines
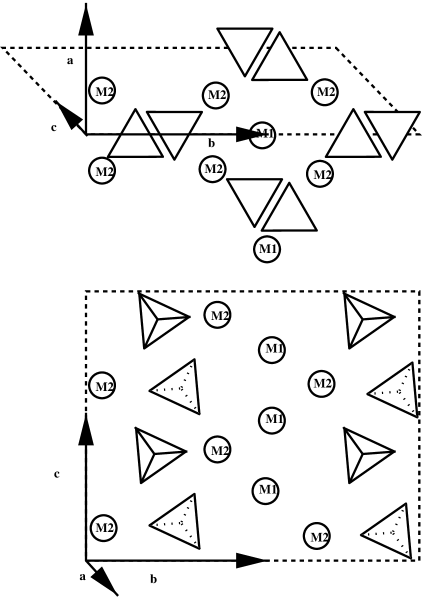
The general formula for the olivine solid solution series is (MgxFeSiO4; the Mg2+ end-member is forsterite, the Fe2+ end member is fayalite. Olivine minerals have the structure shown in Figure 1. In the figure each tetrahedron represents the SiO anion which consists of an Si atom surrounded by oxygen atoms at each corner of the tetrahedron; M1 and M2 represent the sites of the metal cations. In end-member forsterite both sites are occupied by Mg2+. In olivine some of the Mg2+ in sites M1 and M2 is replaced by Fe2+; in this case there is no preference for substitution between the sites since these two ions have similar radii. The active modes in the 15-85-m region are (after Hofmeister 1997): bending of the tetrahedral O–Si–O (Km), rotation of the SiO tetrahedra (four bands between 21 and 26 m), translation of the SiO tetrahedra (m) and translation of the Mg2+ and Fe2+ cations (several of the bands in the 21–30-m region); two bands are associated with combined translations of the divalent cations and SiO tetrahedra (at and m in forsterite; at and m in fayalite, Fe2SiO4).
2.2 Ortho- and Clino-pyroxenes
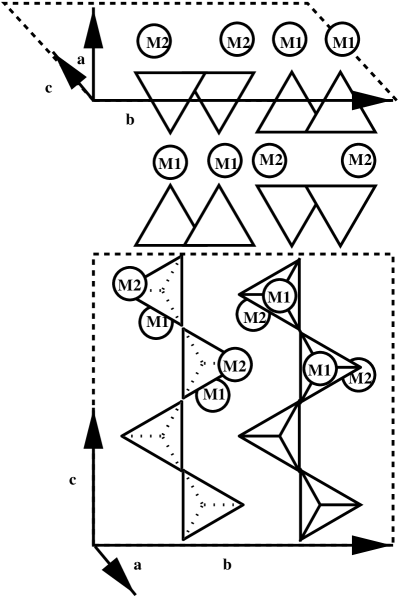
Minerals in the pyroxene solid solution series (Mgx,Fey,Caz)2Si2O6 where , belong to one of two crystal systems: orthorhombic, in which the three crystal axes are orthogonal, and monoclinic, which has two orthogonal and one inclined axis. The structure of orthopyroxene is shown in Figure 2; silicate tetrahedra are joined together by shared oxygen atoms to form long chains along the axis. Once again, Mg2+ and Fe2+ can replace each other in the M1 and M2 sites. The precise band assignments for the orthopyroxenes are unknown. However, comparison with the bands of the clinopyroxenes and olivines suggests that the bands longwards of m may involve translations of the cations, whereas bands at wavelengths shorter than m involve the deformation of the tetrahedral and inter-tetrahedral O–Si–O bonds.
In clinopyroxenes similar to diopside (there are other types of clinopyroxene), the larger Ca2+ ion (Å) occurs only in the M2 sites, whilst the smaller Mg2+ (Å) and Fe2+ (Å) ions occur in both these and the smaller M1 sites. This changes the alignment of the tetrahedra, resulting in a crystal shape with an inclined axis. Band assignments in diopsides are currently derived by comparison between force-constant calculations and laboratory data. The active modes in the 15-85-m region are modelled as (Tomisaka & Iishi 1980): bending of the tetrahedral and inter-tetrahedral O–Si–O bonds shortwards of 30 m at 295 K (at 23.2 and 29.6 m these may be blended with Mg2+ translations); Mg2+ translations blended with translations of the O–Si–O chain and rotations of the tetrahedra at 32.3 m; Mg2+ translations blended with tetrahedral rotations at 34.3m; Ca2+ translations blended with tetrahedral rotations at 40.4 m; Ca2+ translations at 44.9 m; finally a broad band at m is produced by a zig-zag motion of bridging oxygen atoms in the silicate chain. However, force constant models are not backed-up by laboratory measurements, and the assignments are tentative. Measurements of the effect of isotopic or chemical substitutions are needed for reliable band assignments.
3 THE EFFECT OF TEMPERATURE
3.1 Changes in bond length
If the bond length decreases, the energy of the associated phonon increases. (This physics is equivalent to the energy levels of a particle in a box; the effect is frequently observed in pressure studies, e.g. Ferraro 1984). Because frequency increases as pressure increases (or temperature decreases), the wavelength of the infrared peak must decrease. Tetrahedral Si–O bond lengths and bond angles are relatively incompressible in comparison to the spacings between the oxygen and metal ions and inter-tetrahedral oxygen atoms so there is little variation in the wavelength of the 10-m stretching and 20-m bending features with temperature (e.g. Day 1976). In contrast, the volumes of the divalent-cation sites are more compressible. Therefore one would expect to see a greater change in the wavelengths of peaks associated with the cation sites.
3.2 Changes in band occupancy
The lifetime, , of a phonon (the time between scattering events) is given by , where is the full-width-half-maximum of the peak in the imaginary part of the dielectric function, , in frequency units. (Wooten 1972). When the bands are narrow and weak, the frequency for the atoms vibrating parallel to the propagation direction of the radiation (the longitudinal optic; LO) is similar to the frequency of the atoms vibrating perpendicular to the propagation direction (the transverse optic; TO), thereby creating a symmetrical absorption peak whose shape approaches the Lorentzian shape of its counterpart in (Hofmeister and Mao 2001). Absorbance full-width-half-maxima (FWHM) are related to dielectric widths; therefore the widths of the absorbance peaks should be roughly proportional to the dielectric widths in wavenumbers.
At temperature, , the occupation of phonon energy levels relative to the ground state is given by the partition function , where is the Boltzmann constant and it is assumed that the phonon frequency, , is not a function of temperature (this is not true; see Section 3.1). As the temperature is decreased the number of vibrational states decreases and the numbers of phonon-phonon scattering events decrease so that phonon scattering off the crystal sides and defects becomes more important. For phonon-phonon scattering, the lifetime is inversely proportional to the number of phonons available, and hence as the sample is cooled, states are depopulated, and the lifetime increases and peak width decreases. In practise, FWHMs are not often measured and the FWHM temperature dependence is not well understood (see Hofmeister, in prep).
4 THE EXPERIMENT
4.1 Sample Preparation
| Group | Mineral | Composition | Source |
| Olivine | Synthetic Forsterite111Synthesized from oxide powders by H. K. Mao | Mg2SiO4 | Geophysical Laboratory, |
| Washington, D. C., USA. | |||
| Olivine (var. peridot) | (Mg1.77Fe0.20Al0.01Ni0.01)SiO4 | Navajo Indian Reservation | |
| San Carlos, Arizona, USA | |||
| Orthopyroxene | Enstatite | (Mg1.8Fe0.16Ca0.02)(Si1.88AlO6 | Fiskenaesset, Greenland |
| Bramble Enstatite | (Mg1.7Fe0.28Ca0.01)Si2O6 | Bramble, Norway | |
| Clinopyroxene | Diopside | (Ca0.992Na0.028Mg0.94FeFeCr0.002Al0.015)Si2O6 | Dekalb, NY, USA |
| Smithsonian sample R18682 |
Bulk samples of the minerals listed in Table 1 were broken into smaller pieces with a hammer and then ground to powders by hand with a ceramic pestle and mortar. Grain size was measured by visual inspection in a binocular microscope at magnification. Small quantities of powder were mixed with petroleum jelly on 0.8-mm-thick polyethylene substrates. Preliminary room temperature measurements at Washington University indicated that the grain sizes and the numbers of grains on each substrate were sufficient to resolve most infrared bands. At Queen Mary, University of London (QMUL) the samples and substrates were cut down and placed in brass holders. The 295 K and 3.5 K measurements for each mineral were performed with a single sample and the same spectrometer. The only difference between the measurements was the positioning of the sample in the instrument beam and the temperature of the sample. Hence, the substrate, the coverage of the substrate and the column density were identical for each measurement of a specimen.
4.2 Cryogenics and Spectroscopy
Spectra were obtained at QMUL using a Martin-Puplett polarising Fourier Transform Spectrometer with a mercury arc lamp source and a liquid-helium-cooled bolometer pumped to 1.5 K. For the room temperature (295 K) measurements, the sample was placed in the output beam of the spectrometer; the 3.5-K tests were performed by putting the samples in a filter wheel in front of the detector within the 1.5-K bath in the cryostat. Since the sample was heated by incident radiation from the arc lamp, it was slightly warmer than the bath, at K. The spectral resolution was selected by inspection of the interferogram; to resolve the fine structure of end-member forsterite at 3.5 K the resolution must be increased to 0.25 cm-1, whilst a resolution of 2 cm-1 is adequate at 295 K. For consistency, all spectra at all temperatures were obtained at the higher resolution of 0.25 cm-1.
For each temperature, reference spectra of the open aperture and petroleum jelly on a polyethylene slide were obtained and then divided into the spectrum of the sample to remove instrumental and substrate effects. For the 3.5 K transmittance spectra, there is an uncertainty in the flux calibration. Therefore the 3.5 K data were normalised to the level of the 295 K transmittance spectra at 500 m (20 cm-1) where the temperature dependence is small. The transmittance scale of the room temperature spectra is better than 1 and the uncertainty in the normalisation of the 3.5 K data is . The data were then converted to absorbance units (). Ripples in the spectra at wavelengths m are an artifact of imperfections in the thickness and the orientation of the samples and references relative to the beam.
Data were obtained for thick films of forsterite and olivine and for thinner films of olivine, and the pyroxenes. In the thick films, bands shortwards of 45 m were frequently saturated (these bands were excluded from the figures and the analysis). The olivine and enstatite thin films were too thin for bands longwards of 45 m to be resolved. The Bramble enstatite and diopside films were of sufficient thickness for the majority of bands to be seen at both temperatures. Since the mass and grain size distribution of the silicate powder is unmeasured, the derived absorbances do not indicate mass density and the absorbance per unit area per unit mass cannot be estimated from these data at present.
4.3 Astronomical Data
For comparison of our laboratory data with SWS and LWS spectra from ISO, we present observations of CPD -56∘8032, a planetary nebula whose ISO spectrum was published by Cohen et al. (1999). We have reduced SWS observation 13602083 and LWS observation 08401538 and subtracted a polynomial continuum fit (with no physical significance) to show up the fine structure. Cohen et al. obtained a qualitative match to their spectrum with room-temperature forsterite (Mg2SiO4), orthopyroxene and clinopyroxene, using laboratory data by Koike et al. (1993) multiplied by 65K (forsterite, clinopyroxene) and 90K (orthopyroxene) blackbody continua. Features at 43m and 62m were matched with crystalline water ice. The wavelengths and FWHMs of the silicate peaks in their fits are marked in Figures 4 and 5 by horizontal bars and vertical ticks. (It is beyond the scope of this paper to deduce the mineralogy of this source using our new laboratory data.)
5 RESULTS
5.1 Overview of the laboratory dataset
The 15-85-m absorbance spectra of the olivines (forsterite and olivine), orthopyroxenes (enstatite and Bramble enstatite) and a clinopyroxene (diopside) are presented in Figure 3.


Since it may be possible to estimate the grain size distribution and column density by electron microscopy at a later date, we present the measured values of absorbance for these samples222This normalisation differs from that presented previously: Bowey et al. (2000) re-normalised pairs of 3.5 K and 295 K absorbance spectra to the absorbance of the highest room temperature peak..
In general, (i) the room temperature spectra look like low-resolution versions of their 3.5 K counterparts, even though the same spectral resolution was used for all these measurements; (ii) the relative absorbance of neighbouring peaks changes as the temperature is reduced; (iii) the wavelength of a peak decreases with temperature and the magnitude of the shift increases with the wavelength of the band. The effect of temperature is most noticeable in the forsterite spectra, with the bands becoming particularly narrow and strong: this difference with degree of ionic substitution is real since this is the only mineral devoid of Fe2+ or other cations substituting for Mg2+ in the crystal structure.
5.2 Effect of sample thickness
Comparison of the spectra of the “thick” and “thin” olivine films reveals that thick samples (i.e. larger amounts of powder embedded in the petroleum jelly) are required to see the comparatively weak 50 and 70 m bands and this has resulted in the saturation of the most prominent features of forsterite and thick olivine at wavelengths m. Hence, saturated features have been excluded from the presented datasets. The room temperature spectra of the thin enstatite and thin olivine films contain no distinguishable features longwards of 45 m. The Bramble enstatite and diopside films are of intermediate thickness since bands are not saturated and the far-infrared peaks are clearly distinguishable from the underlying ripple.
5.3 Band splitting, band enhancements and changes in bandwidth
The detailed structure in the 18–38-m and 38–80-m regions are shown in Figures 4 and 5, respectively. Band splittings are seen shortwards of 38 m; whilst wavelength shifts, band enhancements and changes in the full-width-half-maxima (FWHM) of peaks are seen throughout the 18-80-m range.


5.3.1 Band splitting
In both olivines the degenerate m Mg2+ translation and SiO rotation splits into two bands when cooled to 3.5 K (Figure 4). The -m peak in forsterite is saturated, however this Mg2+ translation band is split in the 3.5-K olivine spectrum and the 36.45-m 295 K Mg2+ translation peak in forsterite is also split at 3.5 K. The band splittings in forsterite are consistent with the peaks produced from different polarisations occurring at the same frequency [Hofmeister 1997]; at 295 K this is an unresolved doublet. In the orthopyroxenes the band splitting is seen only in the three bands shortward of 23 m. Since the band assignments are undetermined in the enstatites, the cause of the splitting is unknown. In the diopside clinopyroxene only the degenerate Si–O–Si deformation at 20.91 m is split.
5.3.2 Band enhancements
The bands which are most strongly enhanced at low temperature, but which occur in both the room temperature and the 3.5 K spectra, are the unsaturated forsterite peaks, the 25.44-(295 K) to 26.17-m (3.5 K) olivine band, the 22.12-(295 K) to 23.00-m (3.5 K) band of Bramble enstatite and the 25.22-(295 K) to 24.80-m (3.5 K) band of diopside.
Some peaks which do not result from obvious splitting (or changes in the substrate) are seen only in the 3.5-K spectra. Such features occur in the 3.5-K thin enstatite spectrum at 26.41, 29.17 and 34.06 m. Since similar bands are seen in Bramble enstatite spectra obtained at both temperatures, we suggest that these features are enhanced at 3.5 K. Other peaks are seen in Bramble enstatite but not in enstatite (e.g. the 295-K 22.12-, 31.98-, and 31.08-m bands); this is probably due to the greater thickness of the Bramble sample and to differences in the metal content in the two minerals. Extra bands are seen in the 3.5 K spectrum of Bramble enstatite at 53.91 m, and in diopside at 57.16 m.
5.3.3 Changes in bandwidth
Estimates of the full-width-half-maxima of peaks which are well-separated from adjacent peaks and well-resolved are given in Table 2; peaks which are unresolved doublets at 295 K or are blended with stronger peaks have not been measured. The widths of isolated singlet peaks provide insight into the population of the vibrational modes. FWHM values were extracted with the IDL GAUSSFIT routine which approximates the continuum local to the peak with a quadratic equation and fits a gaussian to the peak. As described in Section 3.2, singlet peaks in the 3.5 K spectra are narrower than those measured at 295 K. With the exception of the forsterite peaks, bandwidths in the 3.5 K spectra are of their 295 K-widths, irrespective of the wavelength of the peak. The 31-, 49- and 69-m bands of 3.5 K forsterite are, respectively, 90%, 45% and 31% of their 295 K widths; these bands arise from phonons along one direction within the lattice.
| Sample | (295 K) | (295 K) | (3.5 K) | (3.5 K) |
|---|---|---|---|---|
| m | m | m | m | |
| Forsterite | ||||
| Olivine | - | |||
| Bramble | ||||
| Enstatite | ||||
| Diopside | ||||
The uncertainties in include the effects of spectral resolution, fringing and base-line estimates.
5.4 Wavelength Shift and Splitting Patterns
In Figure 6, the shifts in the peak wavelength of the bands between 295 K and 3.5 K, KK, are plotted as a function of the wavelength of the respective 295 K peaks.

In general, bands shift to shorter wavelengths at 3.5 K and the magnitude of the band shift increases with increasing wavelength, from m at 25 m to m at 80 m. However, the shift patterns are quite complicated because different peaks have different origins in the lattice. The situation is complicated in some of these spectra since we have not been able to resolve all the peaks in the thick forsterite and thin enstatite. Measurements of the spectra of other film thicknesses are required to determine the low-temperature behaviour of all the infrared peaks.
The shift patterns and band splittings are similar within a solid solution series if the lattice structure is the same. For example, the -m and -m bands exhibited by forsterite and olivine shift by similar amounts, –0.5 m and –0.9 m, respectively, when the minerals are cooled from 295 K to 3.5 K. The increase in the energies of these SiO and combined SiO and Mg2+ translations at 3.5 K indicates a contraction of the lattice as the temperature is reduced; sharpening of the bands is due to a reduction in phonon scattering at 3.5 K.
The ortho- and clinopyroxenes exhibit different shift and splitting patterns. The band shifts in Bramble enstatite and in enstatite increase fairly uniformly with wavelength. However shifts between neighbouring bands in diopside clinopyroxene vary by up to 0.3 m and between 27 and 41 m the pattern is almost saw-tooth. The complex shift pattern of diopside is probably caused by the difference in the size and mass of the Ca2+ and Mg2+ cations which respectively occupy the M2 and M1 sites. Band splitting in the three 18–22.5-m bands is common to both orthoenstatites– the Si–O–Si shifts in both minerals are and –0.4 m and the Mg2+ shifts of the -m peak are 0.0 and –0.5 m. The splittings are caused by a reduction in the widths of the peaks, and by different orientations (polarizations) of the bonds within the lattice because the different crystallographic axes contract with temperature at different rates.
6 DISCUSSION
6.1 Astrophysical Implications
These determinations of the relationship between temperature and band shifts and band splitting could help in reaching a better understanding of the mineralogy of astronomical regions showing optically thin silicate bands in the far infrared. Such temperature-dependent laboratory measurements could greatly benefit the elucidation of the physical properties of dusty environments.
6.1.1 Limits on the effect of temperature on
The far-infrared bands observed in many astronomical environments are wavelength-shifted with respect to bands of similar shape observed in room-temperature laboratory spectra (Molster 2000). Wavelength shifts can be introduced by temperature differences, but they can can also be introduced by other factors such as chemical and isotopic composition and degree of crystallinity. To place limits on the contribution of temperature to the wavelength shift of a peak in astronomical data, fits to the ratio, KKK, for peaks which did not split at 3.5K were obtained over the wavelength ranges specified in Table 3. Linear fits to were obtained using the IDL LINFIT routine; the fit to the upper limit of the diopside shifts was obtained with the IDL POLYFITW routine. Polynomial fits to the wavelength shifts of singlet bands between 295K and 3.5K are plotted in Figure 6 and the coefficients of these fits are are listed in Table 3.
| Mineral | Range | |||
|---|---|---|---|---|
| m | ||||
| Forsterite | 31-70 | -9.66 | 0.347 | - |
| Olivine | 24-74 | 7.47 | 0.0396 | - |
| Enstatite | 24-44 | -14.0 | 0.686 | - |
| Bramble Enstatite | 23-52 | -3.13 | 0.356 | - |
| Diopside 333Lower boundary of wavelength shifts: fit to 295 K peaks at 19.38, 23.17, 27.19, 32.30 m and all peaks where m. | 19-67 | -5.44 | 0.262 | - |
| 444Upper boundary of wavelength shifts: fit to 295 K peaks at 25.22, 34.29, 44.93 m | 25-45 | 62.4 | -2.55 | 0.0294 |
6.1.2 Determination of grain temperatures
Our results indicate that suitable high resolution spectra obtained at a range of cryogenic temperatures can be used to determine the characteristic temperatures of specific grain populations in astronomical spectra. An emission feature which peaks near 69 m in circumstellar spectra has been identified with forsterite (Malfait et al. 1998). However, the astronomical feature is shifted relative to room temperature laboratory data, which give m (Figure 5 and Table 2). In Figure 7(b) we compare the shape of the 69-m band of our laboratory forsterite spectra obtained at three different temperatures. The spectral resolution of the ISO LWS grating spectrometer at this wavelength was 0.3m, compared to the laboratory feature’s FWHM of 1.3 m at 295 K and 0.4 m at 3.5 K, while the LWS wavelength precision was 0.03m, compared to the shift of 0.9m in the peak wavelength between 295 K and 3.5 K. Therefore the derivation of characteristic grain temperatures from ISO spectra is quite feasible (see also Molster 2000) and will be reported on in a subsequent paper (Bowey et al., in preparation). Band splitting and band shifts at other wavelengths, for example the splitting in the 36.5m forsterite band shown in Figure 7(a), could also be used to determine grain temperatures if the spectral resolution and signal-to-noise of the astronomical data were sufficiently high. The relation between the derived characteristic grain temperatures at different wavelengths may aid the determination of the spatial distribution of the dust.

6.1.3 Effect on inferred mineralogical compositions and dust masses
The absorption coefficients of the forsterite bands are enhanced at 3.5 K compared to room temperature values. In contrast, there is little change in the absorption coefficients of most of the pyroxene features. Therefore, the true mass ratio of forsterite to enstatite could be smaller than estimated using room-temperature laboratory data. More mass is required to reproduce the strengths of many features in ISO spectra using room temperature optical constants, than would be required at the likely temperatures of the astronomical grains. Measurements of the temperature-dependence of the mass absorption coefficients are required in order to obtain the true relative mineralogical composition and dust masses.
7 SUMMARY
We have obtained 0.25 cm-1 resolution 15–85 m spectra of
powdered minerals embedded in petroleum jelly at K and
K. The samples were two olivines, forsterite
(Mg2SiO4) and olivine var. peridot
Mg1.77Fe0.20Al0.01Ni0.01SiO4, two
orthoenstatites, enstatite and Bramble enstatite, and a clinopyroxene
(MgCa diopside).
In general:
-
1.
the room temperature spectra look like lower-resolution versions of their 3.5 K counterparts. In both of the olivines the degenerate m Mg2+ translation and SiO rotation splits into two bands when cooled to 3.5 K. The -m peak in forsterite is saturated, however this Mg2+ translation band is split in the 3.5 K olivine spectrum and the 36.45-m 295 K Mg2+ translation peak in forsterite is also split at 3.5 K. In the orthoenstatites, band splitting is seen only in the three bands shortward of 23 m. In the MgCa diopside clinopyroxene only the 20.91-m degenerate Si–O–Si deformation is split. Different sample thicknesses must be measured to verify that no splitting is seen in other bands.
-
2.
the wavelength of a peak decreases with temperature and the magnitude of the shift increases with the wavelength of the band, from m at 25 m to m at 80 m. However, the shift patterns are quite complicated and depend on lattice structure as well as stoichiometry since they differ between ortho- and clino-pyroxenes. For example, the band shifts in Bramble enstatite and enstatite increase with wavelength. However, in the diopside clinopyroxene the shifts between neighbouring bands vary by up to 0.3 m – between 27 and 41 m the pattern is almost saw-tooth. The situation is complicated in these spectra since we have not been able to resolve all the peaks at all temperatures. For the olivines and enstatites the wavelength shifts of bands which are singlets at 295K and 3.5K can be approximated by polynomials of the form where K and coefficients and differ between minerals. Lower limits to the wavelength shifts for diopside can be obtained using polynomials of this form, however a third order term is required to obtain the upper estimates for wavelength shifts in the 20–41m region.
-
3.
bands sharpen as the temperature is reduced. At 3.5 K the widths of isolated single bands in the olivine, enstatites and diopside are of their 295 K-widths. However, in forsterite, the 3.5-K, 31, 49 and 69-m bandwidths are, respectively, 90%, 45% and 31% of their 295 K widths.
-
4.
the relative absorbances of neighbouring peaks change and bands sharpen as the temperature is reduced; this effect is most noticeable in the forsterite spectra. Peaks at 53.91 m in Bramble enstatite and at 57.16 m in diopside appear only in the 3.5 K spectra.
Our results show that comparison between the band shifts, bandwidths and band splitting in laboratory data obtained at a range of temperatures with astronomical far-infrared spectra can allow a determination of the characteristic temperatures of crystalline grains responsible for the optically thin emission features. Further low-temperature spectra at a range of temperatures are required to ascertain the precise temperature dependence of the shift, since the relationship between and is unlikely to be linear between 295K and 3.5K and it is possible that the bands stop shifting at some temperature above 3.5K. Ultimately it may be possible to determine the temperature of distinct grain populations by comparison of the observed peak wavelengths and FWHMs with laboratory spectra. Since the absorption coefficients of bands in laboratory spectra also vary with temperature, new measurements may allow better estimations of grain masses and silicate mineralogy. Additional high-resolution laboratory spectra of a larger variety silicates, at a larger number of temperatures, are desirable for comparison with ISO data and with future measurements obtained by spectrometers on board SIRTF, FIRST and the NGST. These laboratory measurements are planned.
acknowledgements
CL is supported by a Royal Society Research Fellowship; JEB and CT are supported by PPARC; AMH is supported by NSF under grant AST-9805924. The Bramble enstatite sample was supplied by R.F. Dymek (Washington U.) and the diopside sample was supplied by the Smithsonian Museum. STARLINK, IDL and ISAP software were used for data reduction and analysis. We thank the anonymous referee for a constructive report which has improved this paper.
References
- [Agladze et al. 1996] Agladze, N. I., Sievers, A. J., Jones, S. A., Burlitch, J. M., Beckwith, S. V. W., 1996, ApJ 462, 1026
- [Bowey et al. 2000] Bowey, J. E., Lee, C., Hofmeister, A. N., Tucker, C., Ade, P. A. R., 2000, ESA Special Publication SP-456 in press
- [Cohen et al. 1999] Cohen, M., Barlow, M. J., Sylvester, R. J., Liu, X. W., Cox, P., Lim, T., Schmitt, B. and Speck, A. K., 1999, ApJ Lett, 513, L135
- [Crovisier et al. 2000] Crovisier, J. et al., 2000, ASP Conf. Ser. 196 eds. M.L. Sitko, A.L. Sprague, and D.K. Lynch. (ASP: San Francisco): Thermal Emission Spectroscopy and Analysis of Dust, Disks, and Regoliths, 109
- [Day 1976] Day, K. L. 1976, ApJ 203, L99
- [Ferraro 1984] Ferraro, J.R. 1984 Vibrational spectroscopy at high external pressures: the diamond anvil cell. Academic Press, Inc. New York, 264
- [Henning & Mutschke 1997] Henning Th. & Mutschke H. 1997 A&A 327, 743
- [Hofmeister 1997] Hofmeister, A. M., 1997, Phys Chem Min 24, 535
- [Hofmeister 1999] Hofmeister, A. M., 1999, Science 283, 1699
- [Hofmeister 2001] Hofmeister, A. M. & Mao, H. K., 2001, Amer. Mineral. in press
- [Jasperse et al. 1964] Jasperse, J.R. Kahan, A., Plendl, J.N., Mitra, S.S. 1964, Phys. Rev. 146, 526542
- [protectJoblin 1995] Joblin, C., Boissel, P., Léger, A., D’Hendecourt, L. and Défourneau, D. 1995, A &A 299, 835
- [Kachare et al. 1972] Kachare A.,Andermann, G., Brantley, L. R., 1972, J. Phys Chem Solids, 33, 467
- [Malfait et al. 1998] Malfait, K., Waelkens, C., Vandenbussche, B., 1998, Ap & SS, 255, 43
- [Malfait et al. 1999] Malfait, K., Waelkens, C., Bouwman, J., Koter, A. De & Waters, L. B. F. M., 1999, A&A, 345, 181
- [Mennella et al. 1998] Mennella, V, Brucato, J. R., Colangeli, L., Palumbo, P., Rotundi, A. & Bussoletti, E. 1998, ApJ 496, 1058
- [Molster 2000] Molster, F. J., 2000, PhD Thesis, University of Amsterdam, Crystalline Silicates in Circumstellar Dust Shells
- [Sylvester et al. 1999] Sylvester, R. J., Kemper, F., Barlow, M. J., de Jong, T., Waters, L. B. F. M., Tielens, A. G. G. M. and Omont, A., 1999, A & A, 352, 587
- [Tomisaka & Iishi 1980] Tomisaka, T. & Iishi, K., 1980, Mineralogical Journal, 10, 81
- [Waters et al. 1996] Waters, L. B. F. M. et al. 1996 A & A, 315 L361
- [Wooten 1972] Wooten, F. 1972, in Optical properties of solids, Academic Press, Inc., San Diego