GRB010222: afterglow emission from a rapidly decelerating shock ††thanks: Based on observations collected at: the Italian Telescopio Nazionale Galileo (TNG), operated on the island of La Palma by the Centro Galileo Galilei of the CNAA (Consorzio Nazionale per l’Astronomia e l’Astrofisica) at the Spanish Observatorio del Roque de los Muchachos of the Instituto de Astrofisica de Canarias; the Asiago Astronomical Observatory, Italy; the Bologna Astronomical Observatory in Loiano, Italy; the Campo Imperatore Astronomical Observatory, Italy, and; TIRGO infrared observatory, Switzerland
The GRB010222 optical and near-infrared (NIR) afterglow was monitored at the TNG and other Italian telescopes starting 1 day after the high-energy prompt event. The light curves, which are the best sampled, are continuously steepening and can be described by two power laws, , of indices 0.7 and 1.3 before and after a break occurring at about 0.5 days after the GRB start time, respectively. This model accounts well also for the flux in the , and bands, which are less well monitored. The temporal break appears to be achromatic. The two -band points are not consistent with the above behaviour, and rather suggest a constant trend. A low-resolution optical spectrum has also been taken with TNG. In the optical spectrum we found three absorption systems at different redshifts (0.927, 1.155 and 1.475), the highest of which represents a lower limit to, and probably coincides with, the redshift of the GRB. The broad-band optical spectral energy distributions do not appear to vary with time, consistently with the achromatic behaviour of the light curves. We compare our measurements with different afterglow evolution scenarios and we find that they favor a transition from relativistic to non-relativistic conditions in the shock propagation.
Key Words.:
Gamma rays: bursts — Radiation mechanisms: non-thermal — Line: identification — Cosmology: observations1 Introduction
The light curves of Optical Transients (OTs) associated with GRBs are generally described by single power laws with indices . However, in a number of well monitored cases a change in the light decay rate at about 0.5-1 days after the GRB was detected with a transition to a steeper power law behaviour. The power law indices before and after the temporal break are typically in the range 0.7-1 and 1.7-2.4, respectively (GRB990123: Fruchter et al. 1999, Castro-Tirado et al. 1999, Kulkarni et al. 1999; GRB990510: Stanek et al. 1999, Harrison et al. 1999, Israel et al. 1999; GRB990705: Masetti et al. 2000a; GRB000926: Fynbo et al. 2001a). This behaviour can be caused by the deceleration of a relativistic jet in a homogeneous medium (Sari et al. 1999, Rhoads 1999), or by expansion in a wind (Chevalier & Li 1999, 2000), or by the transition between relativistic and Newtonian conditions in the plasma expansion (Dai & Lu 1999). Fits to multiwavelength data of individual afterglows with the above models have been proved to be satisfactory (Dai & Lu 1999, Panaitescu & Kumar 2000). The multiwavelength optical and near-infrared (NIR) spectra of OTs are generally well accounted for by synchrotron radiation in a relativistically expanding shock, and are described by power laws of different characteristic indices, depending on the location of injection and cooling breaks, and temporal evolution thereof (Sari et al. 1998). Both the fading rate and the spectral slopes are determined by the shape of the electron distribution, in different ways, according to the geometry of the emitting region. Departures of the optical-NIR spectral slopes from those expected based on the flux temporal decrease are often interpreted as due to absorption of the OT light within the GRB host galaxy (e.g. Palazzi et al. 1998, Dal Fiume et al. 2000, Klose et al. 2000, Price et al. 2001a).
GRB010222 was simultaneously detected by the Gamma–Ray Burst Monitor (GRBM) and the Wide Field Camera (WFC) unit 1 onboard BeppoSAX on 2001 Feb 22.30799 UT (Piro 2001a,b) as one of the most intense GRBs observed by both the GRBM and WFC. A quick repointing of the satellite allowed the detection of the X–ray afterglow at a position consistent with that of the prompt event (Gandolfi 2001). A detailed analysis of the high-energy data is presented by in ’t Zand et al. (2001).
Many observers started a ground-based campaign in order to search for the GRB afterglow at lower wavelengths. A bright transient source ( 18.4) was independently detected in the optical by Henden (2001a,b; see also Henden & Vrba 2001) and McDowell et al. (2001) about 4 hours after the GRB. The object, which is not present in the DSS-II sky survey, is at coordinates (J2000) = 14h 52m 1255, = +43∘ 01′ 062 with an error of 02 along both directions (Henden & Vrba 2001), well inside the error box of both high-energy prompt event and X–ray afterglow as detected by the BeppoSAX Narrow Field Instruments. The OT is among the brightest ever observed associated with GRBs.
The fading behaviour of the object, first reported by Henden & Vrba (2001) and later confirmed by Stanek et al. (2001a,b), left little doubt on its afterglow nature. Assuming for the -band flux a power law decay, typical of optical afterglows, Price et al. (2001b) and Fynbo et al. (2001a) measured a temporal slope = 0.890.09 and = 0.860.01, respectively. Masetti et al. (2001) reported that a steepening of the decay slope to 1.3 occurred at about 1 day after the GRB start time.
Garnavich et al. (2001) acquired an optical spectrum of the OT soon after its detection. From the presence of Fe ii and Mg ii absorption features, they measured a redshift = 1.477 for the afterglow. Jha et al. (2001a,b) also noticed the presence in the same spectrum of a second absorption system, located at = 1.157. A third absorption system at = 0.928 in the optical spectrum of the afterglow was reported by Bloom et al. (2001). The farthest of the three systems appeared to be formed by substructures at sligtly different redshifts, consistent with internal gas motions in galaxies (Castro et al. 2001).
A bright counterpart was also detected at NIR (Di Paola et al. 2001), submillimetric (Fich et al. 2001) and radio (Berger & Frail 2001) wavelengths.
The good sampling and the optical brightness of the GRB010222 afterglow have allowed a detailed study of its evolution at least up to about 40 days after the explosion. In this paper we present the results of the optical and NIR monitoring of the optical/NIR transient associated with GRB010222 conducted at various Italian telescopes and started about 1 day after the GRB. Section 2 illustrates the observations and the analysis of the photometric and spectroscopic data; the results are presented in Section 3 and discussed in Section 4.
| Exposure start | Telescope | Filter | Total exposure | Seeing | Magnitude1 |
| (UT) | time (s) | (arcsec) | |||
| 2001 Feb 22.982 | AZT-24 | 2700 | 4.0 | 18.60.22 | |
| 23.056 | Asiago | 1200 | 3.8 | 19.750.05 | |
| 23.063 | Asiago | 600 | 3.8 | 19.790.04 | |
| 23.069 | Asiago | 600 | 3.8 | 19.270.06 | |
| 23.082 | AZT-24 | 2400 | 4.0 | 17.20.32 | |
| 23.083 | Asiago | 600 | 3.8 | 19.320.06 | |
| 23.173 | Loiano | 2400 | 4.5 | 20.720.083 | |
| 23.199 | Loiano | 1800 | 4.0 | 20.370.103 | |
| 23.204 | AZT-24 | 900 | 4.0 | 18.40.32 | |
| 23.211 | TNG | 120 | 1.1 | 20.000.01 | |
| 23.219 | TNG | 120 | 1.1 | 20.010.01 | |
| 23.280 | TNG | 300 | 1.1 | 20.340.03 | |
| 23.284 | TNG | 300 | 1.1 | 20.330.03 | |
| 24.097 | TIRGO | 4680 | 3.8 | 19.210.35 | |
| 24.106 | Loiano | 2400 | 2.5 | 21.230.06 | |
| 24.117 | TIRGO | 4680 | 3.3 | 17.490.25 | |
| 24.127 | Loiano | 900 | 2.0 | 20.890.09 | |
| 24.236 | TNG | 120 | 1.0 | 21.060.03 | |
| 24.239 | TNG | 120 | 1.0 | 21.050.02 | |
| 24.241 | TNG | 120 | 1.0 | 20.420.04 | |
| 24.244 | TNG | 120 | 1.0 | 20.510.04 | |
| 24.247 | TNG | 120 | 1.0 | 21.440.02 | |
| 24.249 | TNG | 120 | 1.0 | 21.480.03 | |
| 24.252 | TNG | 300 | 1.0 | 21.870.02 | |
| 24.257 | TNG | 300 | 1.0 | 21.880.02 | |
| 24.262 | TNG | 450 | 1.0 | 21.330.04 | |
| 24.268 | TNG | 450 | 1.0 | 21.300.04 | |
| 25.253 | TNG | 120 | 0.9 | 21.640.03 | |
| 25.261 | TNG | 120 | 0.9 | 21.920.04 | |
| 25.263 | TNG | 120 | 0.9 | 21.960.03 | |
| 25.267 | TNG | 300 | 0.9 | 22.430.02 | |
| 25.271 | TNG | 300 | 0.9 | 22.470.03 | |
| 25.275 | TNG | 120 | 0.9 | 21.140.06 | |
| 25.277 | TNG | 120 | 0.9 | 21.160.06 | |
| 27.139 | Asiago | 900 | 3.1 | 22.110.25 | |
| 27.264 | TNG | 360 | 1.2 | 22.380.05 | |
| 27.270 | TNG | 360 | 1.1 | 22.800.06 | |
| 27.278 | TNG | 360 | 1.1 | 23.280.08 | |
| Mar 31.226 | TNG | 3300 | 1.2 | 25.10.2 | |
| 1Magnitudes of the GRB counterpart, not corrected for interstellar absorption | |||||
| 2This measurement supersedes the value reported by Di Paola et al. (2001) | |||||
| 3This measurement supersedes the value reported by Bartolini et al. (2001) | |||||
| Line | Observed | Rest frame | Element | Redshift | Wrest |
| number | wavelength (Å) | wavelength (Å) | (Å) | ||
| 1 | 3588 | 1862.790 | Aliii | 0.9260.002 | 2.10.2 |
| 2 | 3979 | 2062.664 | Znii/Crii blend | 0.9290.001 | 2.50.3 |
| 3 | 4573 | 2374.461 | Feii | 0.9260.001 | 0.40.2 |
| 4 | 4590 | 2382.765 | Feii | 0.9260.001 | 1.20.3 |
| 5 | 5014 | 2600.173 | Feii | 0.9280.001 | 0.70.3∗ |
| 6 | 5384 | 2796.352 | Mgii | 0.9250.001 | 0.70.3 |
| 7 | 5401 | 2803.531 | Mgii | 0.9260.001 | 1.10.3 |
| 8 | 5500 | 2852.964 | Mgi | 0.9280.001 | 0.60.3 |
| Weighted mean | ……………………… | 0.9270.001 | |||
| 9 | 3599 | 1670.787 | Alii | 1.1540.002 | 1.30.4 |
| 10 | 3995 | 1854.716 | Aliii | 1.1540.002 | 0.80.3 |
| 11 | 5060 | 2344.214 | Feii | 1.1580.001 | 0.70.3 |
| 12 | 5133 | 2382.765 | Feii | 1.1540.001 | 0.60.3 |
| 13 | 5573 | 2586.650 | Feii | 1.1540.001 | 1.10.4 |
| 14 | 5603 | 2600.173 | Feii | 1.1550.001 | 1.00.4 |
| 15 | 6024 | 2796.352 | Mgii | 1.1540.001 | 0.70.3 |
| 16 | 6038 | 2803.531 | Mgii | 1.1540.001 | 1.20.4 |
| Weighted mean | ……………………… | 1.1550.001 | |||
| 17 | 3783 | 1526.707 | Siii | 1.4780.002 | 1.20.3 |
| 18 | 3838 | 1550.774 | Civ | 1.4750.002 | 2.30.2 |
| 19 | 4132 | 1670.787 | Alii | 1.4730.002 | 1.10.3 |
| 20 | 4472 | 1808.013 | Siii | 1.4740.002 | 0.70.3 |
| 21 | 5014 | 2026.136 | Znii/Crii blend | 1.4750.001 | 0.60.2∗ |
| 22 | 5105 | 2062.664 | Znii/Mgi blend | 1.4750.001 | 1.10.3 |
| 23 | 5800 | 2344.214 | Feii | 1.4740.001 | 2.20.2 |
| 24 | 5880 | 2374.461 | Feii | 1.4760.001 | 1.90.2 |
| 25 | 5894 | 2382.765 | Feii | 1.4740.001 | 1.70.2 |
| 26 | 6384 | 2576.107 | Mnii | 1.4780.001 | 0.50.2 |
| 27 | 6401 | 2586.650 | Feii | 1.4740.001 | 0.80.3 |
| 28 | 6423 | 2593.731 | Mnii | 1.4760.001 | 2.00.2 |
| 29 | 6435 | 2600.173 | Feii | 1.4750.001 | 1.90.2 |
| 30 | 6454 | 2605.697 | Mnii | 1.4770.001 | 1.10.3 |
| 31 | 6919 | 2796.352 | Mgii | 1.4740.001 | 2.80.2 |
| 32 | 6937 | 2803.531 | Mgii | 1.4740.001 | 3.40.3 |
| 33 | 7069 | 2852.964 | Mgi | 1.4780.001 | 1.00.3 |
| Weighted mean | ……………………… | 1.4750.001 | |||
| ∗These lines might be blended with each other | |||||
2 Observations and data reduction
We observed the GRB010222 field at the 3.58-meter Telescopio Nazionale Galileo (TNG) in the Canary Islands (Spain), at the 1.8-meter “Copernicus” telescope at Cima Ekar of the “Leonida Rosino” Astronomical Observatory of Asiago (Italy), and at the University of Bologna 1.52-meter “G.D. Cassini” telescope in Loiano (Italy).
TNG was equipped with the spectrophotometer DOLoReS and a 20482048 pixels Loral CCD which allows covering a 9595 field in imaging mode with a scale of 0275/pix; the “Copernicus” telescope was carrying the AFOSC instrument whose 11001100 pixels SITE CCD has a field of view of 8585 with a scale of 047/pix; the “Cassini” telescope was mounting the spectrophotometer BFOSC with a 13401340 pixels EEV CCD, a field of view of 125125 and a scale of 058/pix.
NIR imaging in and bands was acquired at the AZT-24 1.1-meter telescope at Campo Imperatore (Italy) with SWIRCAM, a 256256 pixels infrared camera with a field of view of 4444 and a pixel scale of 103/pix, and in and at the 1.5-meter Gornergrat infrared telescope TIRGO (Switzerland) using the 256256 pixels infrared camera ARNICA which has a 4′4′ field of view and a pixel scale of 097/pix. The filter is centered at 2.12 m and has a full width at half maximum of 0.34 m. For each NIR observation the total integration time was split into images of 30 s each, and the telescope was dithered in between.
The complete log of our imaging observations is reported in Table 1.
Two 30-min spectra, nominally covering the 3000-8000 Å optical range, were also acquired with TNG+DOLoReS between Feb 23.227 and Feb 23.274 UT. The use of DOLoReS Grism #1 secured a dispersion of 2.4 Å/pix. The slit width was 15.
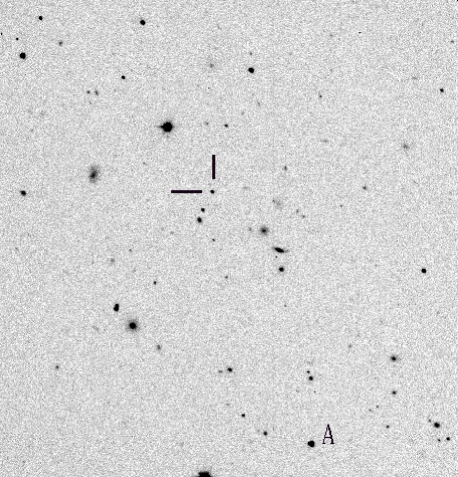

Optical images were debiased and flat-fielded with the standard cleaning procedure. In some cases, frames taken on the same night in the same band were summed together in order to increase the signal-to-noise ratio. In Fig. 1 we report our second TNG -band image. We chose standard Point Spread Function (PSF) fitting as photometric method, and to this aim we used the DAOPHOT II image data analysis package PSF-fitting algorithm (Stetson 1987) running within MIDAS111MIDAS (Munich Image Data Analysis System) is developed, distributed and maintained by ESO (European Southern Observatory) and is available at http://www.eso.org/projects/esomidas. A two-dimensional Gaussian profile with two free parameters (the half width at half maxima along and coordinates of each frame) was modeled on at least 5 unsaturated bright stars in each image. The errors associated with the measurements reported in Table 1 represent statistical uncertainties (at 1) obtained with the standard PSF-fitting procedure. In only one case, i.e. the TNG observation of Mar 31, we used aperture photometry for the magnitude determination as the PSF-fitting procedure could not give reliable results due to the faintness of the transient. In this case we used an aperture diameter equal to the seeing FWHM of the summed image.
To be consistent with magnitude measurements appeared on the GCN
circulars archive222GCN Circulars are
available at:
http://gcn.gsfc.nasa.gov/gcn/gcn3_archive.html,
calibration was done using the magnitudes, as measured by Henden
(2001c), of field star ‘A’ indicated by Stanek et al. (2001a). However we
used other field stars to check the stability of this calibration: we
found it to be accurate to within 5%. Any significant short-term
variation of star ‘A’ can be ruled out from our data.
Due to the color dependence of the DOLoReS CCD response in the
band, a 0.2 mag color-term correction was subtracted from the
magnitudes of the OT.
We remark that the photometry errors quoted throughout the rest of the
paper are only statistical and do not account for any possible
(most likely very small) zero point offset.
We also retrieved and reduced the two -band images obtained by Billings (2001) on 2001 Feb. 22.502 and 22.547 UT. From these, we obtain = 18.800.09 and 19.110.11, respectively, assuming the calibration by Henden (2001c) as described above.
Standard procedures were used to reduce the NIR data: a sky estimate for each image was computed from the clipped median of the nearby images. The telescope dithering was measured from the offsets of field objects in each image and the images were averaged together using inter-pixel shifts. Magnitudes were measured inside circular apertures of diameter 10′′ and corrected to total magnitudes. The photometric calibration was performed using NIR standard stars from the list by Hunt et al. (1998).
Given the poor seeing, the objects within 10′′ from the OT location could contribute to the measured NIR flux of the transient. It is not possible to accurately measure this effect, but we estimate that it is at most a small fraction of the total. Indeed, the peak of the emission is in good agreement with the expected position of the OT, and no evidence of flux is seen at the position of an object detected in the optical at about 5′′ north of the OT. Furthermore, the PSF profiles of the OT and of the object located 13′′ south-east of the OT itself are well distincted, suggesting that the latter does not contaminate the OT flux (see Fig. 2).
We rescaled the TIRGO magnitude to the standard band. This was done in two steps: we first considered that, given the almost identical characteristics of the and filters (Wainscoat & Cowie 1992) we could assume = within the large errors associated with our measurement. Second, using the relation = 0.2 by Wainscoat & Cowie (1992) and assuming the power law spectral shape described in Section 3.3 to estimate the -band magnitude of the OT, we obtained 0.15. Thus, = 17.350.3 at the time of the TIRGO observation.
We then evaluated the Galactic absorption in the optical and NIR bands along the direction of GRB010222 using the Galactic dust infrared maps by Schlegel et al. (1998); from these data we obtained a color excess = 0.022. By applying the law by Rieke & Lebofsky (1985), this color excess corresponds to = 0.07; then, using the relation by Cardelli et al. (1989), we derived = 0.12, = 0.09, = 0.05, = 0.04, = 0.02, = 0.01.
Spectra, after correction for flat-field and bias, were background subtracted and optimally extracted (Horne 1986) using IRAF333IRAF is the Image Reduction and Analysis Facility made available at http://iraf.noao.edu to the astronomical community by the National Optical Astronomy Observatories, which are operated by AURA, Inc., under contract with the U.S. National Science Foundation. STSDAS is distributed by the Space Telescope Science Institute, which is operated by the Association of Universities for Research in Astronomy (AURA), Inc., under NASA contract NAS 5–26555.. Helium-Argon lamps were used for wavelength calibration; spectra were then flux-calibrated by using the spectrophotometric standard Feige 34 (Massey et al. 1988) and finally averaged together. The correctness of the wavelength and flux calibrations was checked against the position of night sky lines and the photometric data collected around the epoch in which the spectra were acquired, respectively. The typical error was 0.5 Å for the wavelength calibration and 5% for the flux calibration.


3 Results
3.1 Photometry
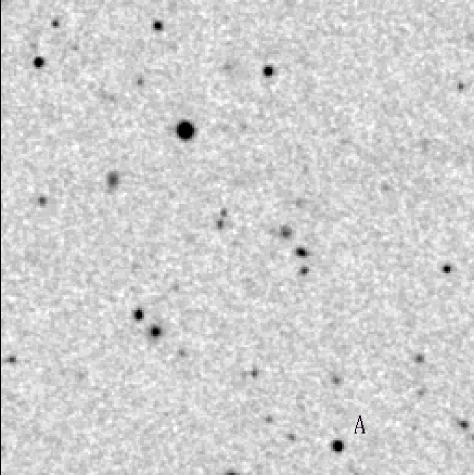
We clearly detect the transient in all optical and NIR filters; Fig. 1 shows the TNG -band image taken on 2001 Feb. 23.219 UT along with the same portion of sky as it appears on the DSS-II survey. The OT, indicated by the tickmarks, is clearly evident on the TNG image, while no object is present in the DSS-II image at that position. The association of this transient with GRB010222 is confirmed by the fading behaviour of this source (see optical magnitudes reported in Table 1). The light curves in bands are reported in Fig. 3, where our data are complemented with those published by other authors (GCN circulars archive; Sagar et al. 2001; Stanek et al. 2001c; Cowsik & Bhargavi 2001). Note that we rescaled the magnitudes appeared in the GCN circulars to the zero point measured by Henden (2001c); we did not plot in Fig. 3 the measurements in GCN circulars which could not be tied to this photometric zero point (for instance, unfiltered or independently calibrated magnitudes). No correction has been applied for Galactic extinction, which is anyway small (see previous Section), to the data in Table 1 and Fig. 3; nor has any host galaxy continuum emission been subtracted, this being unknown at present.
We find that a single power law decay of the form , where is the GRB start time, does not provide a satisfactory fit of the light curves. Indeed, considering a decay index 0.9 as reported by Price et al. (2001b) and Fynbo et al. (2001b), we obtain a fit with 65 over 68 degrees of freedom (dof). With this fit, the measurements acquired starting about 1 day after the GRB fall systematically below the expected decay. This is clearly evident in the -, - and -band light curves, the best sampled since the first hours after the GRB.
We thus hypothesize that the -band light curve can be modeled with a smoothly broken power law as the one used by Stanek et al. (1999) to fit the optical light curves of the GRB990510 afterglow. The model we apply is:
| (1) |
where is the time of the light curve break, is the asymptotic decay index for and is the asymptotic decay index for (times are expressed since ). Note that for the temporal decay indices we use inverted notations with respect to those of Stanek et al. (1999). We obtain a best fit of the -band data with = 0.230.01, = 1.570.01 and = 0.540.01 days after the GRB start time; however, this fit is not satisfactory, as it has 14 (66 dof) and systematically underestimates the OT flux for 5 days after the GRB.
We next try the generalization adopted by Beuermann et al. (1999) of a smoothly broken power law model:
| (2) |
where (with = 1,2), and in which the parameter indicates the smoothness of the change from a decay index to the other; for very large values of , this function assumes a broken power law shape. This model fits much better ( = 1.6, 65 dof) the points than model of Eq. (1). An F-test shows that the model by Beuermann et al. (1999) leads to a tiny chance probability of improvement with respect to model of Eq. (1).
The formal fit parameters are: = 0.540.08, = 1.310.02, = 0.440.05 days after the GRB start time, and ‘smoothness parameter’ = 3.11.0. The value of this parameter indicates that the slope change occurred quite fastly around 12 hours after . However, the fit parameters and are very sensitive to the value of , and we have noted that similarly acceptable fits ( ranging from 1.6 to 1.7) are obtained when varies from 3 to 10. Correspondingly, varies between 0.5 and 0.8, and between 0.4 and 0.7 days. The upper bounds of the intervals for these parameters are more consistent with the results of other authors (Sagar et al. 2001; Stanek et al. 2001c). Therefore, we will assume for and their average values within the above ranges, and the associated dispersions as uncertainties: = 0.650.15 and = 0.550.15 days. The parameter is instead very weakly sensitive to the value of .
The values associated with the fits are larger than 1 and therefore formally not completely satisfactory. By applying a systematic error of 1.5 % to all data points, in addition to the statistical and calibration uncertainties, the becomes 1. Such a small additional uncertainty can be ascribed to non-homogeneity of -band data set (acquired at different telescopes and analyzed using different methods), although small irregularities in the circumburst medium may produce in the afterglow light curve small time scale fluctuations of similar amplitude (e.g. GRB000301C, Masetti et al. 2000b; see also Wang & Loeb 2000).
The , , and light curves, albeit less well sampled, are consistent with the model describing the -band data (see Fig. 3); therefore, no appreciable color evolution is present in the optical afterglow. On the contrary, the -band light curve is consistent with being constant between the two epochs of observation.
From the fits, we obtained the following average color indices (not corrected for Galactic absorption): = 0.550.05, = 0.430.05, = 0.360.05, = 0.550.05 and = 0.720.15. These figures place the OT of GRB010222 in the locus populated by GRB optical afterglows in the optical color-color diagrams, as illustrated by Šimon et al. (2001).
3.2 Spectroscopy
We detect several absorption features in the optical spectrum of the GRB010222 afterglow (Fig. 4). As earlier reported by other authors (Garnavich et al. 2001; Jha et al. 2001a,b; Bloom et al. 2001), these correspond to three different metal absorption systems located at different redshifts. Our line fitting, performed with the SPLOT task within IRAF, assumes a Gaussian profile for the absorption lines. A conservative error of 3 Å, comparable with the pixel size, is associated with each line wavelength measurement.
On the averaged TNG spectrum, presented in Fig. 4, we mark the positions of all lines we identified. Each number corresponds to a line in Table 2, where line wavelengths, identifications and redshifts are reported. From our line identifications we measure the three absorption systems at = 0.9270.001, = 1.1550.001 and = 1.4750.001, the highest one thus being the lower limit for the redshift of this GRB. These results are consistent with those of Garnavich et al. (2001), Jha et al. (2001a,b) and Bloom et al. (2001). Our spectral resolution is not sufficient to confirm the presence of a fine structure in the farthest absorbing system as reported by Castro et al. (2001).
In Table 2 we also list the equivalent widths (EWs) of the identified lines computed in the absorber rest frame (i.e. by dividing the measured value by the factor 1+). The errors on the EWs are computed by assuming different spectral continuum levels roughly corresponding to 1 variation of the continuum itself in proximity of each line.
It can be noted from Table 2 that the metal lines of the absorption system at the highest are very strong. In particular, the detection of Mgi suggests that the optical emission of the GRB afterglow pierced through a dense medium, most likely that of a host galaxy at =1.475. If we consider the study of 1.65 Mgii systems in QSO spectra by Rao & Turnshek (2000) we find that, according to these authors, Mgii systems with rest frame EW of Mgii2796 Å are primarily associated with Damped Lyman– Absorption (DLA) systems. DLAs are characterized by being mostly Hi interstellar medium clouds of high redshift galaxies. Indeed, about 50% of the Rao & Turnshek’s (2000) sample of Mgii absorbers with Mgii2796 and Feii2600 EWs larger than 0.5 Å have Hi column density atoms cm-2 and basically all have atoms cm-2.
Moreover, they found that almost all DLAs with atoms cm-2 have Mgi2852 EW larger than 0.7 Å. Thus, given the EWs of Mgi, Feii and Mgii reported in Table 2, we have good indications that the =1.475 absorber, if not associated with the GRB itself, most likely resembles the properties of a DLA system with column density atoms cm-2. The ratio of the EWs of the Mgii doublet is = 0.80.1; this indicates that the absorption is saturated and, given the low resolution of the spectrum, the column density is undetermined. Rao & Turnshek (2000) also show that there is no precise relationship between the Hi column density and the rest frame EW of Mgii2796. Thus, although we have good indications that the =1.475 system bears substantial absorption, the Hi column density is basically unknown. Applying the same approach to the other two absorption systems lying along the GRB line of sight (although in the case of the absorber at =1.155 no Mgi is detected), we suggest that these systems have a Hi column density in excess of atoms cm-2. All this points to the possibility of the presence of additional extragalactic absorption along the GRB010222 line of sight.
Finally, we tested the hypothesis (Sari et al. 1998) that the optical spectrum can be described with a power law in the form F. If we fit the TNG spectrum with this law, we obtain = 1.160.05 (with 1), consistent with the fit results from the multiwavelength spectra shown in the next Subsection, but somewhat steeper than the value reported by Jha et al. (2001b).
3.3 Multiwavelength spectra
In order to study the temporal evolution of the multiwavelength spectrum of the GRB010222 afterglow, we have selected 5 epochs from 0.2 to 5 days after the high-energy event, at which best spectral sampling is available. We corrected the afterglow optical/NIR magnitudes for the Galactic absorption and converted them into fluxes using the tables by Fukugita et al. (1995) for the optical and by Bersanelli et al. (1991) for the NIR. If strictly simultaneous observations are not available, we reduced the fluxes to the reference epoch by interpolating the empirical model fitted to the -band light curve (see Sect. 3.1), and normalizing to the appropriate band. A 7% systematic error is added quadratically to the measurements to account for interpolation and magnitude-to-flux conversion uncertainties. The results are plotted in Fig. 5.
The optical spectral distributions covering , , and, when available, and filters are well fit at all epochs by a single power law of average spectral index = 1.10.1 (the is typically 1). A constant spectral shape is consistent with the achromatic evolution of the OT decay.
A single power law fit to the data at the third epoch gives = 1.30.1 with = 2.3 (5 dof), slightly steeper than the optical slope. Although this may suggest some absorption within the host galaxy in addition to the Galactic one (e.g., Lee et al. 2001), we note that the difference is barely significant, considering the uncertainty on the joint optical/NIR spectral fit. Therefore we conclude that the optical spectra at all epochs and the optical/NIR spectrum at 1.8 days after the GRB do not deviate significantly from a single power law of slope .
On the contrary, the -band point at the second epoch ( = 0.97 days after the GRB) strongly deviates from this trend. If we attempt to fit all points at this epoch with a single power law we obtain an unacceptable fit.


4 Discussion
The optical light curves of the GRB010222 afterglow are described by a continuously steepening trend, instead of a single power law, a behaviour seen in about 1/3 of the well monitored optical afterglows (GRB980519, Jaunsen et al. 2001; GRB990123, Castro-Tirado et al. 1999; GRB990510, Stanek et al. 1999; GRB990705, Masetti et al. 2000a; GRB991208, Castro-Tirado et al. 2001; GRB991216, Halpern et al. 2000; GRB000301C, Masetti et al. 2000b, Jensen et al. 2001; GRB000926, Fynbo et al. 2001a). In the present case, this cannot be ascribed to the synchrotron cooling frequency crossing the optical band in a spherical regime (Sari et al. 1998), because the expected variation of decay index would be in this case much smaller ( = 0.25) than observed (). Moreover, although the limited optical band hampers a neat distinction, the transition should be wavelength dependent, while the observed steepening is achromatic.
Therefore we have considered a decelerating and sideways expanding jet scenario (Sari et al. 1999). In this case, the index should equal the index of the electron energy distribution, thus = 1.3. From this follows that the optical decay index before the collimation break time must be = 0.23, in case is above the optical band at those epochs. This is rather different from our value of , 0.650.15. Therefore, within the present picture, at the observing epochs preceding the collimation break time, should have already crossed the optical band, so that the predicted would be 0.5, more similar to its observed value. The slope of the optical spectrum should then be /2 0.7, significantly flatter than both our measured value = 1.1 and that ( = 0.9) reported by Jha et al. (2001b).
Local absorption, on top of the Galactic extinction, may account for the difference (see below), but would lead to an intrinsic optical spectral slope rather different than found in X–rays (; in ’t Zand et al. 2001), which is inconsistent with the fact that both bands should be above . In addition, the index of the electron energy distribution derived in the sideways expanding jet scenario, = 1.3, is very flat (in general, values larger than 2 are found; see Frontera et al. 2000) and may pose energetic problems (although one can assume that the electron power law has a cut-off at some energy). Emission from the still undetected host galaxy of GRB010222 may flatten the late epoch light curve of the afterglow, but the most recent -band photometry (our Fig. 3; Stanek et al. 2001c; Sagar et al. 2001) suggests that the total magnitude of the host cannot be brighter than and that its contribution at the latest monitoring epochs (40 days after the GRB) is not significant, so that subtracting it from the optical measurements does not alter the fitted value of , and therefore of .
Given the problems posed by the application of the above model to our optical/NIR afterglow data, we have considered two alternatives.
First we have compared our results with a model of an external shock expanding in a pre-ejected wind, which determines a dependence for the medium density (Panaitescu & Kumar 2000). In the optical/NIR bands, it is predicted that, at the early epochs (up to 0.1 days after explosion in the source rest frame), the temporal decay is significantly flatter ( = 0.25) than found by us, while at later epochs our measured can be reproduced with = 2.1, which is acceptable.
Then, we have made the hypothesis that the temporal break observed in the optical light curves may be generated by the transition from relativistic to non-relativistic conditions in the shock (Dai & Lu 1999). By applying the prescriptions of Dai & Lu (1999) to our measured decay indices we obtain compatible conditions on only if the is above the optical band during our monitoring. From = 0.650.15 and = 1.310.02 we derive = 1.90.2 and = 2.270.01, respectively, which we consider marginally consistent with 2.1-2.2. This appears to be an acceptable value for the electron distribution shape. The predicted spectrum, for , is 0.6, much flatter than observed. We have made the hypothesis that intrinsic absorption at the source produces the observed steeper spectrum and we have searched for a de-extinction curve to correct for this.
As noted by Jha et al. (2001b), the optical spectrum lacks, at rest frame = 1.475, the typical 2175 Å dust absorption wide feature seen in the reddening curve of the Milky Way (Pei 1992, Cardelli et al. 1989) and of star forming galaxies (e.g. Calzetti 1997). Thus, intrinsic absorption must not be large. We have considered both an extinction curve appropriate for starburst galaxies (Calzetti 1997) and the SMC curve (Pei 1992), and applied them to our data. With the latter curve we cannot reproduce the predicted spectral slope in the optical/NIR wavelength range for any value of (while in the optical range only, acceptable fits are obtained, see also Lee et al. 2001). The starburst curve provides instead an acceptable correction and reproduces power-law spectra (except for the deviating -band point at epoch 0.97 days) with index for a moderate color excess, (see Fig. 6). The corrected optical/NIR spectral index is much flatter than that found in X–rays, which suggests that lies between the optical and X–ray bands. This is strengthened by the consistency of the X–ray spectral index with .
An empirical value of Hz (supposed to be nearly constant during the non-relativistic expansion, Dai & Lu 1999) is determined through the extrapolation of the optical and X–ray spectra (Fig. 6). The hypothesis of extinction within a heavily star forming host galaxy has the advantage of removing the mismatch between the optical and X–ray spectra normalizations (otherwise attributable to other causes, like inverse Compton emission in the X–rays, as suggested by in ’t Zand et al. 2001), and had been applied in a similar context also to GRB971214 (Dal Fiume et al. 2000).
The -band light curve behaviour is similar to that of the optical ones, indicating that the injection break frequency is below this band at both epochs of NIR observations. However, the behaviour of the -band light curve deviates significantly from that observed at shorter wavelengths. Comparison of the broad-band spectra at 0.97 and 1.8 days after GRB could suggest that the injection break may be located between the and bands at the former epoch, and has moved below the band at the latter. Although this would be consistent with the evolution time scale of (), the higher fluxes detected at sub-mm wavelengths at preceding and successive epochs, indicate that the injection break should be located longward of the NIR band during our monitoring (Fich et al. 2001; Kulkarni et al. 2001). Therefore, we have no straightforward explanation for the deviation of the -band point from a single optical-to-NIR power-law at 0.97 days.
At = 1.475, the total isotropic energy emitted in the 2-700 keV range by this GRB is 7.7 erg (in ’t Zand et al. 2001). With this total energy, and assuming a circumburst medium density of cm-3, the epoch of the transition from ultrarelativistic to non-relativistic conditions is about 1 day (Dai & Lu 1999). Therefore, the most viable interpretation of our data appears to be a shock undergoing a substantial deceleration and transition to non-relativistic conditions at about 0.5 days after the GRB (see also Dai & Cheng 2001). The consequent requirement of a thick ambient medium (denser than cm-3) is supported by the observation of the absorbing system at = 1.475, likely coinciding with the redshift of the source. This density would be typical for starburst galaxies (Calzetti 1997) or DLAs (Wolfe et al. 1986; Rao & Turnshek 2000), and is similar to that found for a number of GRB hosts (GRB990510, Vreeswijk et al. 2001; GRB000301C, Jensen et al. 2001; GRB000926, Fynbo et al. 2001a). Therefore, as for many previous OTs, there is the suggestion that GRB010222 occurred in a site of substantial star formation.
Our observations and conclusions point to the importance of early optical/NIR monitoring of GRB afterglows to establish their behaviour and to get insight into the GRB progenitor. This will be guaranteed by the current (HETE-2) or soon-to-fly GRB missions (AGILE and Swift).
Acknowledgements.
We thank the staff astronomers of the TNG, Asiago, Loiano, Campo Imperatore and TIRGO Observatories. We also thank the anonymous referee for comments and suggestions which helped us improving the paper. We acknowledge Scott Barthelmy for maintaining the GRB Coordinates Network (GCN) and BACODINE services; the BeppoSAX e-mail GRB Alert Service is also acknowledged. Krzysztof Stanek is thanked for having noted a discrepancy between our -band calibration and his, and for exchanging his -band data with us. C. Bartolini, A. Guarnieri, and A. Piccioni acknowledge the University of Bologna (Funds for Selected Research Topics).References
- (1) Bartolini, C., Bernabei, S., Guarnieri, A., et al., 2001, GCN 982
- (2) Berger, E., & Frail, D.A., 2001, GCN 968
- (3) Bersanelli, M., Bouchet, P., & Falomo, R., 1991, A&A, 252, 854
- (4) Beuermann, K., Hessman, F.V., Reinsch, K., et al., 1999, A&A, 352, L26
- (5) Billings, G., 2001, GCN 969
- (6) Bloom, J.S., Djorgovski, S.G., Halpern, J.P., et al., 2001, GCN 989
- (7) Calzetti, D., 1997, AJ, 113, 162
- (8) Cardelli, J.A., Clayton, G.C., & Mathis J.S., 1989, ApJ, 345, 245
- (9) Castro, S., Djorgovski, S.G., Kulkarni, S.R., et al., 2001, GCN 999
- (10) Castro-Tirado, A.J., Gorosabel, J., Zapatero-Osorio, M.R., et al., 1999, Science, 283, 2069
- (11) Castro-Tirado, A.J., Sokolov, V.V., Gorosabel, J., et al., 2001, A&A, 370, 398
- (12) Chevalier, R.A., & Li, Z.Y., 1999, ApJ, 520, L59
- (13) Chevalier, R.A., & Li, Z.Y., 2000, ApJ, 536, 195
- (14) Cowsik, R., & Bhargavi, S.G., 2001, GCN 1051
- (15) Dai, Z.G., & Lu, T., 1999, ApJ, 519, L155
- (16) Dai, Z.G., & Cheng, K.S., 2001, ApJ, submitted (astro-ph/0105055)
- (17) Dal Fiume, D., Amati, L., Antonelli, L.A., et al., 2000, A&A, 355, 454
- (18) Di Paola, A., Antonelli, L.A., Li Causi, G., & Valentini, G., 2001, GCN 977
- (19) Fich, M., Phillips, R.M., Tilanus, R.P.J., Frail, D.A., & Smith, I., 2001, GCN 971
- (20) Frontera, F., Amati, L., Costa, E., et al., 2000, ApJS, 127, 59
- (21) Fruchter, A.S., Thorsett, S.E., Metzger, M.R., et al. 1999, ApJ, 519, L13
- (22) Fukugita, M., Shimasaku, K., & Ichikawa, T., 1995, PASP, 107, 945
- (23) Fynbo, J.P.U., Gorosabel, J., Dall, T.H., et al., 2001a, A&A, in press (astro-ph/0102158)
- (24) Fynbo, J.P.U., Gorosabel, J., Jensen, B.L., et al., 2001b, GCN 975
- (25) Gandolfi, G., 2001, GCN 966
- (26) Garnavich, P.M., Pahre, M.A., Jha, S., et al., 2001, GCN 965
- (27) Halpern, J.P., Uglesich, R., Mirabal, N., et al., 2000, ApJ, 543, 697
- (28) Harrison, F.A., Bloom, J.S., Frail, D.A., et al., 1999, ApJ, 523, L121
- (29) Henden, A., 2001a, GCN 961
- (30) Henden, A., 2001b, GCN 962
- (31) Henden, A., 2001c, GCN 987
- (32) Henden, A., & Vrba F., 2001, GCN 967
- (33) Horne, K., 1986, PASP, 98, 609
- (34) Hunt, L.K., Mannucci, F., Testi, L., et al., 1998, AJ, 115, 2594
- (35) in ’t Zand, J.J.M., Kuiper, L., Amati, L., et al., 2001, ApJ, submitted, astro-ph/0104362
- (36) Israel, G.L., Marconi, G., Covino, S., et al., 1999, A&A, 348, L5
- (37) Jaunsen, A.O., Hjorth, J., Björnsson, G., et al., 2001, ApJ, 546, 127
- (38) Jensen, B.L., Fynbo, J.P.U., Gorosabel, J., et al., 2001, A&A, 370, 909
- (39) Jha, S., Matheson, T., Calkins, M., et al., 2001a, GCN 974
- (40) Jha, S., Pahre, M.A., Garnavich, P.M., et al., 2001b, ApJ, in press, (astro-ph/0103081)
- (41) Klose, S., Stecklum, B., Masetti, N., et al., 2000, ApJ, 545, 271
- (42) Kulkarni, S.R., Djorgovski, S.G., Odewahn S.C., et al., 1999, Nat, 398, 389
- (43) Kulkarni, S.R., Frail, D.A., Moriarty-Schieven, G., et al., 2001, GCN 996
- (44) Lee, B.C., Tucker, D.L., Vanden Berk, D.E., et al., 2001, ApJ, submitted (astro-ph/0104201)
- (45) Masetti, N., Palazzi, E., Pian E., et al., 2000a, A&A, 354, 473
- (46) Masetti, N., Bartolini, C., Bernabei, S., et al., 2000b, A&A 359, L23
- (47) Masetti, N., Palazzi, E., Pian, E., et al., 2001, GCN 985
- (48) Massey, P., Strobel, K., Barnes, J.V., & Anderson, E., 1988, ApJ, 328, 315
- (49) McDowell, J., Kilgard, R., Garnavich, P.M., Stanek, K.Z., & Jha, S., 2001, GCN 963
- (50) Palazzi, E., Pian, E., Masetti N., et al., 1998, A&A, 336, L95
- (51) Panaitescu, A., & Kumar, P., 2000, ApJ, 543, 66
- (52) Pei, W., 1992, ApJ, 395, 130
- (53) Piro, L., 2001a, GCN 959
- (54) Piro, L., 2001b, GCN 960
- (55) Price, P.A., Harrison, F.A., Galama, T.J., et al., 2001a, ApJ, 549, L7
- (56) Price, P.A., Gal-Yam, A., Ofek, E., et al., 2001b, GCN 973
- (57) Rao, S.M., & Turnshek, D.A., 2000, ApJS, 130, 1
- (58) Rhoads, J.E., 1999, ApJ, 525, 737
- (59) Rieke, G.H., & Lebofsky, M.J., 1985, ApJ, 288, 618
- (60) Sagar, R., Stalin, C.S., Bhattacharya, D., et al., 2001, Bull. Astron. Soc. India, submitted (astro-ph/0104249)
- (61) Sari, R., Piran, T., & Narayan, R., 1998, ApJ, 497, L17
- (62) Sari, R., Piran, T., & Halpern, J.P., 1999, ApJ, 519, L17
- (63) Schlegel, D.J., Finkbeiner, D.P., & Davis, M., 1998, ApJ, 500, 525
- (64) Šimon, V., Hudec, R., Pizzichini, G., & Masetti, N., 2001, A&A, submitted
- (65) Stanek, K.Z., Garnavich, P.M., Kaluzny, J., et al., 1999, ApJ, 522, L39
- (66) Stanek, K.Z., Jha, S., McDowell, J., et al., 2001a, GCN 970
- (67) Stanek, K.Z., Garnavich, P., Jha, S., & Pahre, M., 2001b, IAU Circ. 7586
- (68) Stanek, K.Z., Garnavich, P.M., Jha S., et al., 2001c, ApJ, submitted (astro-ph/0104329)
- (69) Stetson, P.B., 1987, PASP, 99, 191
- (70) Vreeswijk, P.M., Fruchter, A.S., Kaper, L., et al., 2001, ApJ, 546, 672
- (71) Wainscoat, R.J., & Cowie, L.L., 1992, AJ, 103, 332
- (72) Wang, X., & Loeb, A., 2000, ApJ, 535, 788
- (73) Wolfe, A.M., Turnshek, D.A., Smith, H.E., & Cohen, R.D., 1986, ApJS, 61, 249