A search for distant radio-loud quasars in the CLASS survey: three new radio-selected quasars at z4
Abstract
We report on the search for distant radio-loud quasars in the Cosmic Lens All Sky Survey (CLASS) of flat spectrum radio sources with mJy. Unresolved optical counterparts were selected from APM scans of POSS-I plates, with and red colours, in an effective area of deg2. Four sources were found to be quasars with , of which one was previously known. This sample bridges the gap between the strong radio surveys with mJy and the samples of radio-weak quasars that can be generated via radio observations of optically selected quasars. In addition, 4 new quasars at have been found. The selection criteria result in a success-rate of 1:7 for radio-loud quasars at , which is a significant improvement over previous studies. This search yields a surface density of 1 per 1600 deg2, which is about a factor of 15 lower than that found in a similar search for radio-quiet quasars at . The study presented here is strongly biased against quasars beyond , since the -passband of the POSS-I only samples the spectra shortward of 1200 at these redshifts.
1 Introduction
The abundance of massive compact objects at very early cosmological epochs firmly constrains cosmological structure formation scenarios (Kauffmann & Haehnelt 2000, Efstathiou & Rees 1988). This stimulates the search for quasars at the highest possible redshifts. Radio and optical surveys have shown a pronounced increase in the co-moving number density of quasars out to a redshift of 1 – 2, by about two orders of magnitude. There is now evidence that at the abundance of quasars declines (Warren et al. 1994; Schmidt et al. 1995; Shaver et al. 1999), which may indicate that, at these redshifts, we witness the onset of quasar activity in the universe. However, recently, the evidence for this has been debated by Jarvis & Rawlings (2000).
Whilst radio-loud quasars form only a small subset of the quasar population, the construction of radio-loud quasar samples is less prone to selection effects than are optical samples, since radio emission is unaffected by either intrinsic or extrinsic absorption due to dust. The most comprehensive and complete search for high redshift radio-loud quasars has been performed by Hook et al. (1995, 1996), who observed a complete sample of 161 mJy flat spectrum radio sources in an area of 7300 deg2, which were selected on their red optical colours and unresolved optical counterparts. Of these objects, 13 were found to be radio-loud quasars at , from which one was located at . In a similar fashion, Hook et al. (1998) searched for high redshift radio-loud quasars among flat spectrum radio sources, about an order of magnitude fainter ( mJy) than those studied previously. Seventy-three objects were selected from a complete sample of 2902 radio sources, drawn from the Greenbank 5 GHz survey and the FIRST 1.4 GHz (Gregory & Condon 1991; White et al. 1997) in an area of 1600 deg2 with , of which 70% were spectroscopically observed. Six of those were found to be radio loud quasars at , resulting in a surface density of one per 190 square degrees.
In this paper we report on a search for distant quasars in the Cosmic Lens All Sky Survey (CLASS, Myers et al. 2001, in prep.), using an optical colour selection technique similar, but more stringent, to that used by Hook et al. (1995, 1996, 1998). This project was aimed to find radio-loud quasars at , using candidate objects at similar flux densities as those in the GB/FIRST sample, but over a larger area. At the time of writing, only 5 radio-selected quasars at are available in the literature. These are given in table 1, including the newly discovered objects described in this paper. In addition to these radio-loud quasars, radio galaxies have also been discovered at high redshift. These are selected on their ultra-steep radio spectrum. At this moment, five radio galaxies are known at (e.g. van Breugel 2000).
2 The Cosmic Lens All Sky Survey (CLASS)
The CLASS survey is a large-scale survey primarily to search for gravitational lenses among flat-spectrum radio sources (Myers et al., 2001, in preparation). It consists of about flat spectrum sources, selected primarily from the 87GB 5 GHz, WENSS 325 MHz, and Greenbank 1400 MHz radio surveys (Gregory & Condon 1991; Rengelink et al. 1997; Condon & Broderick 1986). Recently a complete subsample of 11,685 objects was defined on the more accurate GB6 5 GHz (Gregory et al. 1996) and NVSS 1.4 GHz (Condon et al. 1998) surveys. In the selection procedure, the 1.4 GHz flux density of a GB6 radio source is defined as all the NVSS flux within 70′′ of the GB6 position. The complete sample has the following selection criteria:
-
1
Declination, , and
galactic latitude, . -
2
, with .
-
3
mJy
At the time of the selection of the targets for our spectroscopy observations, 10170 objects () of this complete sample had been observed with the VLA in A configuration at 8.4 GHz, yielding a resolution of 025 (fwhm) and a position accuracy of . The remaining objects, were not yet observed due to gaps in the sky-coverage of the NVSS at that time. These may therefore be considered to be sources with random radio properties.
About 10% of the observed targets were not detected at a mJy level. About 30% of those are certainly missed because they are lobes of larger sources, which are resolved out due to the lack of short baselines of the VLA in A configuration. Another 10% have been missed due to instrumental problems. Why the remaining sources have not been detected is not yet clear, but extended or complicated structure may play a role. Hence, we believe that most of these objects have large angular sizes and are unlikely to be located at high redshift. We therefore assume that these undetected sources will not influence the results and conclusions of this project.
3 The selection of the candidate sample
Since only one night of spectroscopy time was available for this project, with only a limited part of the sky accessible, the sample was reduced to objects located at north galactic latitudes, . In this way the area of sky overlaps with that scanned by the APM (see below). Furthermore, since all the observed radio-loud quasars at have radio-spectral indices clearly flatter than , the spectral index cut-off was increased to (removing 30% of the sources). In this way, the contamination of possible ‘low’ redshift galaxies, which are more biased towards steepish spectra (Snellen et al. 2001), is reduced. This resulted in a sample of 3202 candidate objects, selected on their radio properties only, over an effective area of deg2.
Optical identification of the resulting sample was carried out using the output catalogue of the APM scans of the Palomar Sky Survey (POSS-I) photographic plates in the (red) and (blue) passbands (McMahon & Irwin 1991). The optical radio correlation was done in a similar way as for the Jodrell Bank - VLA Astrometric Survey (JVAS), as described in detail by Snellen et al. (2001). The 3202 sources in the sample were correlated with the APM catalogue and were considered to have a candidate optical identification if the optical to radio position offset was found to be less than . In this way, 2030 sources () were found to have an optical identification. Note that the true percentage of CLASS sources with optical identifications is slightly higher than this due to limitations of the APM catalog, e.g. fragmentation of large galaxies, halos of bright stars, and blending of objects such that the centroid of the merged objects is displaced by a few arcseconds (see e.g. Snellen et al. 2001). Note however, that these problems will mainly occur for nearby galaxies and bright stars, which will not affect point source identification statistics of radio sources.
Candidate high redshift quasars were selected using the colour selection method (Hook et al. 1995), which is based on the assumption that objects at high redshift appear redder than those at low redshift due to intervening Ly absorption systems shifted into the blue passband. Hook et al. (1996) selected high redshift quasar candidates from the JVAS survey with star-like identifications, , and colour . However, 303 objects in the sample fulfill these selection criteria, too many for our limited observing time. Furthermore, the expected success-rate for finding quasars using these criteria, is only (Hook et al. 1996). For this project we were only interested in the quasars at , so we sharpened the selection criteria to increase the success-rate and decrease the number of candidates.
The five previously published radio-selected quasars, have (see table 1. We therefore increased the colour-cutoff from to . Although this meant that our sample is incomplete for , no effect is expected for quasars at The main contribution of candidates which turn out not to be high redshift quasars comes from galaxies at moderate distances, which the APM can not distinguish from point sources. The APM morphological classification is particularly crude towards its magnitude limit. We therefore lowered the magnitude limit for our candidate sample from to . The more stringent selection criteria in optical magnitude and colour, decreased the number of objects in the target sample from 303 to 40.
The IPAC/Caltech Extragalactic Database (NED) was searched for redshifts of the 40 potential target sources. Seven sources turned out to have measured redshifts, of which three galaxies (J1149+2958, z=0.158, Gregg et al. 1996; J1301+2842, z=0.42, Hook et al. 1998; J1436+4129, z=0.17, Hook et al. 1998), and four quasars (J1258+2909, z=3.51, Hook et al. 1998; J15100+5702, z=4.30, Hook et al, 1996; GBJ1605+3038, z=2.67; J1746+6226, z=3.89, Hook et al. 1996). In addition, the APM, POSS-I, and where available, the POSS-II data of the targets, were carefully examined by eye for anomalies or possible extendedness. Of the remaining 33 objects, a further 13 were rejected in this way; J1324+3417, J1609+4717, J1625+2017, J1648+5039, J1710+5028, J0845+4239, J0900+1357, J0951+3451, J1012+1619, J1151+6654, J1259+4129, J1605+3029, and J1632+0419. Hence, 27 objects satisfied our selection criteria, of which 20 sources were previously unobserved.
| Name | z | e | o-e | Refs. | ||
|---|---|---|---|---|---|---|
| mag | mag | mJy | ||||
| J083946+511202 | 4.41 | 18.5 | 3.3 | 51 | +0.11 | 5 |
| J091824+063653 | 4.19 | 18.7 | 2.7 | 36 | +0.12 | 5 |
| RXJ1028.60844 | 4.276 | 18.9 | 2.6 | 220 | 0.16 | 1 |
| PKS1251407 | 4.460 | 20.0 | 3.7 | 240 | 0.10 | 2 |
| J132512+112329 | 4.40 | 18.8 | 3.2 | 62 | 0.24 | 5 |
| GB1428+4217 | 4.715 | 20.9† | 3.4† | 250 | 0.13 | 4 |
| GB1508+5714 | 4.301 | 18.9 | 3.5 | 280 | 0.50 | 3,5 |
| GB1713+2148 | 4.011 | 21.0† | 2.9† | 330 | 0.23 | 4 |
| †R and B-R magnitudes |
| References: |
| 1: Zickgraf et al. 1997 |
| 2: Shaver et al. 1996 |
| 3: Hook et al. 1995 |
| 4: Hook et al. 1998 |
| 5: This paper |
4 Observations and reduction
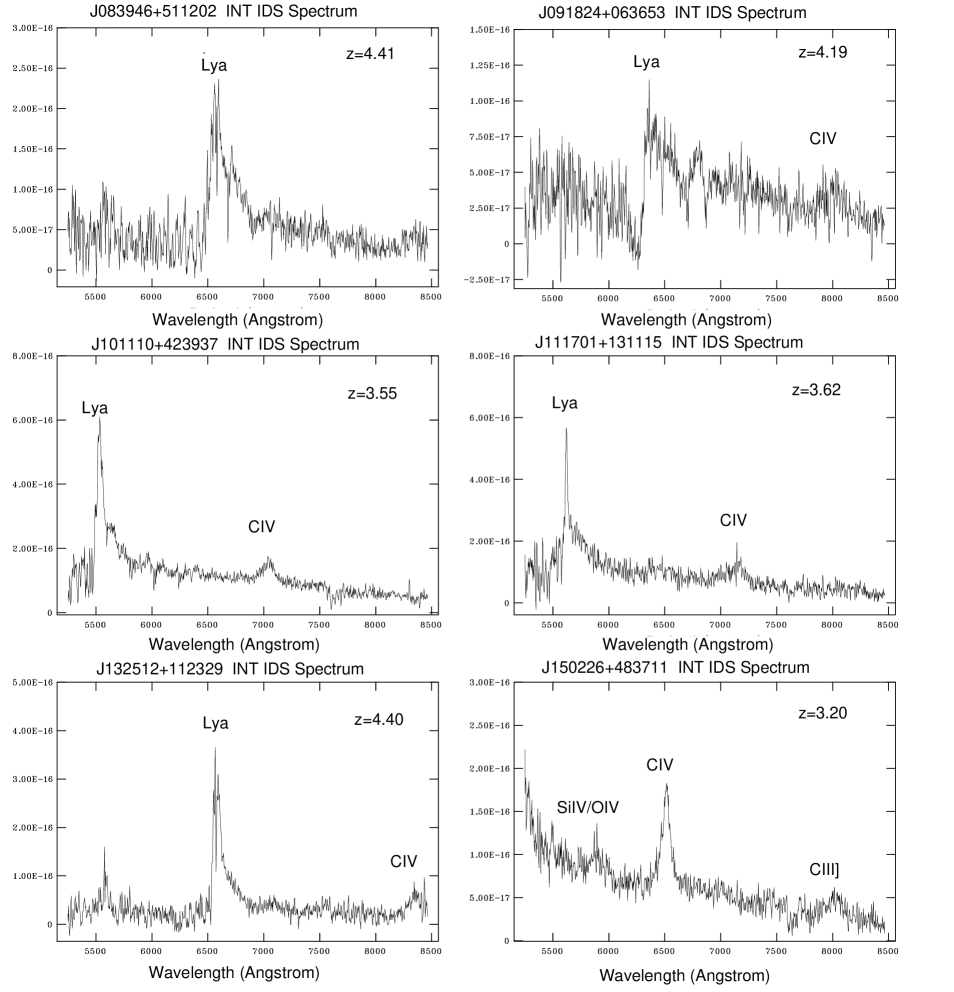
We observed for one night on the 11th of May 1999 in grey time with the 2.5m Isaac Newton Telescope (INT), as part of a programme carried out in the international CCI observing period on the La Palma telescopes in 1999. The Intermediate Dispersion Spectrograph (IDS) was used with a Tektronix CCD. A spectral resolution of was obtained between 5500 and 8500 Å, using a slit width of 2 arcseconds and a grating with 300 grooves per mm. Exposure times were 15 minutes for each object. For efficiency reasons, the orientation of the slit was kept constant, which was typically at a parallactic angle if the object was observed at zero hour angle.
The reduction of the spectra was carried out using the ‘Long Slit’ package of the NOAO’s IRAF reduction software. A bias frame was constructed by averaging ‘zero second’ exposures taken at the beginning of the night. This was subtracted from every non-bias frame. The pixel-to-pixel variations were calibrated using sky flat fields taken at twilight. Wavelength calibration was carried out by measuring the positions on the frames of known emission lines from either a Cu-Ne or Cu-Ar calibration lamp. The sky contribution was removed by subtracting a sky spectrum obtained by fitting a polynomial to the intensities measured along the spatial direction outside the vicinity of objects. One-dimensional spectra were extracted by averaging in the spatial direction over an aperture as large as the spatial extent of the brightest emission line.
| GB6 Name | R.A. | Decl. | e | o-e | z | |||
| hh mm ss.ss | dd mm ss.s | ′′ | mJy | |||||
| Quasars: | ||||||||
| J083946+511202 | 08 39 46.11 | +51 12 03.0 | 0.51 | 18.45 | 51 | +0.11 | 4.41 | |
| J091824+063653 | 09 18 24.38 | +06 36 53.4 | 0.45 | 18.68 | 36 | +0.12 | 4.19 | |
| J101110+423937 | 10 11 10.79 | +42 39 37.2 | 0.62 | 18.14 | 47 | 0.20 | 3.55 | |
| J111701+131115 | 11 17 01.91 | +13 11 15.5 | 0.88 | 18.28 | 45 | +0.32 | 3.62 | |
| J125832+290903a | 12 58 32.21 | +29 09 03.1 | 0.72 | 18.52 | 34 | +0.26 | 3.47 | |
| J132512+112329 | 13 25 12.52 | +11 23 29.8 | 0.69 | 18.77 | 62 | 0.24 | 4.40 | |
| J150226+483711 | 15 02 26.89 | +48 37 11.5 | 0.37 | 17.87 | 39 | +0.16 | 3.20 | |
| J151003+570243b | 15 10 02.93 | +57 02 43.4 | 0.41 | 18.88 | 292 | +0.50 | 4.30 | |
| J160523+303837a | 16 05 23.70 | +30 38 37.2 | 2.45 | 18.12 | +2.2 | 56 | -0.20 | 2.67 |
| J174614+622654b | 17 46 13.98 | +62 26 54.2 | 0.14 | 18.29 | 589 | 0.24 | 3.89 | |
| Galaxies/Featureless: | ||||||||
| J103039+580611 | 10 30 39.59 | +58 06 10.9 | 0.34 | 18.09 | 80 | 0.27 | ||
| J120542+332147 | 12 05 42.85 | +33 21 44.2 | 2.59 | 17.30 | 57 | +0.08 | ||
| J121506+534953 | 12 15 06.01 | +53 49 53.8 | 0.09 | 18.00 | 54 | 0.02 | ||
| J125204+134450 | 12 52 04.13 | +13 44 49.9 | 0.98 | 18.79 | 52 | 0.02 | ||
| J130125+284254a | 13 01 23.41 | +28 42 53.7 | 1.03 | 18.86 | 35 | +0.84 | 0.42 | |
| J134731+055233 | 13 47 31.47 | +05 52 33.4 | 0.90 | 18.54 | 81 | 0.43 | ||
| J135449+172604 | 13 54 49.90 | +17 26 04.0 | 0.22 | 18.66 | 34 | +1.59 | ||
| J141842+235816 | 14 18 42.80 | +23 58 16.0 | 0.66 | 18.39 | 48 | +0.06 | ||
| J145802+465744 | 14 58 02.66 | +46 57 45.2 | 0.65 | 18.72 | 31 | 0.19 | ||
| J153345+060814 | 15 33 45.58 | +06 08 14.4 | 0.63 | 18.95 | 49 | 0.13 | ||
| J154023+614627 | 15 40 23.78 | +61 46 26.5 | 0.63 | 18.47 | 49 | 0.14 | ||
| J164213+244159 | 16 42 13.29 | +24 41 58.9 | 0.38 | 18.79 | 30 | +0.09 | ||
| J164820+503903 | 16 48 20.27 | +50 39 03.6 | 1.56 | 18.80 | 45 | 0.29 | ||
| Stars: | ||||||||
| J080131+545419 | 08 01 31.54 | +54 54 20.3 | 1.55 | 18.74 | 37 | +0.12 | Star | |
| J110938+251350 | 11 09 38.14 | +25 13 47.9 | 2.93 | 17.07 | 108 | 0.29 | Star | |
| a Observed by Hook et al. 1998 | ||||||||
| b Observed by Hook et al. 1996 | ||||||||
5 Results and Discussion
The results of the observations are shown in table 2. Column 1 gives the J2000 name, columns 2 and 3 give the J2000 right ascension and declination for the optical APM position. Column 4 gives the optical-radio position offset in arcseconds. Columns 5 and 6 give the band magnitude and optical colour. Column 7 and 8 give the GB6 5GHz flux density and 1.45 GHz radio spectral index, and column 9 gives the measured redshift. For completeness we include the four quasars previously observed by Hook et al. (1996, 1998).
Observations of the 20 previously unknown sources revealed 6 quasars (of which 3 are located at ), 12 galaxies or featureless objects, and two galactic stars (which are most likely coincidental foreground objects). The redshift of all but 2 objects was determined from Ly1216 and CIV1549 in emission. The redshifts of J083946+511202 and J132512+112329 were determined from the associated Ly1216 absorption in these objects which coincide with their broad Ly1216 emission. For both objects, the CIV1549 is red-shifted just to the edge of the observed wavelength band, making it difficult to determine the redshift for this line. J083946+511202 shows NV1240 emission at a redshift consistent with the Ly absorption. The Ly emission of J091824+063653 is almost completely absorbed, and only a very crude redshift can be determined from the broad CIV1549 of z=4.19. The strong Ly absorption, which may be caused by the host-galaxy, is accompanied by several absorption lines at z=4.147 of OI, SI, SiII, OIV, SiIV and CIV (see figure 2).
Considering all 27 objects in our final sample (including the 7 objects with previously measured redshifts), the selection criteria used resulted in a success-rate for finding quasars of 1:7, which is a clear improvement over previous studies (1:150, Hook et al. 1996). Note however, that a negative consequence of this method is a lower magnitude limit and incompleteness for quasars located at .
Figure 3 shows the rest-frame 5 GHz radio luminosity of radio-loud quasars at from radio-selected samples (diamonds), optically selected sampled (crosses; Stern et al. 2000), and from this sample (boxes). Where possible, we used the observed 1.4 GHz flux density to compute the rest-frame 5 GHz luminosity assuming a flat spectral index and H0=50 km sec-1 Mpc-1 and =1. The sample bridges the gap between the strong radio surveys with mJy and the samples of radio-weak quasars that are generated via radio observations of optically selected quasars.
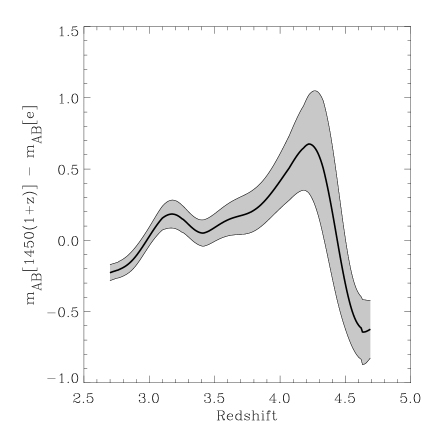
Figure 4 shows the colours of radio-loud quasars as function of redshift, for the quasars in our sample (diamonds), of Hook et al. (1996-squares; 1998-crosses), and of the remaining quasars available in the literature (stars). It shows that the colour-cutoff of , used to select the sample, is unlikely to have caused quasars to be excluded. We can therefore assume that the 4 quasars are all the radio-loud quasars with mJy, and in the targeted area of sky. This corresponds to a surface density of 1 per 1600 square degrees. Note that the use of the POSS-I plates produces a strong bias against quasars at , which is shown in figure 5, and that we are therefore only targeting objects located at . The surface density we find is about a factor 15 lower than what is found in a similar study targeting radio-quiet quasars at by Storrie-Lombardi et al. (1998), and implies that the fraction of quasars that are very radio-loud is about 7%.


6 Summary
We have reported on the search for distant radio-loud quasars in the CLASS survey of flat spectrum radio sources. Unresolved optical counterparts were selected, as measured from APM scans of POSS-I plates, with and red colours, in an effective area of deg2. Four sources where found to be radio-loud quasars with , of which one was previously known. In addition, 4 new quasars at have been found. The selection criteria used result in a success-rate of 1:7 for radio-loud quasars at , which is a significant improvement over previous studies. It corresponds to a surface density of 1 per 1600 deg2, which is about a factor of 15 lower than that found in a similar search for radio-quiet quasars at . The study presented here is strongly biased against quasars at , since the -passband of the POSS-I only samples the spectra shortward of 1200 at these redshifts.
Acknowledgements
We thank the Comité Científico International (CCI) of the IAC for the allocation of observing time. The Isaac Newton Telescope is operated on the island of La Palma by the Isaac Newton Group in the Spanish Observatorio del Roque de los Muchachos of the Instituto de Astrofísica de Canarias. The NASA/IPAC Extragalactic Database (NED) is operated by the Jet Propulsion Laboratory, California Institute of Technology, under contract with the National Aeronautics and Space Administration. This research was funded by the European Commission under contract ERBFMRX-CT96-0034 (CERES). RGM thanks the Royal Society for support.
References
- [1] van Breugel W., 2000, in Proceedings SPIE Vol. 4005, eds. J. Bergeron, p.83
- [2] Condon J.J, Broderick J.J., 1986, Astronomical Journal 91, 1051
- [3] Condon J.J., Cotton W.D., Greisen E.W., Yin Q.F., Perley R.A., Taylor G.B., Broderick J.J., 1998, Astronomical Journal, 115, 1693
- [4] Efstathiou G., Rees M.J., 1988, Monthly Notices of the R.A.S. 230, 5
- [5] Gregg M.D., Becker R.H., White R.L., Helfand D.J., McMahon R.G., Hook I.M., 1996, Astronomical Journal, 112, 407
- [6] Gregory P.C., Condon J.J., 1991, Astrophys. J. Suppl. 75, 1011
- [7] Gregory P.C., Scott W.K., Douglas K., Condon J.J., 1996, Astrophys. J. Suppl. 103, 427
- [8] Hook I.M., McMahon R.G., Patnaik A.R., Browne I.W.A., Wilkinson P.N., Irwin M.J., Hazard C., 1995, Monthly Notices of the R.A.S. 273, 63
- [9] Hook I.M., McMahon R.G., Irwin M.J., Hazard C., 1996, Monthly Notices of the R.A.S. 282, 1274
- [10] Hook I.M., Becker R.H., McMahon R.G., White R.L., 1998, Monthly Notices of the R.A.S. 297, 1115
- [11] Hook I.M., McMahon, 1998, Monthly Notices of the R.A.S. 294, L7
- [12] Jarvis M.J., Rawlings S., 2000, Monthly Notices of the R.A.S., 319 121
- [13] Kauffmann G., Haehnelt M., 2000, Monthly Notices of the R.A.S. 311, 576
- [14] McMahon R.G., Irwin M.J., 1991, in Proceedings of the conference on “Digitised Optical Sky Surveys”, eds. H.T. MacGillivray, E.B. Thomson (Kluwer Academic Publishers, Dordrecht), p. 417
- [15] Myers S.T. et al. 2001 (in prep.)
- [16] Rengelink R.B., Tang Y., de Bruyn A.G., Miley G.K., Bremer M.N., Röttgering H.J.A., Bremer M.A.R., 1997, Astr. & Astrophys. Suppl. 124, 259
- [17] Schmidt M., Schneider D.P., Gunn J.E., 1995, Astronomical Journal 110, 68
- [18] Shaver P.A., Wall J.V., Kellermann K.I, 1996, Monthly Notices of the R.A.S. 278, 11
- [19] Shaver P.A., Hook I.M., Jackson C.A., Wall J.V., Kellermann K.I., 1999, in “Highly redshifted radio lines”, ASP Conf. Series 156, 163
- [20] Snellen I.A.G., McMahon R.G., Hook I.M., Browne I.W.A., 2001, (in prep.)
- [21] Stern D., Djorgovski S.G., Perley R.A., de Carvalho R.R., Wall J.V., 2000, Astronomical Journal 119, 1526
- [22] Storrie-Lombardi L.J., McMahon R.G., Irwin M.J., Hazard C., 1996, Astrophysical Journal 468, 121
- [23] van Breugel W., 2000, in Proceedings of the SPIE conference on Discoveries and Research Prospects from 8 - 10 Meter - Class Telescopes (in press)
- [24] Warren S.J., Hewett P.C., Osmer P.S., 1994, Astrophysical Journal 421, 412
- [25] White R.L., Becker R.H., Helfand D.J., Gregg M.D., 1997, Astrophysical Journal 475, 479
- [26] Zickgraf F.-J., Voges W., Krautter J., Thiering I., Appenzeller I., Mujica R., Serrano A., 1997, Astronomy & Astrophysics 323, L21