A Chandra Observation of M51: Active Nucleus and Nuclear Outflows
Abstract
We present a Chandra ACIS-S observation of the nuclear region of the nearby spiral galaxy M51 (NGC 5194), which has a low-luminosity Seyfert 2 nucleus. The X-ray image shows the nucleus, southern extranuclear cloud, and northern loop, the morphology of the extended emission being very similar to those seen in radio continuum and optical emission line images. The X-ray spectrum of the nucleus is well represented by a model consisting of soft thermal plasma with keV, a very hard continuum, and an Fe K emission line at 6.45 keV with an equivalent width of 2 keV. The very strong Fe line and the flat continuum indicate that the nucleus is obscured by a column density in excess of cm-2 and the spectrum is dominated by reflected emission from cold matter near the nucleus. The X-ray spectra of the extranuclear clouds are well fitted by a thermal plasma model with keV. This spectral shape and morphology strongly suggest that the clouds are shock heated by the bi-polar outflow from the nucleus. The shock velocities of the extranuclear cloud and northern loop inferred from the temperatures of the X-ray gas are 690 km s-1 and 660 km s-1, respectively. By assuming a steady-state situation in which the emission of the extranuclear clouds is powered by the jets, the mechanical energy in the jets is found to be comparable to the bolometric luminosity of the nucleus.
1 Introduction
M51 (NGC 5194) is a nearby (distance 8.4 Mpc; Feldmeier et al. 1997) spiral galaxy hosting a low-luminosity active galactic nucleus (AGN). The nucleus shows optical emission lines and is classified as a Seyfert 2 (e.g., Ford et al. 1985; Ho, Filippenko, & Sargent 1997). Radio continuum and optical emission-line observations reveal a bi-polar structure comprising a southern extranuclear cloud (hereafter XNC) and a northern loop; this morphology and the high gas velocities observed are indicative of nuclear outflow (Ford et al. 1985, Cecil 1988, Crane & van der Hulst 1992). A radio jet connecting the nucleus and the XNC is also seen in a 6 cm image (Crane & van der Hulst 1992). The optical emission-line clouds are inferred to be heated by the jet emanating from the nucleus.
X-ray observations are a powerful tool to investigate the physical nature of these phenomena. However, the spatial resolution of previous observations is not good enough to resolve the structures in the nuclear region. In the soft X-ray regime, extended nuclear emission was detected with the Einstein HRI (Palumbo et al. 1985), the ROSAT PSPC (Marston et al. 1995), and the ROSAT HRI (Ehle, Pietsch, & Beck 1995; Roberts & Warwick 2000), but only a hint of enhanced emission in the direction towards the XNC is seen in the ROSAT HRI data. The spectrum of the nuclear region obtained with the ROSAT PSPC is very soft. Hard X-ray emission,with an X-ray luminosity of 9 ergs s-1 (2–20 keV) was detected by Ginga and interpreted as a combination of low-mass X-ray binaries in the host galaxy and a highly absorbed AGN (Makishima et al. 1990). Subsequently, ASCA detected a strong Fe K emission line with an equivalent width (EW) of 1 keV, which probably comes from the heavily obscured AGN, as well as emission from thermal plasma with a temperature of 0.5 keV. The 2–10 keV luminosity of the entire galaxy measured by ASCA was ergs s-1 which is about six times smaller than that obtained with Ginga in the same band (Terashima et al. 1998). The reason for this large difference in luminosities has recently been clarified by BeppoSAX observations. Fukazawa et al. (2001) find that the nucleus is photoelectrically absorbed below 10 keV, but seen directly through the absorption at 20 keV, implying an absorbing column of = cm-2. The 2–10 keV luminosity measured by BeppoSAX was similar to that of ASCA. Fukazawa et al. (2001) attributed the higher Ginga luminosity to variability of the absorbing column, as long as the Ginga measurement is not contaminated by nearby bright sources. None of these X-ray studies has sufficient spatial resolution to resolve the nucleus and outflows seen in radio continuum and optical [N II]6548,6583 images.
High spatial resolution X-ray observations with the Chandra X-ray observatory can easily resolve the multiple components in the nuclear region and enable us to study the physical nature of the nucleus and outflows, as well as the various X-ray sources in the host galaxy. In this Letter, we present Chandra results on the nuclear region of NGC 5194. Results on the diffuse X-ray emission and discrete X-ray sources seen in the host galaxy will be presented in a future paper. At the distance of 8.4 Mpc, 1 arcsec corresponds to 40.7 pc.
2 Observation and Data Analysis
M51 was observed on 2000 June 20 with the Chandra Advanced CCD Imaging Spectrometer (ACIS; Garmire et al. 2001, in preparation). M51 was located on the back illuminated CCD chip S3. The data were reduced using the CIAO software version 1.1.5. Gain correction was made using the latest calibration files. We used only ASCA event grades 0, 2, 3, 4, and 6 (see Chandra Proposer’s Observatory Guide, 2000). The background was stable during the observation and a net exposure time of 14865 sec was obtained. The count rates of all the detected sources in the field were relatively low and effects of pileup were negligible. Spectral fits were performed using XSPEC version 11.0 and all the quoted errors are 90% confidence range for one parameter of interest.
3 Results and Discussion
3.1 X-ray Images
Our Chandra image of NGC 5194 shows X-rays from a bright nuclear region, diffuse emission distributed over the host galaxy, and many discrete sources. The companion galaxy NGC 5195 is also detected in the same field. In this Letter, we concentrate on the nuclear region of NGC 5194.
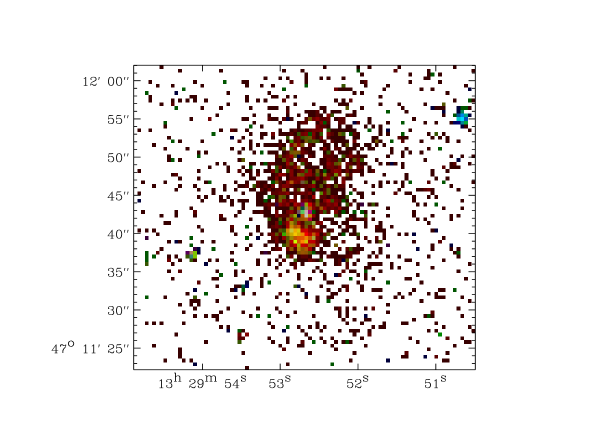
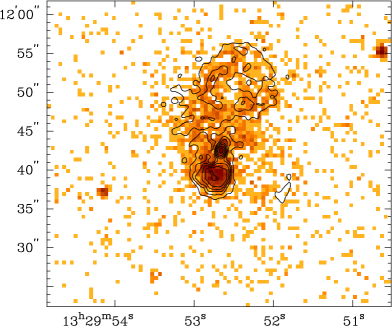
An expanded image of the central region of NGC 5194 in the 0.5–8 keV band is shown in Figs 1 and 2. In Fig. 1, red, green, and blue colors correspond to the energy bands 0.5–1.3, 1.3–3, and 3–8 keV, respectively. The nucleus, extended features, and a few discrete sources are seen. The extended structures north and south of the nucleus are remarkably similar to the features seen in radio (6 cm , 20 cm) and [N II] images, and we refer to them as the northern loop and the XNC, respectively. Fig. 2 shows a 20 cm image (contours, from Ford et al. 1985) overlaid on a Chandra image in the 0.5–8 keV band. Both images have resolution and a close correspondence is seen between the two maps. The nuclei were aligned by shifting the X-ray image by 0.4′′.
The color (=hardness) map (Fig. 1) shows that the nucleus has a hard spectrum while the XNC and the northern loop are soft. A spectral analysis (next subsection) shows that the nucleus emits both hard and soft spectral components, the latter being very similar to the spectra of the XNC and northern loop. The north-east part of the XNC is somewhat harder than the rest of the XNC and the northern loop. It is intriguing to note that this region coincides with a bright knot in the [N II] image from which the broadest optical emission lines (extending over km s-1) are found (the point P in Cecil 1988). It is also worth noting that the elongation of the nucleus seen in [N II] is towards the point P, and that the radio jet connects the nucleus and point P (Crane & van der Hulst 1992). Thus this medium-hardness region might be the site where the jet emanating from the nucleus is currently interacting with the interstellar medium and shock heating it.
3.2 X-ray spectra
3.2.1 Nucleus
The spectrum of the nucleus was extracted from a circular region with a radius of 1.5 arcsec. The spectrum was binned so that each bin contains at least three counts in order to enhance the visibility of the narrow Fe-K emission line. In this case, a chi-squared fit is not adequate and a maximum-likelihood method using the C-statistic (Cash 1979) was employed. In the fit with the C-statistic, background cannot be subtracted, so we first constructed a model of the background spectrum. This background model was obtained from an area away from the nucleus, which includes diffuse emission in the host galaxy. The spectrum from this area was fitted by a two temperature (=0.23 keV, 0.60 keV; abundance 0.16 solar) plasma model plus a flat power law. This fixed background model was then added to the model for the nucleus after normalizing by the geometrical area.
The spectrum of the nucleus (Fig. 3a) consists of at least three components, namely a soft component showing emission lines from ionized species, a hard component which dominates the 3–8 keV band, and a strong emission line at 6.4 keV. We modeled the soft component with the optically-thin thermal plasma model MEKAL. Two models were examined for the hard component: an absorbed power law or pure reflection from almost face-on cold matter (Magdziarz & Zdziarski 1995). The latter corresponds to a situation in which the X-ray emission from the nucleus is almost completely obscured by a column density in excess of cm-2 and only emission scattered by matter near the nucleus is observed. We added a Gaussian component to represent the emission line at 6.4 keV. The absorbed power law and pure reflection model provide a similar quality of fit (C-statistic = 39.1 and 39.6, respectively). The spectral parameters obtained are summarized in Table 1.
In the case of the best-fit absorbed power law model, we fixed the photon index of the power law component at 2.0 (typical of unobscured AGN) and obtained an absorption column density of = cm-2. The emission line centroid energy and equivalent width (EW) are keV (source rest frame) and keV, respectively. Although this model can describe the data, the very large EW of the Fe line is not compatible with the relatively small absorption column ( cm-2), from which an Fe line with much lower EW ( eV) is expected (e.g, Awaki et al. 1991; Leahy & Creighton 1993; Ghisellini, Haardt, & Matt 1994 ).
The center energy, line width, and EW of the strong emission line in the pure reflection model are keV at the source rest frame, = 0.020 (0.099) keV, and keV, respectively. This line centroid energy is consistent with fluorescent iron emission from neutral or low-ionization state ( FeXIX) iron when possible small calibration uncertainties are taken into account. The line intensity of photons cm-2 s-1 is consistent with that obtained with an ASCA observation (Terashima et al. 1998), although the error ranges are large. The huge EW (2.4 keV) is difficult to explain even in the pure reflection picture and probably an overabundance of iron is required (Matt, Fabian, & Reynolds 1995). Such a large equivalent width is also seen in other Compton thick Seyfert 2s such as the Circinus galaxy (Matt et al. 1996). The X-ray luminosity of the reflection component in M51 is ergs s-1 in the 2–10 keV band. Although this luminosity is nine times smaller than the total 2–10 keV luminosity of M51 observed by ASCA, X-ray binaries contribute significantly to the ASCA luminosity (Terashima et al. 1998). Therefore, the smaller luminosity obtained with Chandra does not imply time variability of the AGN. Recently BeppoSAX observations have shown that the nucleus is heavily absorbed by a column density of = cm-2 and the intrinsic luminosity corrected for the absorption is ergs s-1 in the 2–10 keV band (Fukazawa et al. 2001). Thus, the luminosity obtained with Chandra is about 1% of the intrinsic X-ray luminosity, implying that 1% of the nuclear luminosity is scattered in our direction.
The soft component (Fig. 3a) is well represented by a MEKAL plasma model (Table 2). The obtained absorption column density is only slightly larger than the Galactic value ( cm-2, Stark et al. 1992) given the large errors. The emission measure is cm-3 and the luminosity corrected for the absorption is ergs s-1 in the 0.5–4 keV band. The temperature and abundance are quite similar to the extended emission (the XNC and north loop). The gas may be shock heated as discussed below.
3.2.2 Southern Extranuclear Cloud and Northern Loop
We extracted X-ray spectra of the southern extranuclear cloud (XNC) and the northern loop. A background spectrum was obtained from a region free of the nuclear emission. Bright point sources in this region were excluded. This background spectrum was then subtracted from the spectra of the XNC and northern loop. The spectra were binned so that at least 15 counts were contained in each bin, so chi-squared statistics can be used.
The two spectra (Fig. 3b and c) show emission lines which are indicative of optically thin thermal plasma emission with a temperature below 1 keV. Therefore, we fitted the spectra with the MEKAL model modified by photoelectric absorption along the line of sight. This model provides successful descriptions of both the XNC and the northern loop. The results of the spectral modeling are shown in Table 2.
The spectral parameters obtained for the XNC are keV, abundance solar, and = cm-2. We note that the abundance values in all the fits in this paper are unusually low for the central regions of spiral galaxies and are similar to other X-ray measurements of abundance of spiral galaxies and starburst galaxies. The reason for these unphysically low abundances is unknown, but may involve systematic errors in modeling thermal plasmas, nonthermal continuum contributions, or depletion of gas phase elements onto grains (Netzer & Turner 1997, Arimoto et al. 1997, Dahlem et al. 2000, Matsushita et al. 2000) and does not necessarily mean real low abundance. The luminosity (corrected for absorption) and emission measure are ergs s-1 in the 0.5–4 keV band and cm-3, respectively. If we assume a simple spherical shape with a radius of 80 pc and a filling factor of the X-ray emitting gas, we can derive some physical quantities. The density , gas mass , and the thermal energy are determined as cm-3, , and ergs, respectively.
This thermal plasma is expected from shock heating due to outflows. The expected postshock temperature is K, where is the shock velocity in units of 100 km s-1, if the preshock medium is fully ionized and the helium abundance is 10% of hydrogen by number (Hollenbach and McKee 1979). Using this relation, the shock velocity is determined as 690 km s-1 from the observed temperature of the XNC. This shock velocity is roughly consistent with that determined from [N II] observations (500 km s-1; Cecil 1988). The XNC shows LINER-like optical emission lines (Ford et al. 1985). The emission line ratios [O I]/H, [O III]/H, and [S II]/H are in the range expected from fast shocks without precursors for a shock velocity of 300–500 km s-1, as calculated by Dopita & Sutherland (1995, 1996). The observed [N II]/H ratio is larger than predicted by the shock model and could be due to an overabundance of nitrogen, as often suggested previously. Thus the optical emission line ratios are consistent with fast shocks and reinforce a shock interpretation of the origin of the extranuclear clouds.
The spectral parameters for the northern loop are keV, abundance solar, and = cm-2. The luminosity (corrected for absorption) and emission measure are ergs s-1 in the 0.5–4 keV band and cm-3, respectively. As in the case of the XNC, we determine physical parameters of the X-ray gas by assuming a simple geometry. Here we assume a spherical shell with an outer radius of 200 pc and a thickness of 40 pc, and a volume filling factor of . The parameters obtained for the hot gas are cm-3, , and ergs.
The X-ray spectral shape (i.e. the model’s and abundance), X-ray morphology, and optical emission line properties of the northern loop are quite similar to the XNC and suggest a similar origin to the XNC, i.e., shock heating by nuclear outflows. The shock velocity required to heat the gas to =0.53 keV is 660 km s-1, almost the same shock velocity as obtained for the XNC. The fact that the northern loop is much larger than the XNC suggests that it is an older structure.
The total radiative luminosity of the shock heated gas () can be estimated from the H luminosities (Ford et al. 1985) by assuming the shock model (Dopita & Sutherland 1995, 1996). A value ergs s-1 is obtained. This luminosity is comparable to the photon luminosity of the nucleus if an intrinsic X-ray luminosity of ergs s-1 (Fukazawa et al. 2001) and a bolometric correction of a factor of ten (Ho 1999) are assumed. If the shock-heated gas is, indeed, powered by the jets, which are assumed to be steady, the mechanical and radiative outputs of the nucleus are then similar to within the considerable uncertainties.
4 Concluding Remarks
Our Chandra observations have shown that the X-ray morphology of the extranuclear regions of NGC 5194 is very similar to that seen in radio continuum and optical emission-line imaging. The X-ray spectra of the extranuclear cloud and the northern loop are well described by thermal plasma models with 0.5–0.6 keV. This temperature is close to that expected from shock heating given the range of velocities seen (500 km s-1) in optical emission-line spectra. The optical emission-line ratios also agree with models involving shocks with velocities in the range 300–500 km s-1. Further, the location with the hardest X-ray spectrum in the extranuclear cloud coincides with the region exhibiting the broadest optical lines ( km s-1). This location is also apparently the terminus of the radio jet. All of these findings indicate that the extranuclear gas is shock heated by nuclear jets and/or other collimated outflows.
The nucleus itself exhibits a soft X-ray spectrum which is very similar to that of the extranuclear gas. We presume that this gas is also shock heated by mass outflows. In addition, the nucleus shows a very hard continuum and an iron line with equivalent width in excess of 2 keV. This spectrum arises through reflection of the radiation from a compact nuclear source with a power law spectrum by cold matter in its vicinity. The nuclear source itself is obscured by a large column density of gas (= cm-2) and is only seen directly above 10 keV (Fukazawa et al. 2001).
References
- Arimoto et al. (1997) Arimoto, N., Matsushita, K., Ishimaru, Y., Ohashi, T., & Renzini, A. 1997, ApJ, 477, 128
- Awaki et al. (1991) Awaki, H., Koyama, K., Inoue, H., & Halpern, J. P. 1991, PASJ, 43, 195
- Cash (1979) Cash, W. 1979, ApJ, 228, 939
- Cecil (1988) Cecil, G. 1988, ApJ, 329, 38
- POG (2000) Chandra Proposer’s Observatory Guide 2000, (Chandra X-ray Center: Cambridge, MA)
- Crane (1992) Crane, P. C., & van der Hulst, J. M. 1992, AJ, 103, 1146
- Dahlem et al. (2000) Dahlem, M., Parmar, A., Oosterbroek, T., Orr, A., Weaver, K. A., & Heckman, T. M. 2000, ApJ, 538, 555
- Dopita (1995) Dopita, M. A., & Sutherland, R. S. 1995, ApJ, 455, 468
- Dopita (1996) Dopita, M. A., & Sutherland, R. S. 1996, ApJS, 102, 161
- Ehle (1995) Ehle, M., Pietsch, W., & Beck, R. 1995, A&A, 295, 289
- Feldmeier et al. (1997) Feldmeier, J. J., Ciardullo, R., & Jacoby, G 1997, ApJ, 479, 231
- Ford et al. (1985) Ford, H. C., Crane, P. C., Jacoby, G. H., Lawrie, D. G., van Der Hulst, J. M. 1985, ApJ, 293, 132
- Fukazawa et al. (2001) Fukazawa, Y., Iyomoto, N., Kubota, A., Matsumoto, Y., & Makishima, K. 2001, A&A, submitted
- Ghisellini et al. (1994) Ghisellini, G., Haardt, F., & Matt, G. 1994, MNRAS, 267, L17
- Ho (1999) Ho, L. C. 1999, ApJ, 516, 672
- Ho et al. (1997) Ho, L. C., Filippenko, A. C., & Sargent, W. L. W. 1997, ApJS, 112, 315
- Hollenbac & McKee (1979) Hollenbach, D., & McKee, C. F. 1979, ApJS, 41, 555
- Leahy & Creighton (1993) Leahy, D. A., & Creighton, J. 1993, MNRAS, 263, 314
- Magdziarz & Zdziarski (1995) Magdziarz, P. & Zdziarski, A. A. 1995 MNRAS, 273, 837
- Makishima et al. (1990) Makishima, K., Ohashi, T., Kondo, H., Palumbo, G. G. C., & Trinchieri, G. 1990, ApJ, 365, 159
- Marston et al. (1995) Marston, A. P., Elmegreen, D., Elmegreen, B., Forman, W., Jones, C., & Flanagan, K. 1995, ApJ, 438, 663
- Matsushita et al. (2000) Matsushita, K., Ohashi, T., & Makishima, K. 2000, PASJ, 52, 685
- Matt et al. (1995) Matt, G., Fabian, A. C., & Reynolds, C. S. 1995, MNRAS, 289, 175
- Matt et al. (1996) Matt, G. et al., 1996, MNRAS, 281, L69
- Netzer & Turner (1997) Netzer, H., & Turner, T.J. 1997, ApJ, 488, 694
- Palumbo et al. (1985) Palumbo, G. C. C., Fabbiano, G., Fransson, C., & Trinchieri, G. 1985, ApJ, 298, 259
- Roberts & Warwick (2000) Roberts, T. P. & Warwick, R. 2000, MNRAS, 315, 98
- Stark et al. (1992) Stark, A. A., Gammie, C. F., Wilson, R. W., Bally, J., Linke, R. A., Heiles, C., & Hurwitz, M. 1992, ApJS, 79, 77
- Terashima et al. (1998) Terashima, Y., Ptak, A. F., Fujimoto, R., Itoh, M., Kunieda, H., Makishima, K., & Serlemitsos, P. J. 1998, ApJ, 496, 210
| Model | photon index | Width | EW | Luminosityb | C-statistic | ||
|---|---|---|---|---|---|---|---|
| [ cm-2] | [keV] | [keV] | [keV] | [ ergs s-1] | |||
| 1 | 2.0c | 1.1 | 39.1 | ||||
| 2 | 2.0c | 0.98 | 39.5 |
| abundance | Luminositya | /dof | |||
|---|---|---|---|---|---|
| [ cm-2] | [keV] | [solar] | [ ergs s | ||
| Nucleusb | 0.45 | … | |||
| XNC | 1.5 | 53.9/47 | |||
| Northern Loop | 2.0 | 44.9/50 |