FUSE Observations of Capella
Abstract
Far Ultraviolet Spectroscopic Explorer (FUSE) observations of the bright binary system Capella ( Aurigae; G1 III + G8 III) reveal a rich emission line spectrum containing neutral and ionic species, among them H i, O i, C iii, O vi, S vi, Ne v and Ne vi. In addition the Fe xviii 974.85 Å line, formed at temperatures of K, is detected. Whereas the chromospheric and transition region emission is dominated by that from the G1 giant, consistent with results from previous ultraviolet observations, Fe xviii is formed largely in the G8 giant atmosphere. Line ratios from C iii suggest densities of 2–81010 cm-3, although anomalous line profiles of the 1176 transition may signal optical depth effects. The hydrogen Lyman series, detected for the first time, displays asymmetric emission consistent with an expanding atmosphere.
1 Introduction
The Capella system ( Aurigae = HR 1708 = HD 34029), consisting principally of two nearby cool giant stars (G1 III + G8 III) forming a spectroscopic binary, has long been a popular object because it is a bright target at virtually all energies. In the far ultraviolet (900–1200 Å), Capella was first observed with Copernicus in H Ly and O vi 1032 (Dupree 1975), and subsequently with HUT (Kruk et al. 1999) and the Orbiting Retrievable Far and Extreme Ultraviolet Spectrometers (ORFEUS I). High resolution data with the International Ultraviolet Explorer (IUE; Ayres 1988) and the Hubble Space Telescope Goddard High Resolution Spectrograph (HST/GHRS; Linsky et al. 1995) spectroscopically resolves the two giants through velocity separation. Direct UV image separation of the chromospheric and transition region emissions has also been achieved with HST (Young & Dupree 2001). Capella is a target of the PI team on FUSE, forming a part of the cool star survey and local D/H program.
2 FUSE Observations and Spectra
FUSE is described in detail by Moos et al. (2000). Four individual telescopes cover the wavelength range 905–1187 Å and they are denoted by the coatings on their optical elements: LiF1, LiF2, SiC1 and SiC2. Spectra from each channel are imaged onto two detector segments, labelled A and B so that the eight individual spectra are termed LiF1A, LiF1B, SiC1A, etc. Three apertures are available for observing: in order of decreasing size these are the LWRS, the MDRS and the HIRS. For the two smaller apertures, there is a risk of losing the target in the aperture during the observation, but they have the advantage of lower airglow contamination compared to the LWRS and so are preferred for, e.g., the study of the hydrogen Lyman series lines.
Within a single spectrum, the relative wavelength calibration is good to 5–10 km/s, but the absolute wavelength calibration of FUSE is not well determined as there is no onboard calibration lamp. The wavelength scale can be fixed, however, by making use of interstellar absorption lines which have a velocity known from other methods. For emission line sources such as cool stars, the lack of a continuum means that such absorption lines are not common. The two most commonly observed are C iii 977.020 Å and C ii 1036.337 Å which are superimposed upon the corresponding stellar emission lines. They potentially allow the wavelength scale to be set for all channels except LiF2A and LiF1B. Caution must be exercised, however, as the 977 absorption may be intrinsic to the star in some cases.
Capella was observed on 5 and 7 Nov. 2000 with the LWRS aperture (program IDs P1041301 and P1041302) for 14.2 and 12.3 ksec. A further observation of 21.2 ksec was obtained on 11 Jan. 2001 in the MDRS aperture (program ID P1041303). A loss of flux occurred in all channels in the latter observation as the target moved in the aperture making emission line fluxes unreliable. The data were processed with v.1.8.7 of the FUSE calibration pipeline. The ephemeris of Hummel et al. (1994) and the radial velocity measurements of Barlow et al. (1993) indicate that the heliocentric radial velocities of the stars during the three observations are: +7.1, +8.1, +32.8 km s-1 (G8 giant), and +52.4, +51.3 and +25.4 km s-1 (G1 giant).
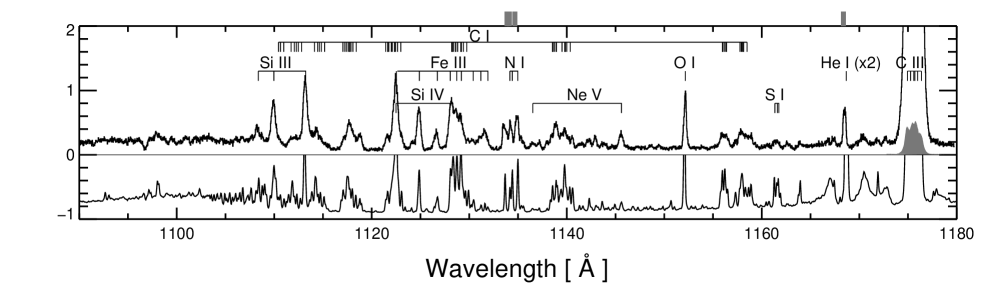
Fig. 1 shows spectra from observation P1041301 that cover the entire FUSE spectral range together with a solar spectrum. Identifications are based on the solar spectrum and predictions from CHIANTI (Dere et al. 2001) using the emission measure distribution and densities from UV and EUV observations of Capella (Brickhouse et al. 2000). The Capella spectrum is strikingly similar to the solar spectrum both in terms of the relative strengths of the stronger lines and the strengths of the numerous weaker features. The central differences lie in the broader line profiles and the presence of Fe xviii 974 (discussed later) in Capella. Some lines are proportionately weaker or stronger in the Capella spectrum, for example the N iv lines at 922–924 Å are stronger which may indicate abundance anomalies in the G8 giant as suggested in Linsky et al. (1995). The broader lines found in Capella are due both to the combined emission from the two giants and the intrinsically larger broadening of the G1 lines. We draw attention to the C i recombination continuum extending below Å to Å which is seen clearly in both spectra. Several absorption lines can be seen superimposed on this continuum and these, together with the interstellar absorption lines, will be discussed in a later paper (S. Redfield et al., in preparation).
Table 1 presents fluxes and total counts in selected emission lines. A complete line list for the spectrum is available at http://fuse.pha.jhu.edu/analysis/cool_stars/capella_linelist.html. Although dominated by the resonance lines of C iii and O vi, the spectrum exhibits a wealth of weaker lines. Elements represented include H, He, C, N, O, Ne, Si, S and Fe. We discuss features of individual lines below.
3 O VI Emission
The O vi 1032 line is unblended and displays broad wings that extend out to km s-1 from line center, which could represent microflaring activity (Wood et al. 1997) or emission from regions extending well above the stars’ surfaces. Use of the C ii 1036 absorption line to fix the wavelength of the 1032 line shows that the G1 star dominates the 1032 emission, consistent with lower temperature transition region lines observed with IUE and GHRS (Ayres 1988; Linsky et al. 1995). The O vi 1038 line is partially blended with the C ii 1037.018 Å emission line, but the 1038/1032 ratio is 1:2, indicating that the plasma is optically thin at these wavelengths.
4 C III and Chromospheric Density
The ratio of the C iii 977 and 1176 lines provides an excellent electron density diagnostic between and cm-3 for optically thin plasmas (Dupree et al. 1976). The observed flux ratio (erg units) 1176/977 from observation P1041301 equals 0.510.01 which translates to an electron density of 21010 cm-3 using atomic data from CHIANTI. The drop in the 977 flux in the second LWRS observation (Sect. 7) leads to a higher density of 81010 cm-3. The corresponding electron pressures are 2–8 K cm-3, values consistent with the C v pressure obtained by Ness et al. (2001) from Chandra spectra and would indicate constant pressure through the Capella giants’ transition regions. Much higher pressures are found at higher temperatures, based on EUV density diagnostics of Fe xix and Fe xxi which yield densities of 1012 cm-3 (Dupree et al. 1993; Brickhouse 1996), indicating inhomogeneous structures.
The derived density from the C iii lines must be treated with caution as they show evidence of optical depth effects. Fig. 2 compares the Capella 1176 profile with a simulated optically thin profile calculated using CHIANTI and assuming a cool-to-hot giant ratio of 1/5. The 1176 feature comprises six individual transitions spread over 1.5 Å and although the lower levels of the transitions belong to an excited configuration, they can have populations comparable to the ground 1S level at electron densities cm-3, allowing the possibility of photoabsorption from these levels. Clearly the strong peak expected from the 1175.711 Å transition (the strongest of the multiplet) is much weaker in Capella. This reduction in the observed strength of the 1175.711 Å line compared to the optically thin case has been observed in solar spectra taken near the limb which indicate that the 1175.711/1174.933 ratio can fall to 50% of the optically thin value (Doyle & McWhirter 1980). Further work is required to model radiative transfer in the C iii lines.
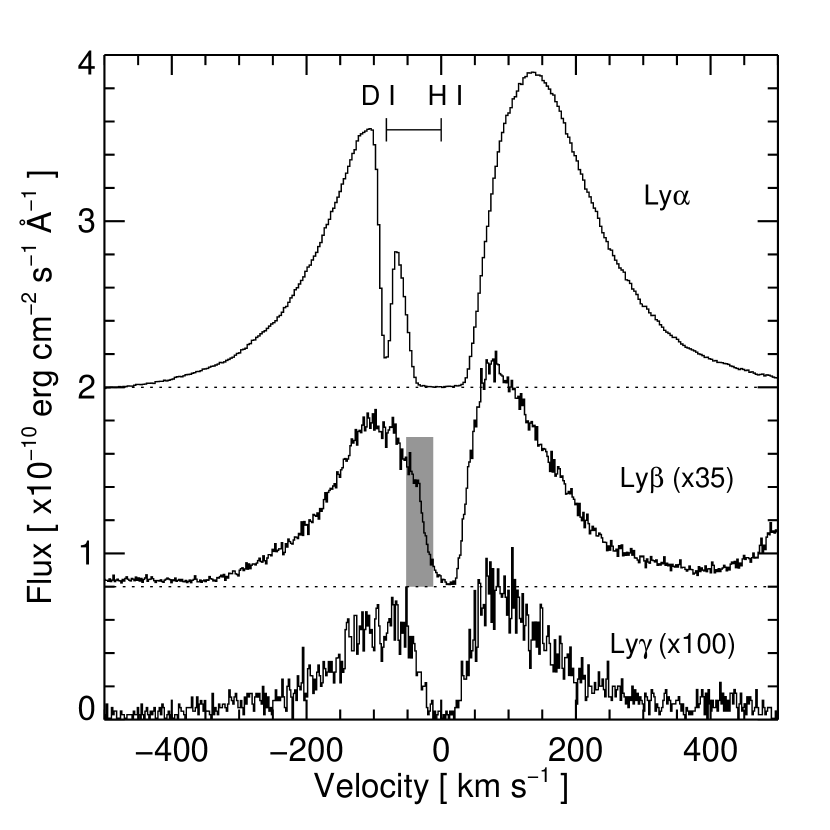
5 The Lyman Series of Hydrogen
The H i Ly line of Capella has been extensively studied in the past from Copernicus, IUE, and GHRS data. A key feature is that the red peak of the line is stronger than the blue peak at all orbital phases (Ayres 1993), suggesting that there is an outflow leading to preferential weakening of the blue wing of the line (Dupree 1975; Ayres 1993). The FUSE MDRS observation of Capella reveals, for the first time, this structure in the higher Lyman series. A possible explanation for the asymmetry is an acceleration throughout the chromosphere. Fig. 3 compares the FUSE H i Ly and H i Ly lines with the Ly line obtained in Sep. 1999 by the Space Telescope Imaging Spectrograph (STIS) on the HST.
6 Coronal Ions: Fe XVIII
For stars with coronae extending to temperatures of K, emission lines from highly-ionized ions arising from forbidden transitions within the ground configurations of the ions are expected at UV wavelengths. One of the strongest is Fe xxi 1354.064 Å, which has been observed with the GHRS in Capella (Linsky et al. 1998), and another is Fe xviii 974.85 Å which has been seen previously in solar flare spectra (Feldman & Doschek 1991) and is now accessible with FUSE. Fig. 1 shows the presence of a weak line between H i Ly and C iii 977. By comparing both CHIANTI and APEC (Smith et al. 2001) models of the Fe xviii ion with the FUSE flux, other Fe xviii lines at 15.625 Å and 93.92 Å in Chandra (Canizares et al. 2000), and Extreme Ultraviolet Explorer spectra (Brickhouse et al. 2000), we find that the FUSE 974 flux is consistent, within a factor of 2, with the X-ray lines, confirming the Fe xviii identification.
The 974 line is narrow compared to cooler emission lines in the spectrum (Table 1) with a FWHM of 92 km s-1. (The thermal width of the line is expected to be 79 km s-1 which becomes 82 km s-1 when broadened by the instrumental profile taken as 20 km s-1.) This narrow width indicates that the emission originates principally from only one of the two giants. If the nearby C iii 977 interstellar line (expected at a heliocentric radial velocity of km s-1, Linsky et al. 1993) is used to determine the absolute wavelength scale, then Fig. 4 shows that a stronger contribution (about 75% of the flux) arises from the G8 giant. To confirm this result, the centroids of the C iii 977 and S vi 933, 944 lines were measured and found to be redshifted by between 44 and 51 km s-1, relative to the Fe xviii line, in the LWRS data. C iii and S vi would be expected to be formed in the G1 atmosphere and so this confirms both the association of Fe xviii with the G8 giant and the interstellar origin of the C iii 977 absorption. This Fe xviii result contrasts with a GHRS observation obtained in September 1995 where Linsky et al. (1998) found almost equal contributions to the Fe xxi 1354 line from both stars. Further, the STIS spectrum obtained in Sep. 1999 suggests a smaller G8 contribution to the 1354 line. This result together with a discussion of these apparently conflicting GHRS, STIS and FUSE results for the relative contributions of the two giants to Capella’s high temperature emission will be presented in O.J. Johnson et al. (in preparation).
7 Variability
Monitoring of Capella with IUE revealed that chromospheric and transition region fluxes of Capella are variable only on the 5–10% level (Ayres 1991). However the higher temperature coronal emissions observed in the EUV region are constant to 30% except for species formed above 6106 K which can vary by a factor of 3 to 4 (Dupree & Brickhouse 1995; Brickhouse et al. 2000). The FUSE fluxes can be compared with those from the ORFEUS I spectrum obtained in 1993, where we find 977 and 1032 fluxes of and erg cm-2 s-1, respectively, with measurement uncertainties of around 5%. These values are in reasonable agreement with the FUSE measurements (Table 1), although the 30% difference for the 1032 line is larger than the expected absolute flux accuracy of both instruments ( 10%). The 1176 line has been measured in both IUE and GHRS spectra, with values given in Linsky et al. (1995), and consistency is found to within 20%. As the time of arrival of each photon was recorded during the Capella observations, variability can be sought during each observation; however, no significant variations in the 977, 1032 and 1176 fluxes were found down to timescales of 30 s, consistent with a lack of flaring activity. In addition no significant change occurred in the flux of the Fe xviii 974 during the FUSE observations.
8 Summary
The FUSE spectra of Capella illustrate the diagnostic opportunties available for cool star research with FUSE. Line profiles and velocities can be measured accurately, while the large number of emission lines, many from species unavailable from IUE or HST spectra, allow the temperature structure from the chromosphere through to the upper transition region to be determined. The Fe xviii 974 line extends the FUSE temperature coverage for active stars and provides crucial velocity information unavailable from EUV and X-ray data. A future paper (P.R. Young et al., in preparation) will discuss the Capella spectrum in greater detail.
References
- (1) Ayres, T. R. 1988, ApJ, 331, 467
- Ayres (1991) Ayres, T. R. 1991, ApJ 375, 704
- (3) Ayres, T. R. 1993, ApJ, 402, 710
- Barlow et al. (1993) Barlow, D. J., Fekel, F. C., & Scarfe, C. D. 1993, PASP 105, 476
- (5) Brickhouse, N. S. 1996 in IAU Colloq. 152, Astrophysics in the Extreme Ultraviolet, ed. S. Bowyer & R. Malina (Dordrecht: Kluwer), 105
- (6) Brickhouse, N. S., Dupree, A. K., Edgar, R. J., Liedahl, D. A., Drake, S. A., White, N. E., & Singh, K. P. 2000, ApJ 530, 387
- (7) Canizares, C. R. et al. 2000, ApJ 539, L41
- (8) Curdt, W., Feldman, U., Laming, J. M., Wilhelm, K., Schuehle, U., & Lemaire, P. 1997, A&AS 126, 281
- Dere et al. (2001) Dere K. P., Landi E., Young P. R., & Del Zanna G. 2001, ApJS, in press
- Doyle & McWhirter (1980) Doyle, J. G., & McWhirter, R. W. P. 1980, MNRAS 193, 947
- (11) Dupree, A. K. 1975, ApJ 200, L27
- (12) Dupree, A. K., Foukal, P. V., & Jordan, C. 1976, ApJ 209, 621
- (13) Dupree, A. K., Brickhouse, N. S., Doschek, G. A., Green, J. C., & Raymond, J. C. 1993, ApJ 418, L41
- (14) Dupree, A. K., & Brickhouse, N. S. 1995, in IAU Symp. 176, Stellar Surface Structure, Poster Proceedings, ed. K. G. Strassmeier, (Institut für Astronomie: Wien), 184
- (15) Feldman, U., & Doscheck, G. A. 1991, ApJS 75, 925
- Hummel et al. (1994) Hummel, C. A., Armstrong, J. T., & Quirrenbach, A. 1994, AJ 107, 1859
- (17) Kruk, J. W., Brown, T. M., Davidsen, A. F. et al. 1999, ApJS 122, 299
- Linsky et al. (1993) Linsky, J. L., et al. 1993, ApJ 402, 694
- Linsky et al. (1995) Linsky, J. L., Wood, B. E., Judge, P., et al. 1995, ApJ 442, 381
- Linsky et al. (1998) Linsky, J. L., Wood, B. E., Brown, A., & Osten, R. A. 1998, ApJ 492, 767
- Moos et al. (2000) Moos, H. W., et al. 2000, ApJ 538, L1
- (22) Ness, J.-U., Mewe, R., Schmitt, J. H. M. M. et al. 2001, A&A 367, 282
- (23) Smith, R. K., Brickhouse, N. S., Raymond, J. C., & Liedahl, D. A. 2001, ApJ, submitted
- (24) Young, P. R., & Dupree, A. K. 2001, ApJ, submitted
- Wood et al. (1997) Wood, B. E., Linsky, J. L., & Ayres, T. R. 1997, ApJ 478, 745
| Ion | Line | Flux 1012 | Photon counts | FWHM |
|---|---|---|---|---|
| (Å) | (erg cm-2 s-1) | (in 14174 s) | (km s-1) | |
| SiC2A | ||||
| S vi | 933.378 | a | 4,980 | 140 |
| He ii | 958b | 901 | 125 | |
| Fe xviii | 974.850 | 848 | 92 | |
| C iii | 977.020 | 219,000 | 247 | |
| LiF1A | ||||
| O vi | 1031.926 | 267,000 | 162 | |
| S iv | 1062.664 | 4,490 | 137 | |
| LiF2A | ||||
| O i | 1152.151 | 7,420 | 72 | |
| C iii | 1176c | 248,00 | 453 | |