e-mail: randich@arcetri.astro.it 22institutetext: Osservatorio Astronomico di Palermo, Piazza del Parlamento 1, I-90134 Palermo, Italy 33institutetext: Center for Astrophysics, 60 Garden St., Cambridge, MA 02138, USA 44institutetext: Department of Astronomy, University of Maryland, College Park, MD 20740, USA
Membership, lithium, and metallicity in the young open clusters IC~2602 and IC~2391: enlarging the sample ††thanks: Based on observations carried out at the European Southern Observatory, La Silla, Chile ††thanks: Tables 2–5 are also available in electronic form at the CDS via anonymous ftp to cdsarc.u-strasbg.fr (130.79.128.5) or via http://cdsweb.u-strasbg.fr/cgi-bin/qcat?
We present lithium abundances for 50 X-ray selected candidate members of the 30–50 Myr old open clusters IC 2602 and IC 2391. These data enlarge and extend to cooler temperatures previous Li surveys of these clusters by Stauffer et al. (sta89 (1989)) and Randich et al. (R97 (1997)). We also give for the first time an estimate of the metallicity of the two clusters which turns out to be close to solar. Radial velocity measurements together with H chromospheric emission and the presence/absence of other spectroscopic features are used to ascertain the membership status for the sample stars not yet confirmed as cluster members; rotational velocities have also been determined for all sample stars. Stars more massive than 1 M⊙ in both clusters show no sign of significant Li depletion, while lower mass stars are all lithium depleted, with the amount of Li depletion increasing to cooler temperatures. We confirm that the late G and early K stars in IC 2602 present a star-to-star scatter in Li abundances similar to, but not as large as the one in the Pleiades. A scatter is also seen among late–K and M dwarfs. Unlike in the Pleiades and Alpha Per clusters, the scatter among early–K stars in IC 2602 shows only marginal correlation with rotation. Our data suggest that the drop-off of lithium towards lower masses may start at an earlier color in IC 2391 than in IC 2602, but larger cluster samples are needed to confirm this result. In addition, whereas G and early K stars in the two clusters are, on average, more Li rich than their counterparts in the Pleiades, a fraction of the coolest stars, in particular in IC 2391, are as depleted as the lowest-Li Pleiades stars of the same mass. If they continue depleting Li on their way to the main sequence, they are expected to be more Li depleted than the Pleiades at the age of the latter cluster.
Key Words.:
open clusters and associations: individual: IC 2602 – open clusters and associations: individual: IC 2391 – stars: abundances – stars: interiors1 Introduction
Several papers in the last decade have addressed the issue of the evolution of lithium abundance in solar–type and lower mass stars as traced by open clusters of different ages and metallicities. We refer to the most recent reviews on this topic for a detailed discussion of the current status of our understanding of the so-called “Lithium problem” (e.g., Deliyannis del00 (2000); Jeffries jef00 (2000); Pasquini pas00 (2000)) and briefly summarize here the main results and open questions raised by lithium surveys of open clusters. It is now well established that “standard” models, i.e., models including convection only as mixing mechanism, are unable to explain the complex picture emerging from the observational data. Extra–mixing processes and/or mechanisms that inhibit mixing and lithium destruction are indeed required. Standard models predict that surface lithium abundances should depend only on mass, age, and on chemical composition, and that most of the Li depletion in solar–type and lower mass stars should occur during pre-main sequence (PMS) evolution. The observations, in particular the comparison between the 120 Myr old Pleiades and the 600–800 Myr old Hyades and between the latter cluster and the 4.5 Gyr old M~67, show instead that Li depletion in solar–type stars does take place on the main-sequence (MS) and that stars down to about 1 M⊙ reach the Zero Age Main Sequence (ZAMS) retaining their initial Li content (e.g., Martín & Montes mm97 (1997); Randich et al. R97 (1997)). A star–to–star scatter in Li abundance is observed both among otherwise similar solar–type stars in the old cluster M 67 (e.g., Jones et al. jon99 (1999) and references therein) and among lower mass stars in young clusters (e.g., Soderblom et al. sod93 (1993)). Finally, at least for solar–type stars, metallicity does not seem to significantly affect lithium depletion (Jeffries et al. jef98 (1998); Jeffries & James jj99 (1999)). Extra–mixing or, more in general, non standard processes, seem to be at work not only in solar–type stars on the MS, but also during the PMS and early MS evolution of K–type stars. Understanding these non–standard processes remains a challenging task, in spite of the continuously growing body of observational data.
We present here lithium observations of late–type stars in the young clusters IC 2602 and IC 2391 which have estimated ages ( Myr; see below) intermediate between PMS stars and the Pleiades. We will mainly focus on low and very low mass stars in the two clusters, with the purpose of further investigating the issue of Li depletion in the PMS phase and of the developing of a scatter in Li abundances among low mass stars.
Before X–ray surveys of these clusters by , very little information was available on their memberships. observations, besides allowing a study of the X–ray properties of both clusters, resulted in the detection of several possible low mass cluster members (Randich et al. R95 (1995); Patten & Simon ps96 (1996)). Optical photometric and spectroscopic follow-up studies have allowed investigators to ascertain the membership status for virtually all the X–ray selected candidates of IC 2391 and for several candidates of IC 2602. Membership was confirmed for a large fraction of them, providing a first sample of stars to study the evolution of lithium, rotation, and activity between the PMS and the Pleiades age (see Prosser et al. pro96 (1996); Stauffer et al. sta97 (1997) –hereafter S97; Randich et al. R97 (1997) –hereafter R97). This sample will be further exploited and enlarged in the present paper. With regards to age, very recently an age of 55 Myr has been estimated for IC 2391 using the Li depletion boundary method (Barrado y Navascués et al. bar99 (1999)), while color–magnitude (C-M) diagram fittings for both IC 2391 and IC 2602 give an age of Myr. No metallicity determinations for the two clusters were available up to now.
| IC 2602: sample observed at ESO (April ‘95) | |||||||
| star | V | BV | (VI)c | H | v | vrad | remarks |
| (1) | (2) | (Å) | (km/s) | (km/s) | |||
| R1 | 11.57 | 0.91 | 0.91 | 16 | member | ||
| R8A | 10.41 | 0.65 | 0.66 | 26 | 28 | SB; member?/see text | |
| R24A | 14.60 | 1.43 | 1.86 | 3.0 | 35 | 17 | member |
| R28A | 15.68 | 2.07 | 2.53 | 0.5 | 97 | non member/see text | |
| R30 | 15.73 | 1.51 | 2.30 | 4.8 | 12 | 12 | member: |
| R31 | 15.08 | 1.59 | 2.24 | 4.0 | 42 | 16 | member |
| R37A | 14.69 | 1.86 | 2.00 | — | 120: | — | ? |
| R38 | 15.72 | 1.53 | 2.50 | 4.9 | 60 | 14: | member |
| R39 | 15.99 | 1.57 | 2.55 | 4.1 | 22 | 11 | member: |
| R42C | 11.56 | 0.80 | 0.87 | abs. | non member | ||
| R46 | 10.70 | 0.67 | 0.82 | 18 | 74 | non member | |
| R52 | 12.19 | 1.07 | 1.11 | 110: | 12: | member | |
| R54A | 12.13 | 1.15 | 1.37 | 0.2 | 28 | 14 | member |
| R73A | 16.02 | — | 2.49 | 3.5 | 30/90? | 20: | member?/see text |
| IC 2602: sample observed at CTIO (January ‘94) | |||||||
| star | V | BV | (VI)c | H | v | vrad | remarks |
| (1) | (2) | (Å) | (km/s) | (km/s) | |||
| W79 | 11.57 | 0.83 | 0.85 | 0.9 | 8.0 | 17.3 | |
| R15 | 11.75 | 0.93 | 1.06 | +0.2 | 7: | 17.4 | |
| R24A | 14.61 | 1.43 | 1.86 | +1.9 | 34. | 18.7 | |
| R26 | 15.14 | 1.54 | 2.15 | +1.0 | 6 | 17.7 | |
| R27 | 14.35 | 1.50 | 1.80 | +1.2 | 10.0 | 17.0 | |
| R31 | 15.08 | 1.59 | 2.24 | +3.9 | 35. | 16.3 | |
| R32 | 15.06 | 1.63 | 2.16 | +1.9 | 9.0 | 18.1 | |
| R38 | 15.72 | 1.53 | 2.50 | +11.3 | 48. | 17.3 | |
| R44 | 14.88 | 1.55 | 2.03 | +1.4 | 6: | 17.2 | |
| R50 | 14.75 | 1.56 | 2.08 | +1.4 | 6: | 16.7 | |
| R53B | 15.39 | 1.61 | 2.49 | +5.1 | 100. | 17.1 | |
| R57 | 15.59 | 1.60 | 2.44 | +3.2 | 7 | 19.1 | |
| R66 | 11.07 | 0.68 | 0.83 | 1.0 | 12.0 | 17.3 | |
| R67 | 14.97 | 1.57 | 2.16 | +1.5 | 6 | 16.4 | |
| R70 | 10.92 | 0.69 | 0.71 | 1.2 | 11.0 | 16.7 | |
| R77 | 14.12 | 1.47 | 1.72 | +0.4 | 7 | 17.6 | |
| R82 | 14.98 | 1.62 | 2.51 | +3.4 | 7 | 14.6 | SB3 |
| R93 | 13.79 | 1.37 | 1.62 | +0.6 | 8.5 | 18.5 | |
| R96 | 12.94 | 1.25 | 1.37 | +0.6 | 17.0 | 15.5 | |
| (1) Names from R97 and Whiteoak (whi61 (1961)) | |||||||
| (2) Photometry comes from Prosser et al. (pro96 (1996)) | |||||||
| IC 2391: sample observed at CTIO (January ‘94) | |||||||
| star | V | BV | (VI)c | H | v | Vrad | remarks |
| (1) | (Å) | (km/s) | (km/s) | ||||
| VXR3A | 10.95 | — | 0.74 | 1.1 | 10. | 14.9 | |
| VXR6A | 13.77 | — | 1.94 | +1.4 | 6, 7 | ,49.9 | SB2 |
| VXR7 | 9.63 | 0.46 | — | 1.5 | 21 | 15.6 | |
| VXR14 | 10.45 | (0.57) | 0.69 | 47 | 14. | ||
| VXR16A | 11.84 | — | 0.94 | 0. | 22 | 15.5 | |
| VXR18A | 13.54 | — | 1.53 | 0.4 | 8 | 14.6 | |
| VXR30 | 9.88 | 0.46 | — | 1.4 | 43 | 30.1 | SB1? |
| VXR31 | 11.22 | — | 0.73 | 1.1 | 17 | 22.3 | SB1? |
| VXR44 | 9.69 | 0.42 | — | 1.7 | 67: | 14.2 | |
| VXR49B | 14.34 | — | 1.89 | +1.0 | 12.2 | 13.7 | |
| VXR50A | 12.54 | — | 0.91 | 0.15 | 64 | 17. | |
| VXR62A | 11.73 | (0.86) | 0.99 | 0. | 52 | 12: | |
| VXR65 | 14.13 | — | 1.79 | +0.8 | 8 | 14.5 | |
| VXR67A | 11.71 | — | 1.03 | 0.1 | 8: | 14.9 | |
| VXR69A | 11.67 | — | 0.90 | 0.3 | 19 | 15.1 | |
| VXR70 | 10.85 | (0.64) | 0.75 | 0.9 | 17 | 13.4 | |
| VXR71A | 15.32 | — | 2.41 | +3.7 | 23.5 | 20.9 | SB1? |
| VXR72 | 11.46 | (0.73) | 0.84 | 0.6 | 15 | 14.1 | |
| VXR76A | 12.76 | (1.05) | 1.24 | +0.3 | 8. | 14.4 | |
| VXR77A | 9.91 | (0.50) | 0.60 | 1.4 | 95: | 9: | |
| VXR78 | 10.44 | — | 0.73 | 0.9 | 50: | 22.8 | SB1? |
| VXR80A | 11.98 | — | 1.04 | 0? | 150 | — | |
| (1) Names and photometry were taken from Patten & Simon (ps96 (1996)), who had retrieved B–V colors for VXR 7, VXR 30, | |||||||
| and VXR 44 from the literature; the origin of B–V colors for the other stars is not clear and they have not been used | |||||||
| in the present analysis (see text) | |||||||
Lithium studies for IC 2602 and IC 2391 have previously been carried out by R97 and Stauffer et al. (sta89 (1989), hereafter S89), respectively. Due to the relatively small size of their sample, S89 could not conclude much about the presence of a spread in IC 2391; nevertheless, their data allowed them to show that the coolest stars in the cluster are significantly Li depleted and that several Pleiades stars exist that have a higher Li content than IC 2391 members. R97 found that G and early–K type stars in IC 2602 generally lie on the upper bound of the Pleiades Li vs. Teff distribution, with only a few early K–type stars showing signs of lithium depletion. Their data evidenced some star-to-star scatter among late–G and early–K dwarfs in IC 2602, suggesting that the spread develops during the PMS phase. More surprisingly, and similarly to the results of S89 for IC 2391, R97 found that the latest–type stars in IC 2602 were severely depleted in lithium and that their average lithium abundance was comparable to the lowest abundances measured among the Pleiades.
The new lithium observations presented in this paper significantly enlarge the two previous surveys and extend them to later spectral–types. The new data will allow us to verify with higher statistical significance the results of S89 and R97 and to investigate the Li vs. color distribution for very low mass stars in the two clusters. The same spectra will also be used to ascertain membership and to derive rotational velocities for those IC 2602 candidate members not included in the samples of S97 and R97. Besides lithium abundances, we also estimated iron abundances for a subsample of stars in the two clusters.
2 Observations
The observations were carried out at the European Southern Observatory (ESO) and at the Cerro Tololo Inter–American Observatory (CTIO). The stars observed at CTIO are the ones already studied by S97 for membership, activity, and rotation. The 4m telescope was used, in conjunction with the red, long–camera echelle spectrograph and a 31.6 line mm-1 grating. A 120m slit width (0.8 arcsec on the sky) and a Tektronix 2048 CCD provided a 2 pixel resolution of Å at H (R) and a spectral coverage from 5800 to 8200 Å. Data reduction was performed using IRAF (see S97 for details). Since radial and rotational velocities were already derived by S97, we used their spectra only to carry out the lithium and metallicity analysis. We obviously excluded from the sample the stars which were found to be cluster non-members by S97.
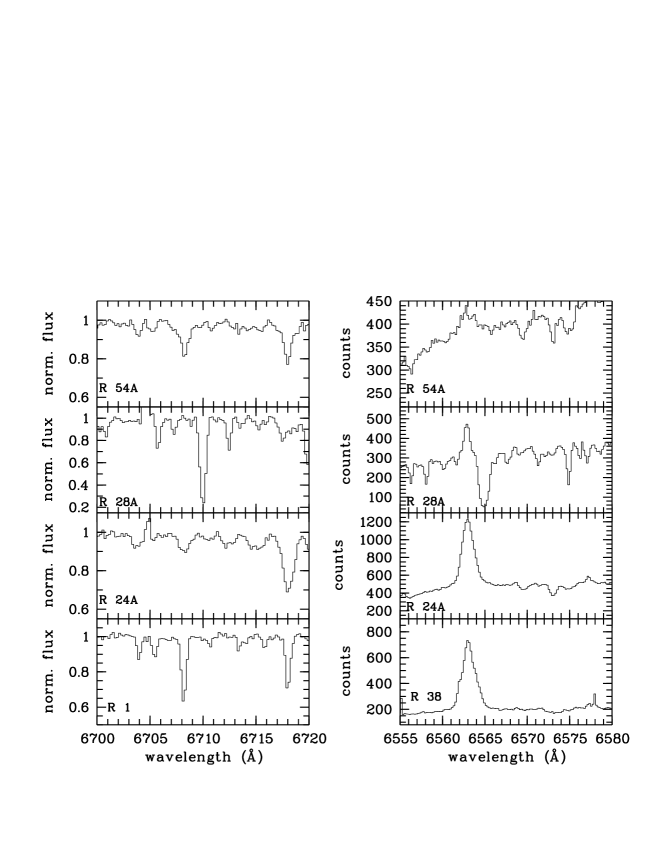
Additional spectra for 15 X-ray selected IC 2602 candidate members were obtained at ESO in April 1995, using CASPEC at the 3.6m telescope in a similar configuration to the one used by R97. Briefly, the standard grating (31.6 lines/mm), together with the red cross-disperser, the short camera, and ESO CCD #32 (512 512 27 pixels) were used. The slit width was 300 (2.25 arcsec on the sky), resulting in a resolving power . The observed stars cover a large range of magnitudes and the spectra were taken under various weather conditions; the achieved S/N per resolution element thus ranges between and . The data were reduced using the context echelle within MIDAS; the usual steps were followed; namely, background (including scattered light) subtraction, flat-fielding, order extraction, sky subtraction, and wavelength calibration. We mention that the level of scattered light in CASPEC is very low ( 3%) and it is well taken into account with a proper background subtraction. Examples of the spectra at lithium and H are shown in Fig. 1.
The sample stars are listed in Table 1; three of the stars observed in the ESO ’95 run (R 24A, R 31, and R 38) were already observed at CTIO by S97 and, in turn, three of the stars in the S97 sample (R 15, R 66, and R 70) had been observed by R97. Radial and rotational velocities as well as Hα EWs are also listed in the table. For stars included in S97 sample these quantities were retrieved from that paper.
3 Analysis
3.1 Rotational and radial velocities
Radial and rotational velocities for the new sample of IC 2602 stars observed at ESO in April 1995 were derived via cross-correlation techniques in the same manner as for the other IC 2391 and 2602 data (S97). We primarily used two orders ( 6000-6070 AA and 6405-6485 AA) dominated by a large number of modestly strong absorption features. For the two very rapid rotators where these two orders were less useful, we instead relied primarily on the order which included the Na i D doublet. The radial velocity zero point was set by observations of a number of rv standard stars (specifically HD 102870, 126053, 154417 and 161096). HD 161096 was used as the template star against which the spectra of the IC 2602 program stars were cross-correlated. An order dominated by O2 lines in the Earth’s atmosphere was used to determine small corrections to the radial velocity zero point for each target object due to spectrograph flexure (or other time or hour-angle dependent changes).
| IC 2602 | ||||||
|---|---|---|---|---|---|---|
| star | Teff | Teff | EW(Li) | n(Li)LTE | n(Li)NLTE | n(Li) |
| (K) | (K) | (mÅ) | ||||
| W79 | 5260 | 57 | 142 5 | 2.3 | 2.4 | 0.14 |
| R1 | 5050 | 89 | 204 7 | 2.4 | 2.4 | 0.18 |
| R8A | 5930 | 86 | 178 9 | 3.2 | 3.1 | 0.20 |
| R15 | 4820 | 76 | 255 15 | 2.4 | 2.4 | 0.24 |
| R24A | 3780 | 100∗ | 112 8 | 0.3 | 0.3 | 0.2∗ |
| R26 | 3540 | 100∗ | 100 | — | — | — |
| R27 | 3830 | 100∗ | 50 | — | — | — |
| R30 | 3440 | 100∗ | 80 | — | — | — |
| R31 | 3480 | 100∗ | 55 | — | — | — |
| R32 | 3540 | 100∗ | 60 | — | — | — |
| R38 | 3330 | 100∗ | 50 | — | — | — |
| R39 | 3310 | 100∗ | 80 | — | — | — |
| R44 | 3630 | 100∗ | 70 | — | — | — |
| R50 | 3590 | 100∗ | 50 | — | — | — |
| R52 | 4580 | 53 | 262 11 | 2.1 | 2.2 | 0.18 |
| R53B | 3340 | 100∗ | — | — | — | — |
| R54A | 4260 | 93 | 189 10 | 1.2 | — | 0.21 |
| R57 | 3360 | 100∗ | 100 | — | — | — |
| R66 | 5560 | 174 | 173 10 | 2.8 | 2.8 | 0.3 |
| R67 | 3540 | 100∗ | 72 12 | 0.3 | — | 0.24∗ |
| R70 | 5760 | 62 | 172 12 | 3.0 | 2.9 | 0.2 |
| R73A | 3340 | 100∗ | 60 | — | — | — |
| R77 | 3910 | 100∗ | 30 | — | — | — |
| R82 | 3330 | 100∗ | 56 | — | — | — |
| R93 | 3980 | 10 | 60 10 | 0.0 | — | 0.12 |
| R96 | 4160 | 10 | 320 12 | 2.0 | — | 0.14 |
| Asterisks indicate stars for which errors in Teff could not be directly estimated | ||||||
| IC 2391 | ||||||
|---|---|---|---|---|---|---|
| star | Teff | Teff | EW(Li) | n(Li)LTE | n(Li)NLTE | n(Li) |
| (K) | (K) | (mÅ) | ||||
| VXR3A | 5590 | 100∗ | 175 16 | 2.9 | 2.8 | 0.27∗ |
| VXR6A | 3690 | 34 | 60 | — | — | — |
| VXR7 | 6470 | 100∗ | 116 9 | 3.3 | 3.2 | 0.21∗ |
| VXR14 | 5780 | 106 | 162 11 | 3.0 | 2.9 | 0.23 |
| VXR16A | 4970 | 73 | 302 12 | 3.0 | 2.8 | 0.21 |
| VXR18A | 3990 | 25 | 55 15 | 0.0 | — | 0.18 |
| VXR30 | 6470 | 100∗ | 109 12 | 3.3 | 3.2 | 0.24∗ |
| VXR31 | 5630 | 100 | 182 10 | 3.0 | 2.9 | 0.22 |
| VXR44 | 6650 | 100∗ | 71 12 | 3.0 | 2.9 | 0.24∗ |
| VXR49B | 3730 | 33 | 50 | — | — | — |
| VXR50A | 5050 | 76 | 239 13 | 2.6 | 2.6 | 0.22 |
| VXR62A | 4841 | 67 | 250 15 | 2.4 | 2.4 | 0.23 |
| VXR65 | 3820 | 30 | 45 | — | — | — |
| VXR67A | 4750 | 63 | 255 16 | 2.3 | 2.3 | 0.27 |
| VXR69A | 5080 | 77 | 251 17 | 2.7 | 2.7 | 0.25 |
| VXR70 | 5557 | 97 | 182 10 | 2.9 | 2.8 | 0.22 |
| VXR71A | 3360 | 15 | 70 | — | — | — |
| VXR72 | 5257 | 85 | 225 13 | 2.8 | 2.7 | 0.22 |
| VXR76A | 4343 | 43 | 204 11 | 1.4 | — | 0.17 |
| VXR77A | 6150 | 120 | 90 8 | 2.9 | 2.8 | 0.22 |
| VXR78 | 5630 | 100 | 178 10 | 2.9 | 2.8 | 0.22 |
| VXR80A | 4720 | 61 | 232 34 | 2.3 | 2.2 | 0.37 |
The derived rotational and radial velocities are listed in Cols. 6 and 7 in Table 1. Based on multiple spectra of some of the radial velocity standards, we believe the one sigma uncertainty for the IC 2602 radial velocities should be 2 km/s for stars with v 30 km/s, increasing up to several km/s for the most rapid rotators (stars with expected uncertainties 2 km/s are marked with a colon after the radial velocity in Table 1). Based on our previous experience with the cross-correlation technique, we expect the rotational velocities to have uncertainties of order 10% of the vsini.
Two or more radial velocity standards were observed on each night of the run, with a total of 10 spectra for the rv standards obtained during the run. We can estimate the external accuracy (relative to these radial velocity standards) for our derived radial velocities from the RMS scatter of the velocities we derive - that RMS is 1.7 km/s. Comparison of the new observations versus that in S97 for the four stars in common suggests that new radial velocities may be low by 1-2 km/s, but that comparison is made less useful by the large average rotational velocities for these four stars.
3.2 Effective temperatures and Li abundances
Effective temperatures were derived using BV and VI color indices and assuming reddening values E(BV)=0.04 and E(VI)=0.04 for IC 2602 (Whiteoak whi61 (1961); Braes bra62 (1962))111 We used these reddening values for consistency with both S97 and R97. Note, however, that if using E(BV), a reddening E(VI) would be more appropriate (see Pinsonneault et al. pin98 (1998)). Using the latter, we would have obtained 20 K warmer temperatures with negligible differences in the inferred n(Li) and [Fe/H] values. and E(BV)=0.01 and E(VI)=0.01 for IC 2391 (see discussion in Patten & Simon ps96 (1996)). For stars with (B–V) and both color indices available, we used both color calibrations and then we adopted the average Teff value; on the other hand, for IC 2391 stars observed at CTIO one color only is available, either B–V (for the three warmest stars) or V–I222Patten & Simon (ps96 (1996)) list in their Table 4 (see also Table 1 in the present paper) B–V colors for several of our sample stars; however, we decided not to use those colors since a) the origin of the data is not clear (Patten & Simon carried out and photometry only); b) B–V colors seem too blue providing systematically higher Teff than V–I colors.; for these stars we were forced to assume TeffTeff(B–V) or TeffTeff(V–I). Finally, for stars with (B–V) in both clusters we used only effective temperatures derived from V–I colors, since B–V is not a good temperature indicator for very cool stars. Note that since the B–V and V–I calibrations are based on Bessel (bes79 (1979)) the use of both calibrations for part of the stars and only one for the others should not introduce any systematic temperature difference. As to the color–temperature calibrations, we used the Teff vs. BV calibration of Soderblom et al. (sod93 (1993))333Teff(BV)=1808(B–V)(B–V) and, for stars with (VI)0, the Teff vs. VI calibration of R97444Teff(VI)=(V–I)(V–I)(V–I); as mentioned, both calibrations are based on Bessel (bes79 (1979)). For stars redder than (VI)0 we instead used the Teff vs. VI calibration of Bessel (bes91 (1991)), which is about 200 K cooler than the one by Kirkpatrick et al. kir93 (1993)) and between 100 and 150 K cooler than the one by Leggett et al. (leg96 (1996)). We have employed this calibration for consistency with the calibration used for warmer stars; although this may introduce systematic errors in our results, it will not affect the relative comparison between different samples analyzed in the same way.
Patten & Simon (ps96 (1996)) estimate an error of 2% in their photometry which reflects into an error (VI) mag; we derived the error in the inferred effective temperatures accordingly. On the contrary, no estimates of photometric errors are provided by Prosser et al. (pro96 (1996)) for IC 2602 stars; they just mention that for stars brighter than V “the accuracy of the photometry is generally limited by variability” (due to rotational modulation of starspots). Since for these stars we found no systematic difference between Teff(B–V) and Teff(V–I), we estimated random errors in Teff as Teff= , with Teff= Teff(B–V) Teff(V–I). Finally, for stars for which Teff was derived from one color only and photometric errors are not available, we assumed a constant error of 100 K, slightly larger than the average error for the stars for which Teff was derived by averaging the values given by both indices. The adopted temperatures and errors are listed in Cols. 2 and 3 of Table 2.
At the resolution of our observations (both the ESO and CTIO ones) the Li feature is blended with lines of other atomic and molecular species, the main contributor being the Fe i 6707.44 Å line. We used the relationship given by Soderblom et al. (sod93 (1993)) to estimate the contribution of the Fe line as a function of BV; we then derived a EW(6707.44) vs. Teff relationship, which we used to estimate the contribution of the Fe line for stars with no available BV. For stars cooler than about 3900 K the formula given by Soderblom et al. (sod93 (1993)) is not appropriate, as, on the one hand the Fe i line is not as strong as in warmer stars and, on the other hand, the contribution of molecular lines becomes more significant. Among very cool stars (Teff K) we have only two Li detections and a somewhat inhomogeneous set of upper limits; since for these stars we will investigate the behaviour of lithium directly on the EW vs. V–I plane, n(Li) are computed only for the two stars in IC 2602 with a Li detection. For them we assumed an equivalent width of the 6707.44 Å line of 20 mÅ, as measured in the spectrum of two field M dwarfs with similar colors (Gl 193 and Gl 273). We caution that the Li abundances we provide for these two stars of IC 2602 should be regarded as indicative only.
LTE lithium abundances were then derived using corrected equivalent widths and the curves of growth (COGs) of Soderblom et al. (sod93 (1993)). These COGs do not extend above 6500 K and below 4500 K; for stars warmer and cooler than these temperatures we estimated n(Li) by extrapolating the COGs, as was done by Soderblom et al. (sod99 (1999)). LTE abundances of stars warmer than 4500 K were corrected for NLTE effects using the code of Carlsson et al. (car94 (1994)). NLTE corrections are not provided in that paper for stars cooler than 4500 K and thus no correction was applied to those stars. NLTE corrections for a larger temperature range (down to 2500 K) have been computed by Pavlenko et al. (pav95 (1995)), but unfortunately they are not provided in tabular form. In any case, as discussed in detail in that paper, NLTE corrections become smaller as one moves to cooler temperatures.
| star | Teff | Teff | EW(Li) | n(Li)LTE | n(Li)NLTE | n(Li) |
|---|---|---|---|---|---|---|
| (K) | (K) | (mÅ) | ||||
| SHJM 1 | 5590 | 95 | 160 10 | 2.8 | 2.7 | 0.22 |
| SHJM 2 | 5970 | 147 | 140 10 | 3.1 | 2.9 | 0.27 |
| SHJM 3 | 4480 | 166 | 130 7 | 1.2 | — | 0.77 |
| SHJM 6 | 5050 | 75 | 190 11 | 2.3 | 2.4 | 0.20 |
| SHJM 7 | 4380 | 36 | 50 | 0.39 | — | — |
| SHJM 8 | 4020 | 98 | 90 30 | 0.4 | — | 0.38 |
| SHJM 9 | 4030 | 87 | 100 30 | 0.4 | — | 0.37 |
| SHJM 4 | 3558 | 20 | 50 | 0. | — | — |
| SHJM 5 | 3893 | 28 | 200 | 1.1 | — | — |
| SHJM 10 | 3580 | 20 | 100 | 0.46 | — | — |
| star | Teff(R97) | n(Li)(R97) | Teff(new) | n(Li)(new) |
|---|---|---|---|---|
| (K) | (K) | |||
| R 3 | 5080 | 2.74 | 5140 | 2.79 |
| R 7 | 6750 | 2.97 | 6860 | 3.14 |
| R 14 | 5080 | 2.58 | 5150 | 2.65 |
| R 15 | 4900 | 2.55 | 4820 | 2.44 |
| R 21 | 6430 | 3.18 | 6320 | 3.10 |
| R 29 | 4440 | 1.76 | 4440 | 1.77 |
| R 35 | 5770 | 3.12 | 5820 | 3.12 |
| R 43 | 4840 | 2.99 | 4740 | 2.89 |
| R 45 | 5810 | 2.87 | 5800 | 2.87 |
| R 56 | 3910 | 0.65 | 3990 | 0.64 |
| R 58 | 5850 | 3.26 (3.12) | 5780 | 3.25 (3.06) |
| R 59 | 5240 | 3.09 | 5060 | 2.91 |
| R 66 | 5730 | 2.97 | 5560 | 2.83 |
| R 68 | 5110 | 2.77 | 4880 | 2.57 |
| R 70 | 5700 | 2.85 | 5760 | 2.91 |
| R 72 | 5890 | 3.19 | 5770 | 3.09 |
| R 79 | 6750 | 2.94 | 6730 | 3.02 |
| R 83 | 5970 | 3.22 | 5770 | 3.07 |
| R 85 | 6390 | 3.06 | 6390 | 3.06 |
| R 89 | 4180 | 1.60 | 4180 | 1.61 |
| R 92 | 5690 | 2.98 | 5630 | 2.93 |
| R 94 | 3950 | 0.87 | 3903 | 0.77 |
| R 95A | 5080 | 2.99 | 5020 | 2.93 |
Measured EWs (not corrected for the contribution of the Å feature), with errors are listed in Col. 4 in Table 2. Derived Li abundances (both in LTE and NLTE) and errors are listed in Cols. 5, 6, and 7. In the following (and in the figures) NLTE abundances will be used when available. Note that the differences between LTE and NLTE abundances are within the errors in inferred n(Li) and thus using NLTE abundances for a subsample of the stars and LTE abundances for the other subsample should not introduce any bias. Errors in n(Li) include the contribution of errors in Teff and of errors in equivalent widths to which we added 5 mÅ to take into account possible errors in the estimate of the atomic molecular blend contribution.
3.3 Reanalysis of previous Li observations
Effective temperatures and lithium abundances (together with their errors) were recomputed for the R97 IC 2602 sample as well for the S89 IC 2391 sample in the same fashion as for our new sample, using the published EWs and photometry. More specifically, photometry for IC 2602 stars was taken from Prosser et al. (pro96 (1996)), while photometry for IC 2391 stars was retrieved from S89 (B–V colors) and Patten & Simon (ps96 (1996) -V–I colors). Li EWs were taken from R97 and S89 for IC 2602 and IC 2391, respectively. R97 had derived n(Li) adopting the same COGs, but they assumed TeffTeff(BV) and did not extrapolate the COGs for stars warmer than 6500 and cooler 4500 K. S89 provided only EWs and did not compute Li abundances. Li abundances for the S89 stars are listed in Table 3, while “new” and “old” Li abundances and Teff for the R97 sample are listed in Table 4. Note that SHJM7 was not confirmed as a cluster member by Patten & Simon (ps96 (1996)); therefore, although we list it in Table 3, it is not considered in the following discussion and not plotted in the figures. Table 4 shows that the agreement between the “old” and “new” Li abundances for the sample of R97 is quite good. In the following these reanalysed Li abundances from S89 and R97 will be combined with our new data to investigate the behaviour of lithium in the two clusters.
3.4 Fe abundances
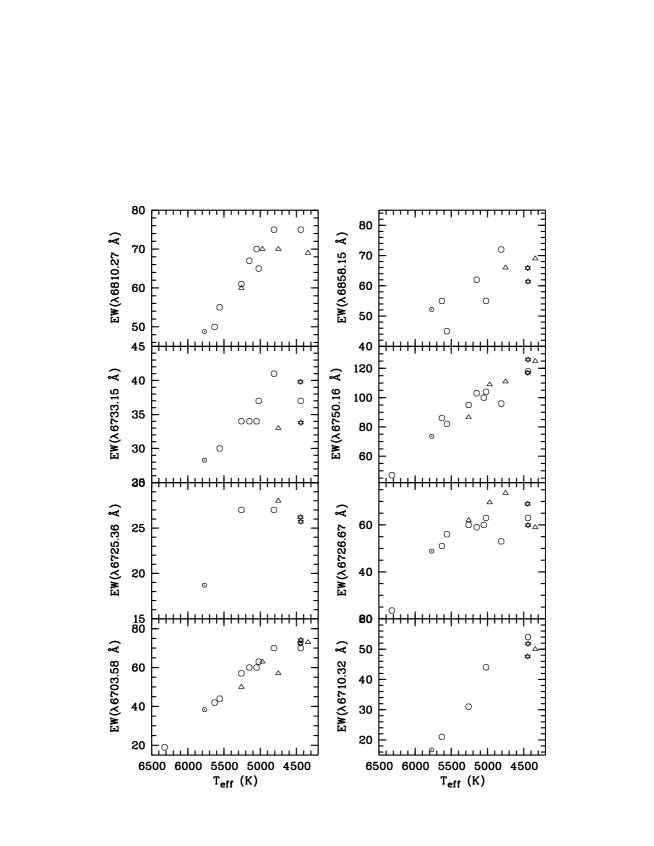
Iron abundances (Fe) were derived using a selected sample of relatively high S/N spectra in IC 2602 (nine stars, mainly coming from the R97 sample) and IC 2391 (four stars). We used the EWs of 4–8 Fe i lines (not all the lines were measurable in all the spectra), whose wavelengths are listed in Table 5; the EWs of the lines can be made available by one of us (SR) upon request. A first very qualitative estimate of the metallicities of the two clusters was carried out by plotting the EWs of these iron lines as a function of effective temperature. The corresponding diagrams are shown in Fig. 2, where the two Pleiades stars analyzed by King et al. (2000a ) are also included. A large spread in EWs is present for most of the lines for both the IC clusters and the two Pleiades points. Focusing on the lines affected by a relatively small amount of scatter, the figure suggests that the two IC clusters have similar metallicities and that their Fe abundances do not differ much from that of the Sun and of the Pleiades.
A more quantitative metallicity estimate was carried out starting from the EWs of the iron lines shown in Fig. 2 and using the same line-to-line abundance code described by Carretta & Gratton (cg97 (1997)). Kurucz (kur95 (1995)) model atmospheres, including overshooting, were used. gf-values for the eight Fe i lines were determined from an inverse abundance analysis of the same iron lines in the solar spectrum, using the same code and model atmospheres and assuming a solar iron abundance (Fe)⊙)=7.52). Solar EWs, measured on the spectrum of the solar flux, were retrieved from King et al. (2000a ); the same solar parameters as King et al. (Teff K, , km/sec) were assumed; note that microturbulence for the Sun is on the same scale as for our sample stars (see below). Finally, Van der Waals broadening was treated using the Unsöld (uns55 (1955)) approximation and the same enhancement factors as Gratton & Sneden (gs91 (1991)). We mention that the spectrum of the solar flux has a higher resolution than our target spectra; furthermore, as described in Sect. 2, within our sample itself, spectra taken in different runs have different resolutions. In particular the spectra of the four IC 2391 stars have been obtained at CTIO and have higher resolution than those obtained at ESO. However, the use of spectra with different resolution should not significantly affect our results since we have chosen spectral lines which are free from significant blends555 Å blueward of the Fe i 6703.57 Å feature a very weak CN line is present; this line is blended with the Fe i line at the resolution of our spectra. However the EW of the 6703.57 Å line listed by King et al. (2000a ) also includes the contribution of the CN feature ( mÅ in the Sun) and thus the gf-value inferred by an inverse abundance analysis takes into account both lines.; in order to confirm this point, we have compared EWs of the stars in common between the CTIO and ESO samples (see Sect. 3.5) and found that differences are within measurement errors and, more important, do not show any systematic trend.
For the analysis of our sample stars we adopted the same Teff used for inferring Li abundances, a surface gravity , and a microturbulence velocity given by (see Boesgaard & Friel bf90 (1990)). In Table 5 we list the inferred Fe abundances for each line and the mean abundance that was derived using all the available lines for each star and giving the same weight to each line. Estimates of the internal errors on the final abundance, inferred as explained in the Appendix, are also listed in the table. In order to put the Pleiades on the same metallicity scale as our stars, we derived (Fe) values for the two Pleiades stars hii 97 and hii 676 analyzed by King et al. (2000a ). Stellar parameters were computed as for our sample stars and the same metallicity analysis was carried out. The results are also listed in Table 5. It is important to stress that, as discussed in the Appendix, external uncertainties are not easy to estimate, but can be as large as dex; although as in other studies of this kind we cannot provide an absolute iron abundance, the following discussion will be based on relative metallicities (both between the two IC clusters and between them and the Pleiades) and thus should not be affected by external errors.
3.5 Comparison of stars in common between different samples
The stars in common between different samples, together with Li and H EWs measured in the ESO and CTIO spectra, are listed in Table 6. Inspection of the table shows a very good agreement as far as lithium is concerned. In the following, when considering the merged sample, we will use n(Li) derived from our new ESO CTIO sample and, because of their higher S/N, we will give preference to the ESO data when both ESO and CTIO data are available (but using the other data would make no difference). As to H, a large discrepancy between the ESO and CTIO values is seen only for R 38.
The CTIO spectrum of R 38 obtained in January 1995 showed a peculiar H profile with a relatively normal core plus unusually broad and strong “wings” (with about half of the equivalent width being attributable to the broad component). S97 discussed this profile in detail, and speculated that the star had been observed shortly after a flare. The ESO spectrum of this star obtained in April 1995 was intended, in part, to test that idea. Because the new spectrum both lacks the broad wings and has an equivalent width about half of that observed four months earlier (see Fig. 1), we believe the flare explanation is supported by the new data.
4 Results
4.1 Cluster membership
We have attempted to classify the stars we observed at ESO in 1995 as either members or non-members based on all of the information available to us. By selection, all of the stars are possible members based on their photometry. We have used the following criteria as membership indicators, in approximately this order of precedence:
-
•
A radial velocity within two of the mean radial velocity for the cluster, which we take to be v km/s for IC 2602. This criterion may be violated for cluster members that are spectroscopic binaries;
-
•
spectral features appropriate for the observed colors of the star assuming the nominal reddening to IC 2602;
-
•
chromospheric activity (as deduced from the H equivalent width and profile) consistent with the star’s color and with the age of IC 2602;
-
•
an inferred lithium abundance roughly compatible with the star’s mass and the age of IC 2602.
A membership flag based on the combination of these criteria is indicated in the last column of Table 1. Our reasoning for the stars not designated as members is as follows (except for R 28A which is treated separately in the next section): R 8A – the radial velocity is much higher than expected for a cluster member. However, all of the other spectral characteristics are compatible with the star being an IC 2602 member, and we therefore consider this star to be a possible SB1 cluster member; R 37A – the very high rotational velocity for this star in combination with its M dwarf colors suggests that this is a very young, low mass star, and hence a likely IC 2602 member. However, a consequence of the rapid rotation is that we are unable to measure a usefully accurate radial velocity or to detect lithium in absorption. H is only weakly in emission, whereas we would expect a strong H emission line given the star’s rapid rotation and late–type colors. The data for this star are thus contradictory, and we consider its membership status unknown; R 42C – we consider this star to be a non-member because its radial velocity is far removed from the cluster mean and because it does not have a detected lithium absorption feature despite being in a color range where we would expect to easily detect lithium even in stars several times older than IC 2602; R 46 – this star also has a radial velocity far from the cluster mean and a lithium equivalent width much less than we would expect for its color; R 73 – the large rotational velocity (or velocities) and late-type colors strongly suggest this is a young star, and hence a likely member of the cluster. The radial velocity is in agreement with that assessment. We note that the H profile and the profiles of a few of the stronger absorption features look like there is a narrow core and broader wings. This could indicate that the star is an SB2, with one relatively slow rotator and one rapid rotator (vsini 30 and 90 km/s, respectively).
All together (i.e., including R97 and S97 samples) 55 new IC 2602 candidates from the X-ray survey were observed: 41 of them (74 %) were confirmed as members, 9 (18 %) were rejected as members, and for the remaining five additional spectra should be taken (but three of these five are very likely SB cluster members as indicated by lithium). We conclude therefore that the rate of success of the X–ray survey in identifying new cluster members is rather high, while the contamination by late–type field stars is consistent with the prediction of Randich et al. (R95 (1995)). We also note that, as expected, most of the non–members are found among very late–type stars.
4.1.1 A peculiar non–member: R 28A
We are uncertain how to interpret the spectrum of one of the candidate IC 2602 members observed at ESO in 1995. The star in question is R 28A. This star has V = 15.68, BV= 2.07, VI= 2.53. There are at least two indications in the spectrum that it is a non-member: (a) the derived radial velocity is +97 km/s and (b) whereas all other cluster members with VI 2.0 show TiO absorption features in our spectra, R 28A does not, and instead has a spectrum more compatible with that of an early K star. These two characteristics might suggest that R 28A is instead a background, K giant. However, R 28A also has a very strong Li 6708 Å absorption feature, with an equivalent width of 530 mÅ - perhaps suggesting that the object is a distant, pre-main sequence K star. The H profile of the star is also peculiar, since it includes both emission and absorption components (see Fig. 1). The emission component is suspiciously “at rest” with an observed wavelength of 6562.9 Å, whereas the absorption component has exactly the wavelength expected for the radial velocity derived for R 28A using the atomic absorption lines in two of the orders blueward from H. While this star seems to have many interesting characteristics, enough of those characteristics indicate that it is very unlikely to be a member of IC 2602 and we can safely exclude it from further discussion here.
4.2 Metallicity
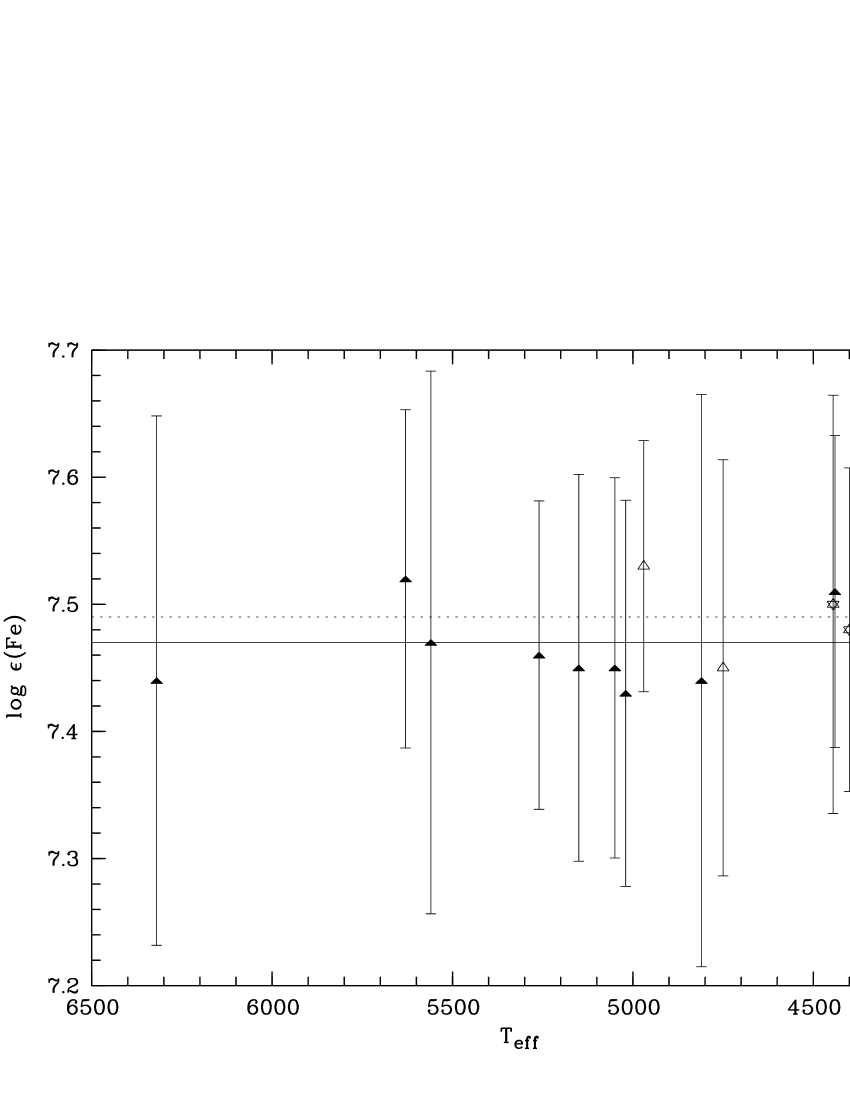
In Fig. 3 we show the average (Fe) as a function of Teff for IC 2602 and IC 2391 stars listed in Table 5. The two Pleiades stars reanalyzed by us are also shown. The horizontal lines indicate the weighted mean for the three clusters, (Fe) for IC 2602, (Fe) for IC 2391, and (Fe) for the Pleiades. Weighted means were computed assuming for each star a conservative final internal error .
| name | Teff | (Fe) | |||||||||
|---|---|---|---|---|---|---|---|---|---|---|---|
| (K) | (km/s) | 6703.57 | 6710.32 | 6725.36 | 6726.67 | 6733.16 | 6750.16 | 6810.27 | 6858.15 | mean | |
| R 1 | 5050 | 0.8 | 7.47 | — | — | 7.41 | 7.39 | 7.43 | 7.55 | – | 7.45 |
| R 14 | 5150 | 0.9 | 7.50 | — | — | 7.41 | 7.36 | 7.53 | 7.53 | 7.40 | 7.45 |
| R 15 | 4810 | 0.7 | 7.57 | — | 7.48 | 7.30 | 7.47 | 7.26 | 7.59 | 7.60 | 7.44 |
| R 21 | 6320 | 1.2 | 7.51 | — | — | 7.32 | — | 7.50 | — | — | 7.44 |
| R 29 | 4440 | 0.6 | 7.53 | 7.50 | — | 7.52 | 7.50 | 7.39 | 7.65 | — | 7.51 |
| R 66 | 5560 | 1.0 | 7.48 | — | — | 7.53 | 7.48 | 7.50 | 7.51 | 7.30 | 7.47 |
| R 92 | 5630 | 1.0 | 7.49 | 7.51 | — | 7.49 | — | 7.64 | 7.47 | 7.50 | 7.52 |
| R 95 | 5020 | 0.8 | 7.51 | 7.50 | — | 7.44 | 7.39 | 7.45 | 7.47 | 7.28 | 7.43 |
| W 79 | 5260 | 0.9 | 7.52 | 7.42 | 7.52 | 7.47 | 7.39 | 7.49 | 7.48 | 7.38 | 7.46 |
| VXR 16A | 4970 | 0.8 | 7.51 | — | — | 7.55 | — | 7.51 | 7.55 | — | 7.53 |
| VXR 67 | 4750 | 0.7 | 7.30 | — | 7.51 | 7.55 | 7.50 | 7.36 | 7.51 | 7.40 | 7.45 |
| VXR 72 | 5260 | 0.9 | 7.39 | — | — | 7.50 | — | 7.35 | 7.46 | — | 7.42 |
| VXR 76 | 4340 | 0.6 | 7.57 | 7.41 | — | 7.51 | — | 7.43 | 7.63 | 7.57 | 7.52 |
| hii 676 | 4400 | 0.6 | 7.57 | 7.44 | 7.57 | 7.46 | 7.44 | 7.44 | — | 7.43 | 7.48 |
| hii7 | 4445 | 0.6 | 7.56 | 7.37 | 7.59 | 7.58 | 7.54 | 7.37 | — | 7.49 | 7.50 |
| star | EW(Li) (ESO ’94) | H (ESO ’94) | EW(Li) (CTIO) | H (CTIO) |
| (mÅ) | (Å) | (mÅ) | (Å) | |
| R 15 | 259 | 0.20 | 255 | 0.2 |
| R 66 | 186 | 173 | ||
| R 70 | 168 | 172 | ||
| star | EW(Li) (ESO ’95) | H (ESO ’95) | EW(Li) (CTIO) | H (CTIO) |
| (mÅ) | (Å) | (mÅ) | (Å) | |
| R 24A | 112 | 3.0 | 107 | |
| R 31 | ||||
| R 38 |
The figure exhibits a spread in Fe abundances, but the star-to-star scatter is well within the formal error bars. A larger number of stars and, in particular, higher S/N spectra that would allow measuring the EWs of a larger set of Fe lines, are certainly desirable for a more accurate abundance analysis; our data do not allow us to ascertain whether there is some real star-to-star scatter in (Fe), neither can we infer an absolute iron abundances for the IC clusters; nevertheless, we think that the claim can be made that the mean abundances of the two clusters are similar (with IC 2391 possibly slightly more metal rich) and that both are close to the solar abundance (contrary to preliminary report by Meola et al. meo00 (2000) of somewhat subsolar abundances based on a less accurate abundance analysis). Assuming a solar abundance (Fe), the mean abundances for the two IC clusters translate into mean [Fe/H] values and , respectively. Their metallicity, therefore, is consistent with the solar metallicity of most of the young clusters for which spectroscopic abundances have been obtained so far.
The canonical value for the Pleiades derived by Boesgaard & Friel (bf90 (1990)) is [Fe/H] or (Fe); however, as discussed by King et al. (2000a ) who derived a metallicity [Fe/H], [Fe/H] spectroscopic determinations for this cluster range between [Fe/H] and [Fe/H]. Our own determination is indeed comparable with that of Boesgaard & Friel (bf90 (1990)), but is almost 0.1 dex below that of King et al. (2000a ). Most important, having put the Pleiades and the IC clusters on the same abundance scale, we are able to say that the metallicities of the two IC clusters are not significantly higher (or lower) than the Pleiades.
4.3 Lithium abundance
4.3.1 G and K–type stars
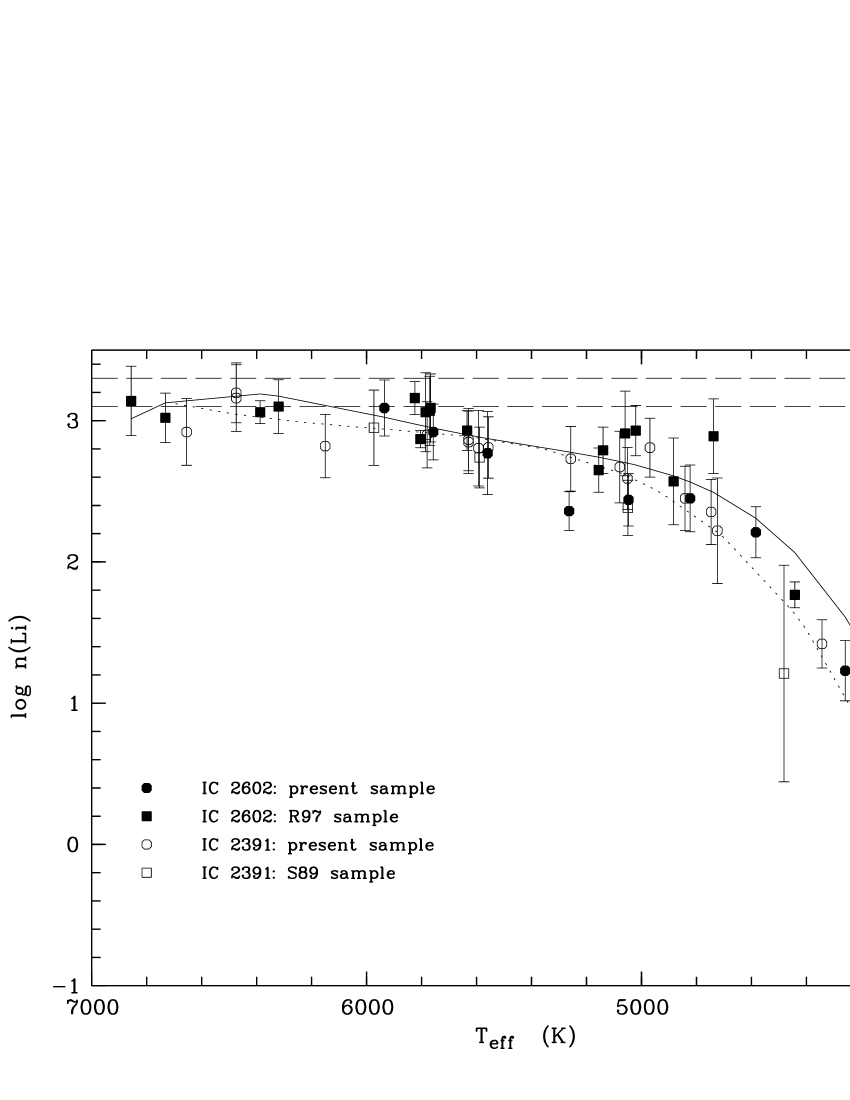
The usual n(Li) vs. Teff plot for stars warmer than Teff K
in the two clusters is shown in Fig. 4. Similarly to Fig. 6 of R97,
we show two lines indicating the range of values for the initial Li abundance
for Pop. I stars as indicated by NLTE analysis of
pre-main sequence stars (e.g., Martín et al. mar94 (1994))
and meteorites.
Only confirmed clusters members, as from Table 1, are considered in
the figure.
A polynomial regression (grade 4) of the observed n(Li) vs. Teff
distributions down to Teff K was carried out (rms values
equal to 0.3 and 0.15 dex were obtained for IC 2602 and IC 2391,
respectively); the regression
curves are also shown in the figure.
The n(Li)vs. Teff distributions of solar–type stars in the two IC clusters
are very similar. In particular,
stars warmer than 5800 K in both clusters do not show any
significant Li depletion and their abundance is consistent
with the initial value for Pop. I stars. As mentioned in the Introduction,
this point has already been discussed
in several previous studies which agreed in saying that
it implies that, whereas theoretical models predict that
solar–type stars should undergo PMS Li depletion,
observations show that no PMS Li depletion occurs in stars more massive
than 1 M⊙.
The apparent scatter among the hot stars is
within the errors and thus no real scatter can be inferred from the present
data. Below 5800 K, Li depletion starts being seen and
the average Li abundance, as shown by the regression curves,
is about the same for the two clusters down to about 5000 K.
For stars cooler than this, the average abundance of IC 2602 stars
is higher than that of
IC 2391, although IC 2602 stars as depleted as IC 2391 stars of similar
temperature are present.
In addition, IC 2602 members exhibit a certain amount of star-to-star scatter;
more specifically, the dispersion is modest (but present)
for early–K stars around 5000 K and it grows larger for cooler stars.
The scatter among IC 2391 stars seems instead smaller.
In order to perform a more quantitative analysis of the presence(absence)
of a dispersion in lithium among late–G/early–K cluster members, we
carried out a polynomial regression (grade 2) of the EW(Li) vs V–I color
distributions for stars with 0.8 (VI)0.
The amount of dispersion can be estimated using a -like quantity:
,
where is the value of the regression and N the number of stars.
We found
for IC 2602 and for IC 2391.
In order to compare
the dispersion observed in the Pleiades with the two IC clusters,
we retrieved Li EWs and colors for the Pleiades stars from the literature.
More specifically, lithium data
were taken from Soderblom et al. (sod93 (1993)),
García López et al. (gar94 (1994)), and Jones et al. (jon96 (1996)).
For the stars in common between Jones et al. (jon96 (1996)) and García
López et al. (gar94 (1994)) we used Jones et al. data since they are
of higher quality; for the stars in common between García
López et al. (gar94 (1994)) and Soderblom et al. (sod93 (1993)), we used
Soderblom et al.’s measurements for stars with quality code “a”
in Soderblom et al.
Table 1, and García López et al. data in all the other
cases. (VI)K colors were instead
retrieved from the Open Cluster Database666Open
Cluster Database, as provided by C.F. Prosser (deceased) and J.R. Stauffer,
and which currently may be accessed at
ftp://cfa-ftp.harvard.edu/pub/stauffer/clusters/,
or by anonymous ftp to cfa-ftp.harvard.edu, cd /pub/stauffer/clusters.
and converted into (VI)C colors using the relationship of
Bessel & Weis (bw87 (1987)). Errors in the EWs of the Li line are provided
for most of the stars in the sample of García López et al.
(gar94 (1994)) and they are in the range mÅ.
Jones et al. (jon96 (1996)) quote errors of 5 and 20 mÅ for
slow and rapid rotators, respectively. Finally, Soderblom et al. (sod93 (1993))
quote an average error in their Li EWs of the order of 15 mÅ. In other words,
the quality of the Pleiades data is comparable with that of the data
presented here.
Using the expression above and the errors quoted in the three Pleiades papers,
we obtained for this cluster , suggesting that
the dispersion is indeed larger than for the two IC clusters.
Note however that whereas the two IC samples in this color
range are similar in size
(seven and eight stars, respectively), the Pleiades sample is much larger;
therefore, we cannot exclude that small number statistics
is the reason for the smaller scatter measured for the
IC clusters.
4.3.2 M dwarfs
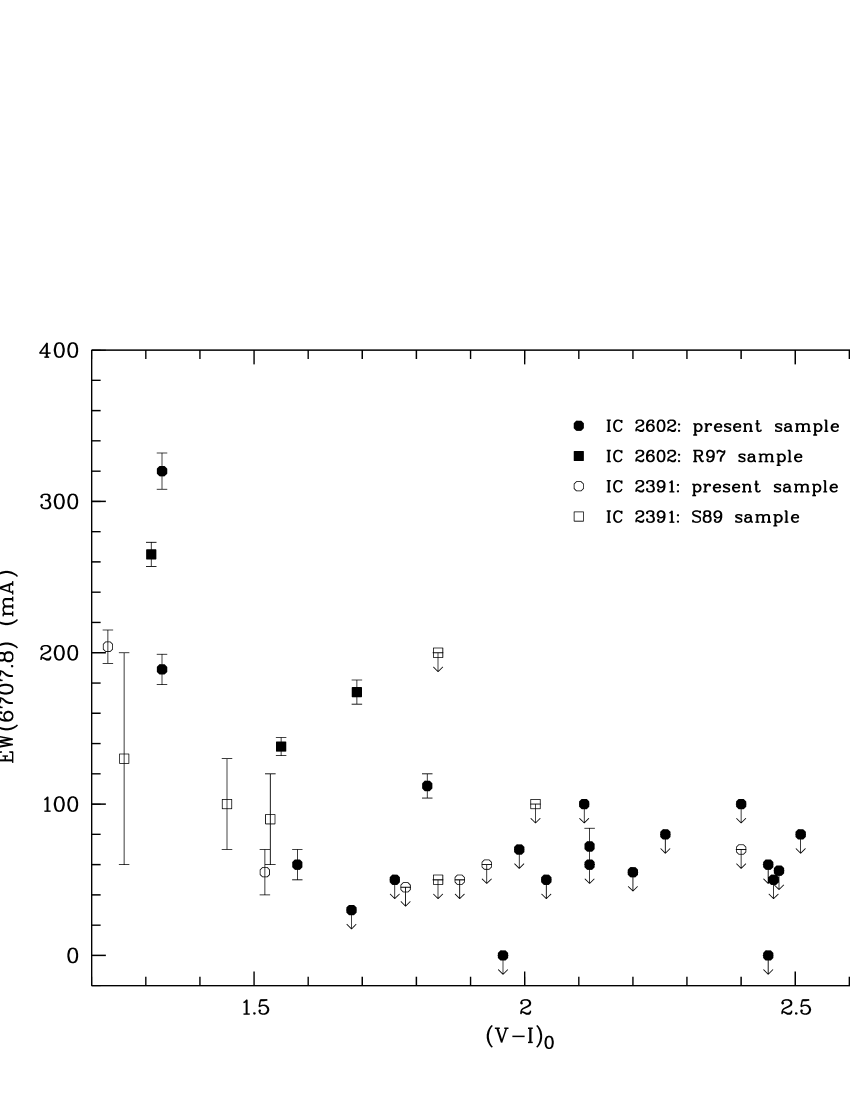
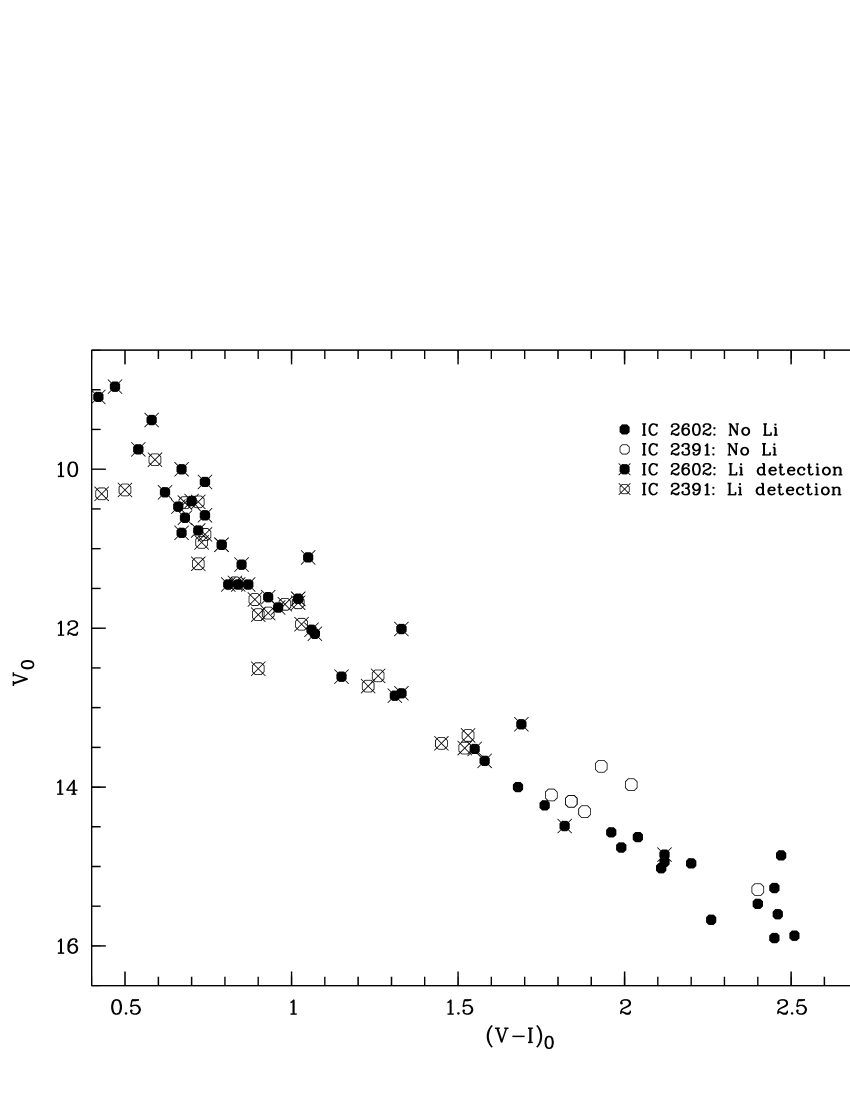
Plotted in Fig. 5 are the measured equivalent widths (EWs) of the 6707.8 Å lithium line as a function of de-reddened VI color for late–K and M cluster members with (V–I) (which corresponds to Teff 4240 K in our calibration); the coolest stars shown in Fig. 4 are also included in Fig. 5 and fall in the color interval . As already noted in the previous section, IC 2391 late–K stars have, on average, less Li than stars of the same color in IC 2602 and do not display any major dispersion in Li. This is still true as we move to very late spectral–types; in particular, the lithium feature is not detected in IC 2391 members later than (V–I) 1.5, whilst in IC 2602 a star as late as R 67 (VI0=2.12) shows the Li feature. This is better shown in Fig. 6 where we plot the V0 vs. (VI)0 C-M diagram for the two clusters. Both figures suggest that the so-called Li chasm (i.e., the drop-off in lithium detections at the cool temperature end –e.g., Basri bas97 (1997)) may start at earlier spectral–types in IC 2391 than in IC 2602. We cannot exclude that this is a selection effect, since IC 2602 is better sampled than IC 2391 at very red colors; in particular, there are no IC 2391 members in the color interval 1.55(VI)0 and only two stars later than (VI)0 are included in our sample (to be compared with 12 stars in IC 2602). However, under the working assumption that low mass stars in the two clusters have the same Li distribution and that the Li-chasm starts at a similar color (that of R 67), we can compute the probability of having 0 Li detections among 6 IC 2391 stars in the interval (VI)0. Considering a Li detection rate of 2/7 for IC 2602 and using a binomial distribution, we find that the probability of having 0/6 detections for IC 2391 is %; although this is not low enough to claim that the two samples are different on a statistical basis, it does give a hint that the Li distributions of low mass stars in the two clusters are indeed different. We mention in passing that neither of the two very late–type stars in IC 2602 showing a Li detection (R 24A and R 67) have a peculiar position on the C-M diagram and they well fit into the cluster locus; in other words, they do not seem to be photometric binaries (nor were they classified as possible spectroscopic binaries by S97) or significantly younger than the other cluster members. At the same time, all the other very cool stars in IC 2602 do not show any detectable lithium. Whereas for stars as late as R 67 this might be due to poor S/N, the EW that we measure for R 24 is much above the upper limits that we measure for stars of a similar color. The detection of R 24 and R 67, together with the lack of detections for all other stars, witnesses, therefore, the presence of a spread also among the lowest mass stars in the IC 2602 sample. We note that the abundances we derived for R 24A and R 67 (see Table 2) are in any case very low, indicating a factor of 1000 Li depletion.
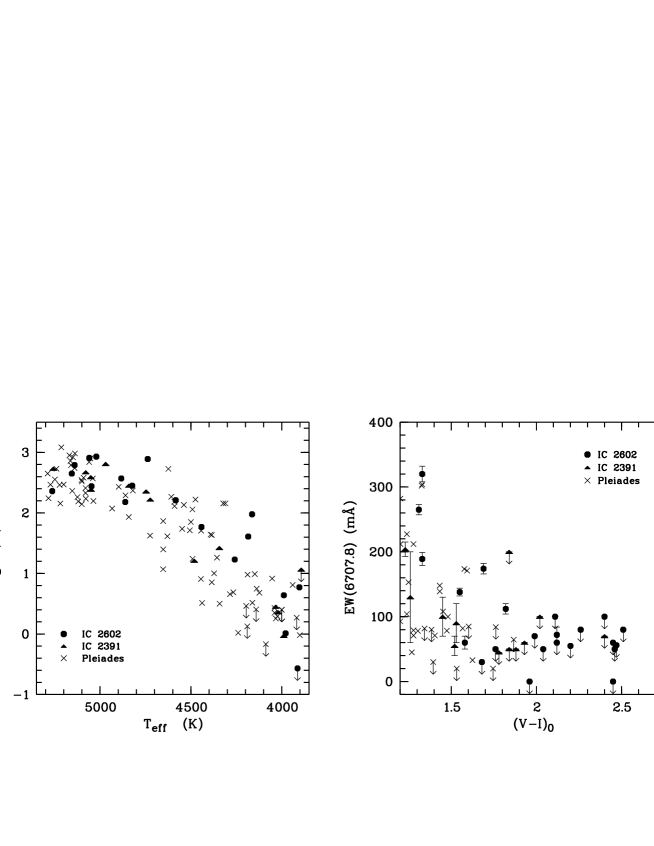
4.3.3 Comparison with the Pleiades
The left– and right–hand panels of Fig. 7 are similar to Figs. 4 and 5, but IC 2602 and IC 2391 stars cooler than 5300 K are now compared to the Pleiades. Pleiades EWs from the literature were analyzed consistently with our sample stars. We caveat that, whereas the two IC samples are X–ray selected or partially X–ray selected (in the case of IC 2391), the Pleiades sample is not, which could introduce some selection effect in the comparison. This point will be better discussed in Sect. 5.2.
The IC 2602 vs. Pleiades pattern in the left hand panel of Fig. 7 is generally consistent with the one in Fig. 7 of R97. On the one hand this assures that the n(Li) vs. Teff pattern does not depend on the particular Teff vs. color calibration chosen while, on the other hand, it confirms the results of R97 based on a smaller IC 2602 sample. As mentioned above, the existence of some spread among IC 2602 late–G/early–K stars is supported by the present data-set, although the dispersion among early–K stars in Figs. 4 and 7 appears somewhat smaller than in Fig. 6b and 7 of R97, since one of the stars in their sample, R 80, has been shown to be a cluster non–member by S97. Furthermore, our present observations prove that also later–type stars in the cluster are characterized by a dispersion in lithium as is the case for the Pleiades. On the contrary, even a sample of IC 2391 stars much larger than the one of S89 does not clearly evidence any major spread either among early–K type stars or among late–K and M dwarfs in the cluster.
Figure 7 also shows that below 4500 K the bulk of IC 2391 stars are no more lithium rich than the Pleiades. The n(Li) vs. Teff and EW(Li) vs. (V–I)0 distributions for IC 2391 lie within the distributions of the Pleiades, with some of the IC 2391 stars close to the Pleiades lower envelope. As discussed by R97, in the 5600 – 4000 K range, Pleiades stars at a given temperature are less massive than similar temperature stars in the younger IC clusters. The other way around, if we fix the mass, stars at 120 Myr are predicted to be warmer than similar mass stars at 30 – 50 Myr, since, for masses 0.6 M⊙ (and ages 20 Myr), PMS tracks are parallel to the Teff axis. Even assuming that no additional Li depletion occurs between the IC 2391 and the Pleiades ages, the n(Li) vs. Teff distribution of IC 2391 between and 3600 K, at an age of 120 Myr, would appear shifted towards the left of the diagram by 50–150 K (depending on the star temperature) and consequently the IC 2391 locus would fall on the lower bound of the Pleiades locus. The situation for IC 2602 is not as clear–cut: stars warmer than 4400 K and cooler than 3900 K in IC 2602 still lie above the mean Pleiades locus, but around 4000 K IC 2602 stars exist that are as depleted as the Pleiades. Again, if one considers the n(Li)vs. Teff distribution that IC 2602 would have at the age of the Pleiades this would be most evident.
5 Discussion
5.1 The cluster ages
The usually quoted upper main-sequence turnoff age for both IC 2602 and IC 2391 is Myr. S97 carried out a detailed analysis comparing the observed cluster C-M diagrams with theoretical isochrones and concluded that the two clusters have a similar age Myr. As mentioned in the Introduction, using the lithium depletion boundary method (LDB –e.g., Stauffer sta00 (2000) and references therein), Barrado y Navascués et al. (bar99 (1999)) have derived an age for IC 2391 of 555 Myr; we recall that an age of 120 Myr has been inferred for the Pleiades using the same method (Stauffer et al. sta98 (1998)). So far no similar study has been carried out for IC 2602 and, therefore, the question arises whether it is also older than the age inferred from C-M diagram fitting and whether our present data allow us to put constraints on its age.
As discussed by Martín (mar97 (1997)), the physics on the cool side of the so called “ Li chasm” is relatively simple, since the stars are fully convective; this is not the case on the hot side of the chasm and, actually, having good Li data for a sample of stars in clusters of different ages would provide useful feedback to the theory. Standard models predict that the effective temperature at which lithium is totally depleted also depends on age (e.g., D’ Antona & Mazzitelli dm94 (1994)). In principle, therefore, the Li vs. Teff pattern shown in Figs. 5, 6, and, 7 and, specifically, the fact that we do not see the lithium line in IC 2391 stars cooler than (V I) while in IC 2602 we detected lithium down to (V I), could suggest that IC 2602 is younger than IC 2391. The conclusion that IC 2391 is older than IC 2602, however, would be valid if the observed Li abundances in both clusters were the result of standard depletion only. As a matter of fact, a spread is evident among IC 2602 stars cooler than 4500 K and Li is not detected in all very cool members of IC 2602. Moreover, should one consider the Li vs. color distribution of cool stars as indicative of the cluster ages, the conclusion from Figs. 7 would also be that IC 2391 is at least as old as the Pleiades, which is not the case. Given this and the fact, stressed by S97, that “the distance, reddening, and ages of the two clusters must be very similar (or differences in one parameters must be fortuitously compensated for by differences in another parameter) since there is no discernible difference in the V vs. (VI)0 locus of stars for the two clusters”, we believe that, based on the present data only, the claim cannot be made that IC 2602 is significantly younger than IC 2391. Waiting for an age determination of IC 2602 based on the Li boundary method, we assume in the following discussion that IC 2602 and IC 2391 are about co-eval.
5.2 The spread
Although the origin of the star-to-star scatter in lithium observed in the Pleiades and in other young clusters does not have a definitive explanation, the empirical picture appears so far to be rather well delineated. Li observations of IC 2602 and IC~4665 (Martìn & Montes mm97 (1997)) suggest that the spread among early K–type stars develops during the PMS (see above). The dispersion is observed in other young clusters such as Alpha Per (Balachandran et al. bal96 (1996); Randich et al. R98 (1998)), Blanco~1 (Jeffries & James jj99 (1999)), and in clusters intermediate in age between the Pleiades and the Hyades, such as M~34 (Jones et al jon97 (1997)). For all clusters for which both lithium and rotational data are available, a relationship is found between n(Li) and the projected rotational velocity v, in the sense that more rapid rotators appear to have more lithium than slow rotators (but see King et al. 2000b for an alternative view). Randich et al. (R98 (1998)) more specifically showed that rapid rotators lie on the upper bound of the n(Li) vs Teff distribution and are not characterized by any major dispersion, while both Li–rich and Li–poor slow rotators exist, implying that slow rotators themselves contribute mostly to the dispersion. In addition, the Li–rotation connection does not hold anymore for stars cooler than 4500–4400 K (e.g., Garcìa Lòpez et al. gar94 (1994); Jones et al. jon96 (1996)).
Before we start any discussion about the possible reasons for the presence/absence of a scatter in the two IC clusters, a few words are warranted about the possible biases due to the sample selection; we refer to S97 for a more detailed discussion on the completeness of the two IC cluster samples, summarizing here their main conclusions. All but one of the IC 2602 members and part of the IC 2391 members used in the present paper are X-ray selected; thus, we cannot a priori exclude that our samples are biased towards high-activity/high rotation stars. The fact that all the IC 2391 members of the survey of S89 (which was not biased by any means) were detected in the X–ray survey suggests that the X–ray based membership list for this cluster should not be extremely biased. To this respect, note that seven out of the nine cluster members in the survey of S89 have (VI)0 , i.e., are in the relevant color range for this discussion. In addition, the comparison with the Pleiades core X–ray surveys (Stauffer et al. sta94 (1994); Micela et al. mic96 (1996)) suggests that the X–ray based membership lists for G and early–K dwarfs in the central 50% of the surveyed regions of the two IC clusters should be complete and unbiased. More specifically, the limiting sensitivity of the IC 2602 X–ray survey for a region corresponding to about half of the total area was erg/sec. Figure 13 in Stauffer et al. (sta94 (1994)) and Fig. 4 in Micela et al. (mic96 (1996)) clearly show that virtually all G and early–K Pleiades stars have X–ray luminosities larger than the above value (inspection of the tables in the two papers shows that only one star in the range 0.8 (VI)0 1.05 has a luminosity below that). As argued by S97, this means that, under the entirely plausible assumption that the level of X–ray activity decays with age, at the age of the IC clusters these stars would have had larger X–ray emission and therefore a survey with a limiting sensitivity erg/sec would be complete. A similar argument holds for IC 2391. On the contrary, members detected in the outer portions of the X–ray images could be more biased towards active stars/rapid rotators; nevertheless, as concluded by S97, since for half of the regions the samples should be rather complete, their velocity (lithium?) range should be representative of the whole cluster population, unless one makes the not very likely hypothesis that some sort of velocity segregation is present within the clusters. On the other hand, very slow rotating later–type members may have been missed by the two IC X-ray surveys and thus a bias may indeed be present for these stars.
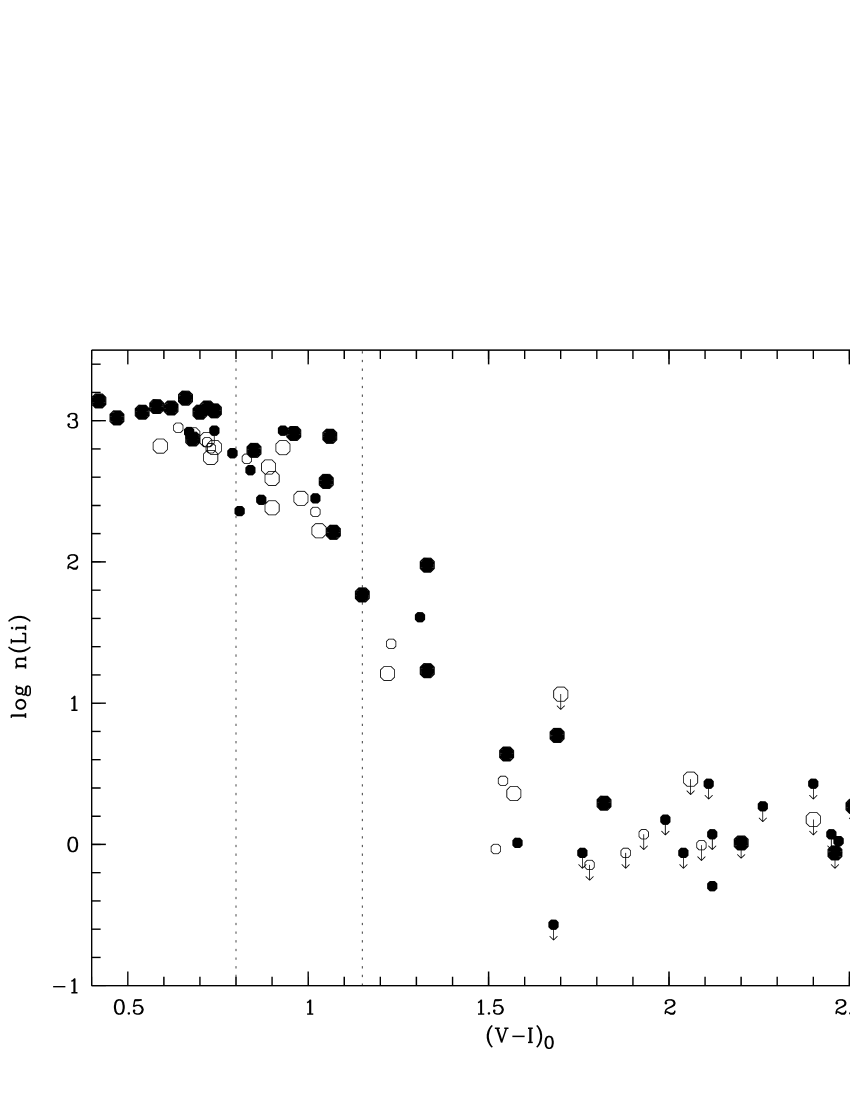
In Fig. 8 we plot the n(Li) vs. (VI)0 distributions for the two IC clusters, distinguishing between slow and rapid rotators. Around (VI)0 , fast rotators in IC 2602 tend to lie on the upper bound of the distribution, while slow rotators show some dispersion in Li; the Li–rotation dependence, however, is not as evident as for the Pleiades or Alpha Per clusters and the sample is too small. As is the case for the Pleiades, any such relationship, if it exists, breaks down below (VI)0 (or Teff K). As to IC 2391, most of the stars in the (VI)0 color range rotate faster than 15 km/s.
Low numbers statistics could be the most obvious explanation for the reduced dispersion observed among stars in IC 2391. In particular, the relatively small number of late–K IC 2391 stars may certainly explain why they do not show a significant scatter in Li. Larger and not activity selected cluster samples are certainly needed to definitively conclude that the difference in the Li patterns of late–type members in the two clusters is real. Nevertheless, as a working hypothesis, we would like to assume that the difference is indeed real and to make the speculation that a different distribution in rotational velocities could instead be the reason for the lack of a major spread among late–G/early–K stars in IC 2391. More specifically, if for stars earlier than (VI)0 slow rotators are the main contributors to the spread, a smaller fraction of slow rotators in IC 2391 with respect to IC 2602 (and to the other young clusters showing a spread) could explain the different amounts of dispersion; the fraction of stars in the 0.8 (VI)0 interval with v 15 km/s in IC 2602 is in fact larger than in IC 2391 (5/10 against 2/8 –see Fig. 8777 Under the hypothesis that the velocity distributions of the two clusters are similar, we computed the probability of having 2/8 stars with v in IC 2391, given the 5/10 stars with v in IC 2602. We found that this probability is equal to 11%; this, again, does not provide a firm proof that the two distributions are different, but provides a hint that they may be different.. Note that the above considerations are based on projected rotational velocities and we cannot exclude that the IC 2602 sample contains several rapid rotators seen pole-on. However, Barnes et al. (barn99 (1999) -see their Fig. 8) suggest that the number of stars with (VI)0 0.9 with long rotation periods is somewhat larger in IC 2602 than in IC 2391. To conclude, whereas the weak dependence of Li abundance upon rotation shown by Fig. 8 and the small number statistics make this interpretation speculative at this stage, if the lack of a dispersion in n(Li) among IC 2391 early–K type stars is real and really due to a different distribution in rotational velocities, the hypothesis can be made that this in turn may be due to a different fraction of stars with long-lived disks in the two clusters and, eventually, to different conditions of the progenitor molecular cloud.
5.3 Below 4500 K
Figure 7 supports the results of S89 and R97: IC 2391 low mass members and part of IC 2602 very cool stars appear as depleted as the Pleiades. As a consequence, if Li depletion does not stop before the stars arrive on the ZAMS, at the Pleiades age they would be more depleted than the Pleiades. In other words, Li depletion in several of the Pleiades cool stars appears to be slower than in the IC clusters. We stress again that this is not the case for stars warmer than about 4500 K, implying that such an effect becomes evident when convection is the major Li destruction mechanism. As already discussed, we cannot rule out the hypothesis that the difference between the Li patterns of the two IC clusters is due to low number statistics or possible observational biases. However, we think that it is unlikely that the lack of a significant larger Li depletion in the Pleiades with respect to both IC clusters is also explained by the relatively small sample sizes. We also mention that a similar result was found by Randich et al. (R98 (1998)) for the Alpha Per cluster, which is also younger than the Pleiades, but whose late–type members do not appear more Li rich than the latter.
Under the first order assumption that PMS Li depletion in low mass stars is driven by convection only, the different depletion rates between the IC clusters (and Alpha Per) and the Pleiades can be explained by a difference in their chemical composition. More precisely, in order to explain the lower Li depletion, the Pleiades should be the most metal poor cluster (or have the lowest -element abundances) among the four. According to Ventura et al. (ven98 (1998)) a 15 % lower than solar metallicity would reduce by a factor of 2 PMS Li depletion of a solar mass star; the effect is obviously larger for lower mass stars as shown for example by Chaboyer et al. (cha95 (1995) -their Fig. 3). Our work allows excluding large metallicity differences between the IC clusters themselves and between them and the Pleiades; nevertheless, given the errors involved, we cannot exclude differences of the order of 15 % (or 0.06 dex) in their iron content nor can we exclude that the IC clusters have a higher abundance of oxygen or other elements such as Mg or Si and thus deplete Li more efficiently on their way to the MS. A more detailed abundance analysis is clearly needed.
More in general, it is now clear that PMS Li depletion among cool stars is mainly determined by convective mixing, but it is likely to depend on some additional still unknown factor, which either inhibit or accelerate Li depletion; a difference in this unknown factor would then be the reason for the spread observed among the Pleiades and IC 2602 stars. Note that the possibility of a major age dispersion among the Pleiades and IC 2602 members has been excluded by Soderblom et al. (sod93 (1993)) and S97, respectively. Theoretical models have been constructed showing that high rotation and the presence of magnetic fields (which are connected to rotation via the dynamo mechanism) may inhibit and/or increase Li depletion. Martín & Claret (mc96 (1996)) suggested that rapid rotation should inhibit Li destruction among low mass stars; on the other hand, Mendes et al. (men99 (1999)) found that fast rotation decreases Li depletion in fully convective stars, but increases it in presence of radiative core; their conclusion was that the structural effects of rotation on PMS Li depletion in low mass stars are not able to bring theory in agreement with observations. Ventura et al. (ven98 (1998)) and, more recently, D’ Antona et al. (dan00 (2000)) have studied the effect of the presence of a magnetic field on Li depletion; they found888Calculations are presented for a 0.95 M⊙ only. that even a relatively small field, independently on the convection treatment, affects the efficiency of convection leading to lower Li destruction. As a matter of fact, however, nor the Pleiades neither the IC 2602 stars below 4500 K (nothing can be said about IC 2391 for which we observe no Li dispersion) show any evident Li–rotation-activity (which is the standard proxy of surface magnetic fields) correlation supporting theoretical prediction.
6 Summary and conclusions
We have discussed lithium abundances in the young clusters IC 2602 and IC 2391 for X-ray selected samples of cool stars whose bona fide membership has been confirmed on the basis of radial velocity measurements and various spectroscopic indicators. We have also determined for the first time the metallicity of the two clusters which turned out to be [Fe/H] and , for IC 2602 and IC 2391, respectively. A reanalysis of two Pleiades stars gives [Fe/H].
The comparison of the Li EWs and Li abundances for IC 2602 and IC 2391 stars with the Pleiades confirms the previous finding by R97 that late–G and early–K stars in IC 2602 already present a star to star scatter in Li abundances similar to, although not as large as the one in the Pleiades. This indicates that the scatter is already present at 35 Myr and must develop during the PMS. IC 2391 seem to show less scatter than IC 2602; our present samples do not allow us to exclude that this is not due to low number statistics and/or observational biases. If this finding is due to a real difference in the distributions, it suggests that the amount of scatter at any given age (i.e. the mechanisms responsible for the scatter) may depend on the individual cluster and on possibly different initial conditions. Whereas the scatter appears to be related to rotation for early–K Pleiades and the Alpha Persei stars, we find less evidence for a dependence on rotation in IC 2602.
Stars more massive than show no sign of depletion in both clusters, while cooler stars are all lithium depleted, with the amount of depletion increasing to cooler temperatures. The distribution of Li abundances vs. Teff is similar for the two IC clusters down to 5000 K, but at lower temperatures the stars of IC 2391 tend to have less lithium than the stars of IC 2602 of comparable temperature. Our data also suggest that the lithium “chasm” may start at bluer colors in IC 2391 than in IC 2602, although our samples are again too small to claim any statistical significance for this result.
Some of the coolest stars in IC 2602 (and a fortiori in IC 2391) appear in fact as depleted as the lowest lithium stars in the Pleiades, once proper account is taken of the effective temperature variation, for a star of a given mass, between the age of the IC clusters and the Pleiades; this means that at the age of the Pleiades, part of the stars in IC 2602 and most of IC 2391 members are expected to be more lithium depleted than stars of the same mass in the Pleiades, implying an overall slower Li destruction in the latter cluster.
7 Appendix
Several sources of uncertainty affect the final iron abundances; more specifically, one has to consider (1) errors which act on individual lines ( hereafter and in Table 5) including random errors on EW measurements, on gf-values, and on damping constants and (2) errors which affect the entire set of lines ( hereafter and in Table 5), the latter mainly including random uncertainties on atmospheric parameters. To these, possible external errors originating from the effective temperature and/or microturbulence scale and from the choice of model atmospheres have to be added.
The standard deviation of the mean abundance from all the analyzed lines provides a reasonable approximation for . Typical errors in our measurements of Fe i line EWs are of the order of 5–15 mÅ. This reflects into a difference in iron abundance between (Fe) dex (for EW=5 mÅ and a strong line) and (Fe) dex (for EW=15 mÅ and a weak line) which has to be divided by , being the number of lines, to infer the error in the final Fe abundance for each star. Correspondingly, considering that we have used between three and seven lines, errors in the range dex are expected. To these, errors due to uncertainties in atomic parameters have to be added; in order to estimate them, we changed gf-values and enhancement factors (Eγ) by 10 and 50 %, respectively: the change of gf-values resulted in a change of the iron abundance (relative to the Sun) of dex, while the change in Eγ resulted in a change of dex (depending on the microturbulence). This, besides showing that errors in EWs dominate with respect to errors in atomic parameters, indicates that our assumption for errors is reasonable.
Errors due to uncertainties in stellar parameters (Teff, ,
and ) were estimated
by running the abundance code varying one of the parameters without
changing the others. This was done for the coolest and the warmest stars
in our sample (R 29 and R 21, respectively);
for each of the three parameters,
the largest variation in (Fe) was then taken as a
conservative estimate of the error; more specifically,
we obtain that
100 K
uncertainty in Teff, 0.25 dex in , and 0.3 km/s
in , reflect into errors of 0.072, 0.028, and 0.05 dex in
(Fe), respectively. Assuming errors in surface
gravities and microturbulence velocities of the order of
0.25 dex and 0.3 km/sec and considering errors in effective temperatures
()
listed in Table 2 (or inferred in the same way for stars in R97 sample and
the two Pleiades stars), the final error in abundance due to
errors in the atmospheric parameters is:
, with
.
External uncertainties are more difficult to assess. No trends of iron abundance vs. EW were found, neither a systematic difference between abundances from low and high excitation lines, suggesting that the effective temperature and microturbulence scales should not be largely in error. On the other hand, whereas the effective temperature quoted for the two Pleiades stars by King et al. (2000a ) is very similar to the temperature inferred by us, the assumed microturbulence values differ by 0.6 km/sec (which would lead to a difference in [Fe/H] of the order of dex). Possible uncertainties due to model atmospheres or, more in general, to the abundance code were estimated by deriving [Fe/H] for the Pleiades star hii 676 using the same atomic and stellar parameters as King et. al., but our abundance code. The mean abundance (relative to the Sun) inferred with our code is [Fe/H]= to be compared with [Fe/H] obtained as the average abundance from the same lines analyzed by King et al., suggesting an external error in [Fe/H] of the order of 0.05 dex.
Acknowledgements.
This research was supported by NSF grants AST-9618335 and AST-9819870 to SCB. We thank the referee, Dr. R. Jeffries, for his very useful comments and suggestions.References
- (1) Balachandran, S., Lambert, D.L., and Stauffer, J.R., 1996, ApJ, 470, 1243
- (2) Barnes, S.A., Sofia, S., Prosser, C., and Stauffer, J.R., 1999, ApJ, 516, 263
- (3) Barrado y Navascués D., Stauffer, J.R., and Patten, B.M., 1999, ApJ, 522, L53
- (4) Basri, G., 1997, Mem. SaIt, 68, 917
- (5) Bessel, M.S., 1979, PASP, 91, 589
- (6) Bessel, M.S., 1991, AJ, 101, 662
- (7) Bessel, M.S., and Weis, E.W., 1987, PASP, 99, 642
- (8) Boesgaard, A.M., and Friel, E.D., 1990, ApJ, 351, 467
- (9) Braes, L.L.E., 1962, Bull. Astron. Inst. Neth., 16, 297
- (10) Carlsson, M., Rutten, R.J., Bruls, J.H.M.J., and Shchukina, N.G., 1994, A&A, 288, 860
- (11) Carretta, E., and Gratton, R.G., 1997, A&AS, 121, 95
- (12) Chaboyer, B., Demarque, P., and Pinsonneault, M.H., 1995, ApJ, 441, 876
- (13) D’ Antona, F., Ventura, P., and Mazzitelli, I., 2000, ApJ, 543, L77
- (14) D’ Antona, F., and Mazzitelli, I., 1994, ApJS, 90, 467
- (15) Deliyannis, C.P., 2000, in Stellar Clusters and Associations: Convection, Rotation, and Dynamos, R. Pallavicini, G. Micela, and S. Sciortino (eds), ASP Conf. Ser. 198, 235
- (16) García López, R.J., Rebolo, R., and Martín, E.L., 1994, A&A, 282, 518
- (17) Gratton, R.G., and Sneden, C., 1991, A&A, 241, 501
- (18) Jeffries, R.J., 2000, in Stellar Clusters and Associations: Convection, Rotation, and Dynamos. R. Pallavicini, G. Micela, and S. Sciortino (eds), ASP Conf. Ser. 198, 245
- (19) Jeffries, R.D., and James, D.J., 1999, ApJ, 511, 218
- (20) Jeffries, R.D., James, D.J., and Thurston, M.R., 1998, MNRAS, 300, 550
- (21) Jones, B.F., Shetrone, M., Fisher, D., and Soderblom, D.R., 1996, AJ, 112, 186
- (22) Jones, Fischer, D., B.F., Shetrone, M., and Soderblom, D.R., 1997, AJ, 114, 352
- (23) Jones, B.F., Fisher, D., and Soderblom, D.R., 1999, AJ, 117, 330
- (24) King, J.R., Soderblom, D.R., Fisher, D., and Jones, B.F., 2000, ApJ, 533, 944
- (25) King, J.R., Krishnamurthi, A., and Pinsonneault, M.H., 2000, AJ, 119, 859
- (26) Kirkpatrick, J.D., Kelly, D.M., Rieke, G.H., and Liebert, J., 1993, ApJ, 402, 643
- (27) Kurucz, R.L., 1995, private communication
- (28) Leggett, S.K., Allard, F., Berriman, G., Dahn, C.C., and Hauschildt, P.H., 1996, ApJS, 104, 117
- (29) Martín, E.L., 1997, Mem. SaIt, 68, 905
- (30) Martín, E.L., and Claret, A., 1996, A&A, 306, 408
- (31) Martín, E.L., and Montes, D., 1997, A&A, 318, 805
- (32) Martín, E.L., Rebolo, R., Magazzú, A., and Pavlenko, Ya.V., 1994, A&A, 282, 503
- (33) Mendes, L.T.S., D’ Antona, F., and Mazzitelli, I., 1999, A&A, 341, 174
- (34) Meola, G., Pallavicini, R., Randich, S., Stauffer, J.R., and Balachandran, S.C., 2000, in Stellar Clusters and Associations: Convection, Rotation, and Dynamos, R. Pallavicini, G. Micela, and S. Sciortino (eds), ASP Conf. Ser. 198, 285
- (35) Micela, G.Sciortino, S.; Kashyap, V.; Harnden, F. R., Jr.; Rosner, R., 1996, ApJS, 102, 75
- (36) Pasquini, L., 2000, in IAU Symposium 198: “The Light Elements and their Evolution”, L. da Silva, M. Spite, and J.R. de Medeiros (eds), p. 245
- (37) Patten, B.M., and Simon, T., 1996, ApJS, 106, 489
- (38) Pavlenko, Y.V., Rebolo, R., Martín, E.L., García López, R.J., 1995, A&A, 303, 807
- (39) Pinsonneault, M.S., Stauffer, J.R., Soderblom, D.R., King, J.R., and Hanson, R.B., 1998, ApJ, 504, 170
- (40) Prosser, C.F., Randich, S., and Stauffer, J.R., 1996, AJ, 112, 649
- (41) Randich, S., Schmitt, J.H.M.M., Prosser, C.F., and Stauffer, J.R., 1995, A&A, 300, 134
- (42) Randich, S., Aharpour, N., Pallavicini, R., Prosser, C.F., and Stauffer, J.R., 1997, A&A, 323, 86
- (43) Randich, S., Martín, E.L., García López, R., and Pallavicini, R., 1998, A&A, 333, 591
- (44) Soderblom, D.R., Jones, B.F., Balachandran, S., et al., 1993, AJ, 106, 1059
- (45) Soderblom, D.R., King, J.R., Siess, L., Jones, B., and Fisher, D., 1999, AJ, 118, 1301
- (46) Stauffer, J.R. 2000, in Stellar Clusters and Associations: Convection, Rotation, and Dynamos, R. Pallavicini, G. Micela, and S. Sciortino (eds), ASP Conf. Ser. 198, 255
- (47) Stauffer, J.R., Hartmann, L.W., Jones, B.F., and McNamara, B.R., 1989, ApJ, 342, 285
- (48) Stauffer, J. R.; Caillault, J.-P.; Gagne, M.; Prosser, C. F.; Hartmann, L. W., 1994, ApJS, 91, 625
- (49) Stauffer, J.R., Hartmann, L.W., Prosser, C.F., Randich, S., Balachandran, S., et al., 1997, ApJ, 479, 776
- (50) Stauffer, J.R., Schultz, G., and Kirkpatrick, J.D., 1998, ApJ, 499, L199
- (51) Unsöld, A., 1955, Physik der Sternatmosphären, Springer-Verlag, Berlin
- (52) Ventura, P., Zeppieri, A., Mazzitelli, I., and D’ Antona, F., 1998, A&A, 331, 1011
- (53) Whiteoak, J.B., 1961, MNRAS, 123, 245