An astrophysical oscillator strength for the Sii
94.7 nm
resonance line and S abundances in DLAs .
††thanks: based on data from the ORFEUS II mission,
the Hubble Space Telescope, the International
Ultraviolet Explorer and the ESO Very Large Telescope
Abstract
By using UV spectra for the O star HD 93521 taken with the ORFEUS II echelle spectrograph, we determine an “astrophysical” value for the Sii 94.7 nm line: , error at 1 level. This is almost a factor of 30 smaller than the guessed value found in the Kurucz database (), which was up to now the only one available for this transition. We use our “astrophysical” to investigate the S abundance in two Damped Ly absorption systems (DLAs) observed with UVES at the ESO 8.2m Kueyen telescope. In the case of the absorber at towards QSO 0347-3819 we find a sulphur column density which is consistent, within errors, with that determined by Centurión et al by means of the 125.9 nm line, thus providing an external check on the accuracy of our value. For the damped absorber at towards BR J0307-4945 we determine a high value of the S abundance, which, however, is probably the result of blending with Ly forest lines.
keywords:
02.01.3-atomic data ; 09.01.2 ISM: abundances ; 11.17.1 quasars: absorption lines; 11.17.3 quasars: individual QSO 0347-3819 ; 11.17.3 quasars: individual BR J0307-4945 ; 08.09.2 Stars: individual HD 935211 Introduction
In the chemical study of DLAs the importance of S is twofold: first it traces the elements, which are synthesized mainly by Type II SNe, so that the /iron–peak ratio provides an important constraint on the chemical history of the observed material, and second S is known to be essentially undepleted onto dust grains (Savage & Sembach 1996), at variance with what happens for Si, which is the element most commonly observed in DLAs. Therefore the S abundance in the gas phase measures the actual S abundance in the system (Centurión et al 2000). In the spectrum of BR J0307-4945, obtained with UVES on the ESO-Kueyen 8.2 m telescope during the commissioning of the instrument, a DLA at = 4.4680 is observed. For this system the Sii triplet lines at 125 nm, which are the only ones used so far to determine the abundances of this nucleosynthetically important element (Centurión et al 2000), are not available because they are blended with lower redshift Ly absorbers. We have been able to detect the Sii 94.7 nm resonance line for which, unfortunately, no theoretical or experimental value is available, thus preventing its use in the analysis. The presence of the Sii 94.7 nm line and the lack of a suitable value are tantalizing.
The observations with the echelle spectrograph on board of the ORFEUS II mission allow to observe the Sii 94.7 nm line in the Galactic interstellar medium with both a resolution and signal to noise ratio sufficient for its analysis. We therefore decided to use these data to derive an “astrophysical” value for this transition. Our method is quite simple: we determine the value by requiring that this line yields the same column density as the Sii 125 nm triplet. The most suitable target for this analysis is the well known O star HD 93521. The Sii 94.7 nm line has been clearly detected in its ORFEUS II echelle spectrum by Barnstedt et al (2000). In the present paper we perform a quantitative analysis on this feature. The ORFEUS spectrum covers both the Sii 94.7 nm line and the Sii 125 nm triplet. In order to support our analysis we also make use of archival data from IUE and HST-GHRS both of which contain information on the Sii 125 nm triplet.
2 Observational material
Our data consist of two echelle spectra from the ORFEUS II mission, three echelle spectra observed with the GHRS on board the HST. We also used 128 high resolution large aperture SWP IUE spectra.
The ORFEUS data under study here were described in detail by Barnstedt et al (2000) and instrument description, performance and data reduction by Barnstedt et al (1999). The wavelength coverage ranges from about 91.6 nm to 141.0 nm with a resolution of . Each ORFEUS echelle spectrum consists of 22 echelle orders. We focussed on order 44 (125.421 nm – 128.457 nm), order 45 (122.635 nm – 125.602 nm) and order 59 (93.500 nm – 95.999 nm). Orders 44 and 45 contain the Sii 125 nm triplet while order 59 contains the Sii 94.7 nm line. The ORFEUS data was kindly provided to us by Dr. Kappelmann.
HST data consist of three GHRS echelle spectra, taken with the small science aperture (z0ih020ft, z0ih020gt, z0ih020ht), which we added without any wavelength shift. For each spectrum the resolution is and the exposure time is 144 s. These spectra were already analyzed by Spitzer & Fitzpatrick (1993).
The UVES spectra of the QSOs BR J0307-4945 and 0347-3819 were obtained during the commissioning of the instrument and released by ESO for public use. In the present paper we use one spectrum of BR J0307-4945 taken in the red arm centered at 600 nm with CD #3 and a 11 slit and an exposure time of 4400 s. For QSO 0347-3819 we use the sum of two blue arm spectra, for a total exposure time of 9500 s taken with dichroic #2 and centered at 437 nm CD #2 and a 10 slit. The reduced spectra were provided to us by Dr. M. Dessauges-Zavadsky and Dr. S. D’Odorico who used the UVES data reduction pipeline. Further details on the data reduction may be found in Dessauges-Zavadsky et al (2001) and D’Odorico et al (2001). The resolution is about 40000 for both spectra with S/N in the regions under analysis here.
3 Analysis and results
Since HD 93521 is a fast rotator ( , Lennon et al 1991) all stellar lines are very broad and it is therefore relatively easy to draw a local continuum relative to which the interstellar line may be measured. When we refer to “lines” in the following discussion we always mean the interstellar lines.
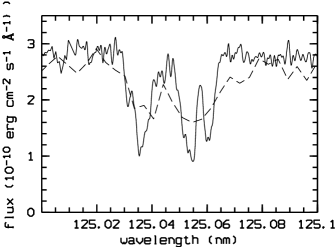
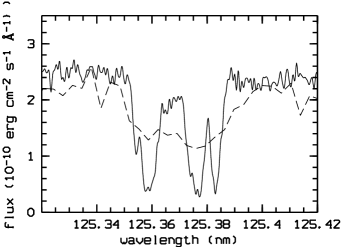
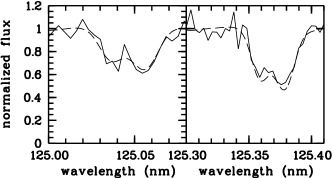
Due to the differences in resolution we could not compare HST data with ORFEUS spectra directly. Even the wavelength scale of the two instruments is not in agreement, as may be appreciated in figures 1–2. By least squares fitting we determined the wavelength shift and broadening to be applied to HST spectra in order to obtain the best agreement with the ORFEUS spectrum. In Fig.3 the degraded HST normalized spectrum is compared to the corresponding ORFEUS spectrum. The spectra have been normalized by fitting a spline through selected continuum points.
Although the HST full resolution spectra show the presence of 9 separate components (Spitzer & Fitzpatrick 1993), at the resolution of ORFEUS only two components are apparent, indicated hereafter as B (blue) and R (red) component. We fitted Voigt profiles to the spectra of the two instruments by using least squares in order to obtain the column density, the value and the mean velocity of the two components of each line of the Sii 125 nm triplet. The atomic data for the transitions under study are summarized in Table 1. The results of the fits are given in Table 2.
A similar exercise was performed also using IUE data, for which we coadded 128 IUE large aperture SWP spectra. The flux of these spectra appeared in disagreement with that of both ORFEUS and HST. We believe this is due to the well known problems of background subtraction in IUE at these short wavelengths. We thus did not further consider the IUE spectrum.
| ref | ||||
|---|---|---|---|---|
| nm | ||||
| 94.6978 | 0.00498 | 4.0 | 4.0 | this paper |
| 125.0584 | 0.00545 | 4.0 | 2.0 | Morton 1991 |
| 125.3811 | 0.01088 | 4.0 | 4.0 | Morton 1991 |
| 125.9519 | 0.01624 | 4.0 | 6.0 | Morton 1991 |
| line | N | b | N | b | |
| Blue | Red | () | |||
| ORFEUS | |||||
| 125.0 | -45.52 | ||||
| 125.4 | -45.52 | ||||
| 125.9 | -47.22 | ||||
| HST | |||||
| 125. | -45.84 | ||||
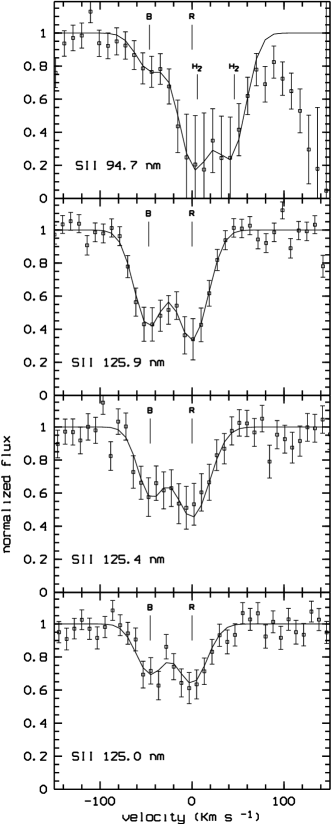
Using the column density, the parameter and the mean velocity for the B and R component of the best fit to the triplet lines we fitted the whole range from 94.6680 nm to 94.7120 nm in order to determine the value of the S ii 94.7 nm line.
We performed the fitting starting with the input parameters deduced from ORFEUS and HST in turn. The R component of the Sii 94.7 nm line is blended with the 94.6986 nm line. For the lines we fixed , as found for all other lines by Gringel et al (2000), while we left the column densities as fitting parameters. For what pertains to the Sii 94.7 nm lines all the parameters where kept fixed except the value. Therefore we had three fitting parameters and 12 degrees of freedom; the results are reported in Table 2.
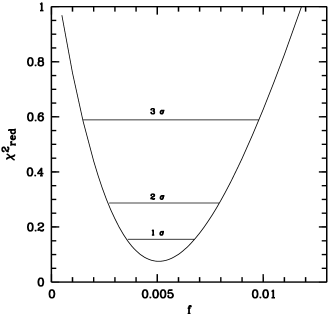
Taking as input the column densities derived from the ORFEUS data the fitted oscillator strength of the S ii 94.7 nm line is
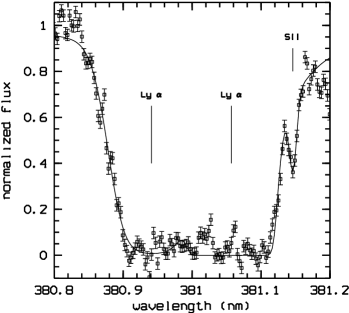
The fit is shown in Fig. 4. The quoted error is the 1 deduced from the analysis, as shown in Fig.5. The oscillator strength found by using the column density deduced from HST data is , in good agreement with that obtained above by using the ORFEUS–based column density.
4 Application to the study of QSO 0347-3819
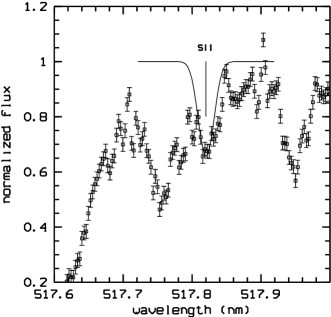
The line–of–sight towards QSO 0347-3819 is characterized by the presence of one damped Ly system with two components very close to each other. The Hi column density has been derived by Pettini et al (1994), while the Sii column density has been measured from the 125.9 nm line by Centurión et al (1998), Ledoux et al (1998) and Prochaska & Wolfe (1999). The measurements of Centurión et al (1998) and Prochaska & Wolfe (1999) agree with each other, within errors, while the value of Ledoux et al (1998) is lower by 0.3 dex. We used the UVES spectrum of this QSO to provide an external check on the accuracy of our value, namely by comparing the column density derived by the 94.7 nm line with the values of Centurión et al (1998) and Prochaska & Wolfe (1999). In Fig. 6 we show the observed spectrum together with our best fit. The Sii 94.7 nm line falls on the wing of a Ly absorber of lower redshift and this needs to be taken into account when modeling the line. We fit the feature successfully using two Ly clouds and one Sii 94.7 nm line, as shown in the figure. The fitted parameters are log (Sii), . Another possible choice is to fit only the red wing of the feature by using one Ly in this case we obtain log (Sii) , the redshift is , . Both the values of the column density found are in perfect concordance, within errors, with the value of Centurión et al (1998): log (Sii) derived from CASPEC spectra using Voigt profile fitting, as we do. They also agree with the value of Prochaska & Wolfe (1999): log (Sii) derived from Keck HIRES spectra using the apparent optical depth method. Our value is very small when compared with found by Centurión et al (1998). One should note however two facts: in the first place Centurión et al (1998) had a resolution of 15.4 , to be compared with 7.1 of the present data; in the second place, because of the lower resolution Centurión et al could not resolve the two components at = 3.02466 and = 3.02486 but fitted a single component with = 3.02476, i.e. the sum of the two. In the UVES spectra the two components are separated as may be appreciated by inspecting several transitions, however for the 94.7 nm line the bluemost component falls in the Ly absorption and is not detectable. Therefore our column density refers to the = 3.02486 system only, while the value Centurión et al refers to the sum of both. It is thus not surprising that our column density is slightly lower than that of Centurión et al. The agreement of our new measurement with those of Centurión et al (1998) and Prochaska & Wolfe (1999), makes it unlikely that the abundance found by Ledoux et al (1998) is the correct one.
To test the influence of the adopted on the derived column density we performed fits using the two extreme values given in the first row of Table 4. For we obtain log (Sii) , for we obtain log (Sii) . The fact that both values are in stark disagreement with the column density of Centurión et al (1998) suggests that the value is more accurate than the formal errors derived from the analysis.
5 Application to the study of BR J0307-4945
This high redshift QSO () shows in its spectrum the DLA at highest redshift so–far known: =4.466. This very complex system, for which no less than 14 separate components are required to describe the low–ions, is studied in detail by Dessauges-Zavadsky et al (2001). We identify the Sii 94.7 nm line at = 4.4666 (component # 8) and at = 4.4680 (component # 13), which are the main components of the system.
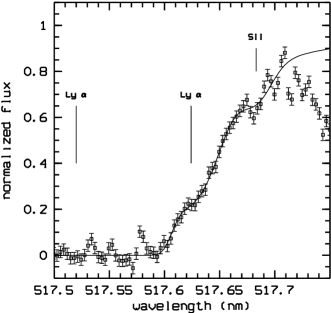
The Sii 94.7 nm line at = 4.4680 is relatively blend-free, although there is clearly some extra-absorption on the red wing. The fitted parameters are log (Sii) , and redshift , the fit is shown in Fig. 7. The sulphur abundance for this system, which has log (Hi) (Dessauges-Zavadsky et al 2001), is therefore [S/H]111we use here the usual notation: ., which is consistent with the upper limit given by Dessauges-Zavadsky et al ([S/H]). By combining our measure of S column density, with the column densities of Dessauges-Zavadsky et al for O, Si and Fe we obtain: [S/O], [S/Si] and [S/Fe]. The above abundance ratios are very peculiar. Non solar S to element ratios are not theoretically excluded, although observationally this would be the first occurence of such a case. Most likely the line could be contaminated by a Ly, in which case our measure should be considered as an upper limit to the S abundance.
The line of the = 4.4666 system is blended with Ly absorbers of lower redshift. We obtain a reasonable fit corresponding to log (Sii) , and redshift . The result depends strongly on the modeling of the Ly absorption, therefore, although the fitted redshift is in good agreement with that of component # 8 of Dessauges-Zavadsky et al (2001), we consider this as a tentative identification.
6 Conclusions
By requiring that the Sii 94.7 nm line and the Sii 125 nm triplet provide the same Sii column density in the line of sight towards HD 93521 we have been able to deduce an “astrophysical” value for the Sii 94.7 nm line. The error, of the order of 30%, is essentially associated to the noise present in the spectra. As an external check of the accuracy of our value we used the Sii 94.7 nm at =3.02486 towards QSO 0347-3819 to determine the Sii column density and were able to confirm, within errors, the value found from the 125.9 nm line by Centurión et al (1998). This result gives us further confidence in our value and suggests that the accuracy is better than these formal error estimates. We warn the readers that the value log listed for the Sii 94.7 nm in table 3 of Barnstedt et al (2000) is a guessed value which comes from the Kurucz (1993) database. This value is almost a factor of 30 larger than our “astrophysical” value (log ) and should not be used in sulphur abundance analysis.
As an application we derived the Sii column density in the absorption system at = 4.4680 towards BR J0307-4945. In this system the S column density cannot be derived from the 125 nm triplet because of blending with Ly clouds. The high [S/O] ratio implied by our measurement has no straightforward explanation, which suggests that the line could contaminated.
Acknowledgements
We are grateful to Dr. Kappelmann for providing the ORFEUS data and to Dr. Dessauges-Zavadsky and Dr. D’Odorico for sharing with us the reduced UVES data.
References
- [1] Barnstedt J., Kappelmann N., Appenzeller I., Fromm A., Gölz M., Grewing M., Gringel W., Haas C., Hopfensitz W., Krämer G., Krautter J., Lindenberger A., Mandel H., Widmann H., 1999, A&AS, 134, 561
- [2] Barnstedt J., Gringel W., Kappelmann N., Grewing M., 2000, A&AS, 143, 193
- [3] Centurión, M., Bonifacio P., Molaro P., Vladilo G., 2000, ApJ, 536, 540
- [4] Centurión, M., Bonifacio P., Molaro P., Vladilo G., 1998, ApJ, 509, 620
- [5] Dessauges-Zavadsky M., D’Odorico S., McMahon R.G., Molaro P., Ledoux C., Péroux C., Storrie-Lombardi L.J., 2001, A&A submitted
- [6] D’Odorico S., Dessauges-Zavadsky M., Molaro P., 2001, A&A submitted
- [7] Gringel W., Barnstedt J., de Boer K.S., Grewing M., Kappelmann N., Richter P., 2000 A&A 358, L37
- [8] Kurucz R.L. , 1993, CD-ROM n. 18, Smithsonian Astrophysical Observatory, http://cfaku5.harvard.edu/LINELISTS.html
- [9] Ledoux C., Petitjean P., Bergeron J., Wampler E.J., Srianand R., 1998, A&A 337, 51
- [10] Lennon D.J., Dufton P.L., Keenan F.P., Holmgren D.E., 1991, A&A 246, 175
- [11] Morton D.C., 1991, ApJS, 77, 119
- [12] Pettini M., Smith L.J., Hunstead R.W., King D.L., 1994 ApJ, 426 79
- [13] Prochaska J.X., Wolfe A.M., 1999, ApJS, 121, 369
- [14] Savage , Sembach , 1996, ARA&A, 34 279
- [15] Spitzer L. Jr., Fitzpatrick E.L., 1993, ApJ, 409, 299
- [16] Vladilo G., Centurión M., Bonifacio P., Howk C., 2001 ApJ submitted