The angular power spectrum of radio emission at 2.3 GHz
We have analysed the Rhodes/HartRAO survey at 2326 MHz and derived the global angular power spectrum of Galactic continuum emission. In order to measure the angular power spectrum of the diffuse component, point sources were removed from the map by median filtering. A least-square fit to the angular power spectrum of the entire survey with a power law spectrum , gives in the range . The angular power spectrum of radio emission appears to steepen at high Galactic latitudes and for observed regions with , the fitted spectral index is . We have extrapolated this result to 30 GHz (the lowest frequency channel of Planck) and estimate that no significant contribution to the sky temperature fluctuation is likely to come from synchrotron at degree-angular scales.
Key Words.:
Radio continuum: ISM – Surveys – cosmic microwave background – Techniques: image processing1 Introduction
The accuracy with which we are able to derive the cosmological parameters from the angular power spectrum of the cosmic microwave background (CMB) depends on the properties of Galactic and extra-galactic foreground emission. The future satellite missions Planck (ESA) and MAP (NASA) designed to perform high precision observations of the CMB have a wide frequency coverage in order to disentangle the various components of the microwave sky and provide clean CMB maps. The two satellites, therefore, will also provide new high quality data on Galactic diffuse emission and extra-galactic sources (Bersanelli et al. (1996)). However before these observations become available it is important to improve our knowledge of the statistical properties of the foreground emission in order to quantify the level of contamination of the CMB signal expected in the various channels and at the different angular scales. This will allow more realistic simulations of the missions to be performed and the analysis techniques to be refined.
Below 50 GHz measurements of the CMB anisotropy are mostly affected by Galactic radio emission: a combination of thermal bremsstrahlung from ionized gas, synchrotron radiation from cosmic ray electrons and possibly emission from spinning dust grains (de Oliveira-Costa et al. (1999)). As pointed out by Tegmark et al. (2000) when trying to recover the angular power spectrum (APS) of the CMB, the uncertainties in the shape of the APS of a foreground component is a greater source of error than the uncertainties in the frequency dependence. The only available estimates of the APS of synchrotron emission comes from the analysis of the 408-MHz survey of Haslam et al. (1982) and 1420-MHz survey of Reich & Reich (1986). They suggest a power-law spectrum with a spectral index around 2.53.0 down to the maps’ resolution limit (Tegmark & Efstathiou (1996); Bouchet et al. (1996); Bouchet & Gispert (1999)).
Recently the Rhodes/HartRAO radio continuum survey at 2326 MHz (Jonas et al. (1998)) has become available. In this paper we use these new data to derive the APS of the radio continuum at 2.3 GHz for all the observed sky and for high Galactic latitude regions. We then extrapolate the high Galactic latitude results to predict the level of contamination that might be expected from diffuse synchrotron emission in the lowest frequency channel of Planck.
The paper is organized as follows. In Sect. 2 the data from the Rhodes/HartRAO survey are presented and the APS is derived for different regions of the sky, after point source subtraction. In Sect. 3 the simulations which were performed to assess the reliability of our results are described. Simulations and results are discussed in Sect. 4.
2 The angular power spectrum of radio emission at 2.3 GHz
The Rhodes/HartRAO radio continuum survey at 2326 MHz is a single-dish survey of the sky with a resolution (at FWHM) of 20 arcmin (Jonas et al. (1998)). The survey made from the Hartebeesthoek Radio Astronomy Observatory (HartRAO) in South Africa covers the declination range for RA and for most of RA (in the RA range , ). The observations are spatially oversampled both in RA direction (6 arcmin) and in declination direction (1.5 arcmin). The uncertainty in the temperature scale is less than 5 per cent and the error in the absolute zero level is less than 80 mK in any direction.
In order to analyse the global properties of the radio continuum emission at 2326 MHz, the raw data of the Rhodes/HartRAO survey were re-gridded into a HEALPix tessellation. HEALPix is a Hierarchical, Equal Area and iso-Latitude Pixelisation of the sphere designed to support efficiently: local operations on the pixel set, a hierarchical tree structure for multi-resolution applications and the global Fast Spherical Harmonic transform (Górski et al. (1999)). This last property is crucial for fast computation of the APS of a field defined on the sphere. The recent CMB maps obtained from the observations of the balloon-born experiment Boomerang have also been pixelised according to the HEALPix scheme (de Bernardis et al. (2000)).
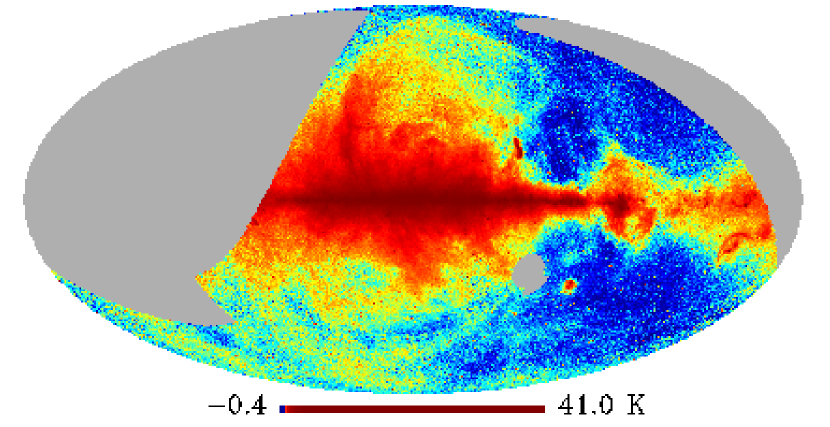
In the HEALPix tessellation the angular size of the pixels is determined by the nside parameter. For the Rhodes/HartRAO survey we used a HEALPix tessellation with nside=512 which corresponds to pixels of linear size 6.9 arcmin and therefore provides an adequate re-sampling of the survey. The Mollweide projection of the raw data of the survey re-gridded into HEALPix is displayed in Fig. 1. A great number of point sources are clearly visible in the map and the survey appears to be heavily affected by noise at the pixel scale.
The APS of a field on a rectangular-domain is given by the Fourier components of the 2-point correlation function. The analogue in spherical geometry are the components of the Legendre polynomial expansion
If is the spherical harmonic decomposition of the field defined on the sphere then the coefficients are simply given by:
| (1) |
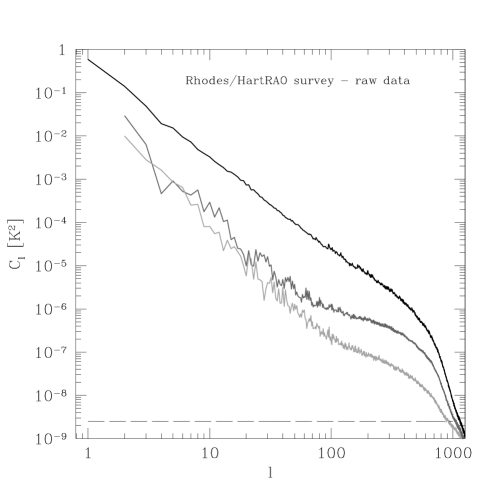
The APS of the Rhodes/HartRAO survey has been obtained by performing a spherical harmonic analysis of the field in the HEALPix grid with the ANAFAST program (the software is part of the HEALPix package available at the web site http://www.eso.org/kgorski/healpix/). The result of the analysis for the whole set of raw data are shown in Fig. 3, as well as the APS derived after imposing a Galactic cut with and the APS derived for 111A Galactic cut with , means that all the data in the latitude range , have been set to zero. The presence of an equatorial cut across the sphere affects the harmonic decomposition of the field. Performing a cut in the space domain is equivalent to multiplying the observed field by a window function and, in the frequency domain, this is equivalent to the convolution of the Spherical Transform of the field with the transform of the window function. As a Galactic cut is a discontinuous window function, its Spherical Transform is affected by aliasing. The resulting APS is affected by slow oscillations, which reflect the envelope of the transformed window function (which in this case is the combination of the incomplete sky coverage with the Galactic cut), and fast oscillations due to the aliasing signal. The oscillations are clearly visible in Fig. 3.
The cylindrical symmetry of a Galactic cut manifests itself as a “coherent” set of terms in m=0, therefore the effect of this window function on the measured APS can be mitigated by implementing a new definition of the APS in which one sets the terms to zero, that is:
| (2) |
Eq. 2 is the definition (which we shall refer to as Modified APS, hereafter) that has been used to obtain the power spectra from the data with a Galactic cut in Fig. 3 and Fig. 4 (grey-lines).
The window function of a Gaussian beam with dispersion is given by:
which means that for a beam with a FWHM of 20 arcmin the beam suppression of the sky APS starts becoming appreciable (transmission factor ) at (). We model the APS of this component of the radio sky as a single power law:
Up to , a linear least-square fit to the APS of all raw data (black line in Fig. 3) gives K and . The APS at high Galactic latitude cannot clearly be described by a single power law up to , however if one attempts a linear fit up to , where the curves flatten, one obtains: K and , for (dark-grey line), and K and for regions with (light-grey line). The noise level of the survey data, as given by Jonas et al. (1998), is also shown in Fig. 3 (dashed line). From the diagram it can be seen that the noise level is well below the signal, in the -range considered.
The flattening of the spectrum at intermediate values of is due to the presence of point sources in the map. In fact, the APS of a population of point sources randomly distributed in the sky is Poissonian, that is a spectrum with constant power at all . As the fluctuation amplitude of the diffuse emission diminishes at small angular scales, the Poissonian component due to the point sources becomes dominant.
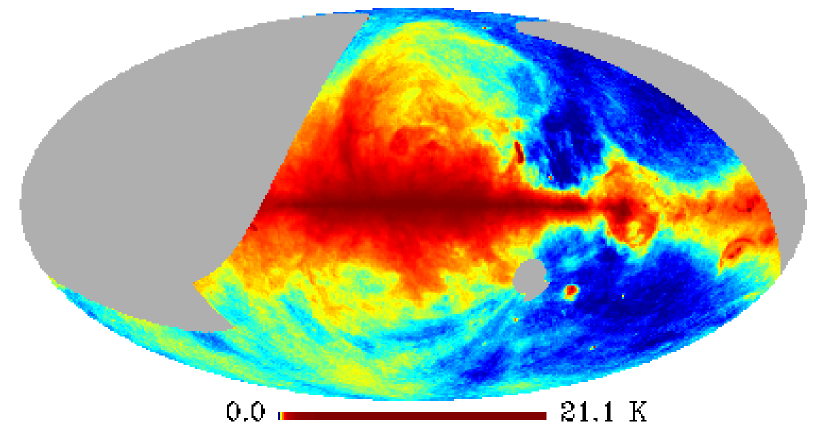
Therefore, in order to analyse the angular power spectrum of the Galactic diffuse emission the point sources should be removed from the maps. Each point source in the map has a profile reflecting the point-spread function (PSF) of the observing beam. On a sufficiently resolved map one could attempt to remove the sources by fitting the pixel temperatures with the PSF. However at this low resolution several sources may be present in any given pixel, thus precluding this treatment. As a way of suppressing the point sources from the data we have made use of a median filter, that is, a convolution of the map with a median box of 99 pixels. A box of size 9 pixels corresponds to the telescope beam size just over 3. Median filtering, is an effective and easy-to-implement method to remove point sources and suppress random instrumental noise (e.g. Pratt (1991)), without losing information at scales greater than three times the beam FWHM. The image of the Rhodes/HartRAO survey after being filtered is displayed in Fig. 2.
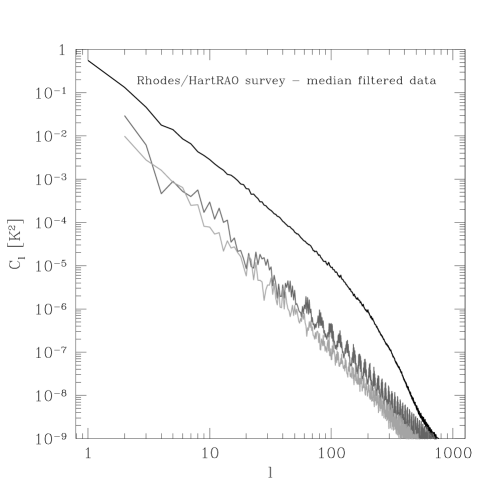
The angular power spectra of the Rhodes/HartRAO survey for different latitude cut-off, after applying median filtering, are plotted in Fig. 4. For all the observed data, up to , the best-fit power-law to the APS has a amplitude K and spectral index . For CMB studies one is particularly interested in the properties of radio emission at high Galactic latitudes because this is where the Galactic signal is weaker and where sensitive CMB measurements can be made. At this frequency the high Galactic latitude diffuse emission is dominated by synchrotron radiation. Indeed the power spectrum of the emission appears to steepen if we mask out the Galactic plane. For a Galactic cut with , a linear least-square fit to the APS up to (dark-grey line) gives K and ; for (light-grey line) one obtains K and . The quoted error takes into account an assessment of the uncertainties introduced by the partial sky coverage, the presence of a Galactic cut and median filtering. We have evaluated this error by performing various simulations, as described in Sect. 3. Note from Fig. 4 how the rapidly falling APS at high Galactic latitude becomes dominated by the aliasing noise from the equatorial cut off at : suppression of the sky signal by the beam-window function is no longer visible.
2.1 Point-source contribution
The difference map of the raw data and the median-filtered data gives the map of the point sources plus the high-spatial-frequency instrumental noise. We have computed the APS of this difference map at high Galactic latitude and compared it with the APS from the source counts expected at 2.3 GHz.
Toffolatti et al. (1998) report the point-source differential counts at 1.4, 5 and 8.44 GHz, for flux ranges between and 10 Jy. It can be seen from Fig.1 of Toffolatti et al. (1998) that a differential source count distribution of the form
| (3) |
can be taken as a reasonable approximation of the source counts at 2.3 GHz in the flux range Jy. Sources with lower flux levels will not contribute significantly to the fluctuation of antenna temperature in a 20 arcmin beam. The reason being that there are so many of these sources in a 20 arcmin beam that changing pointing does not cause significant changes to the average signal (Franceschini et al. (1989)). In addition, the estimated receiver noise level for the Rhodes/HartRAO survey is 25 mK and the measured Point Source Sensitivity (PSS) for the survey is 9.8 Jy/K. This means that point sources with fluxes lower than 0.2 Jy at 2.3 GHz are below the map noise level.
We produced 10 realisations of 40,000 point sources with source counts of the form given in Eq. 3, in the flux range Jy, randomly distributed in the sky222In order to assess whether 10 realisations were enough to characterize the population of point sources we generated another 20 realisations and found that the mean of all the 30 realisations was within one standard deviation of the 3 subsamples of 10 realisations each. We convolved the realisations with a Gaussian beam with 20 arcmin FWHM333The convolution was performed in the spatial-domain, to prevent any aliasing effect due to the point-like nature of the source signal. The convolving Gaussian beam was truncated at and computed the APS for each one. The APS of a randomly distributed population of point sources is given by
| (4) |
where is the flux cut (Tegmark & Efstathiou (1996)). Therefore the amplitude of the APS of different realisations of point-sources with the same differential source counts distribution will vary slightly accordingly to the fluxes of the brightest sources present.
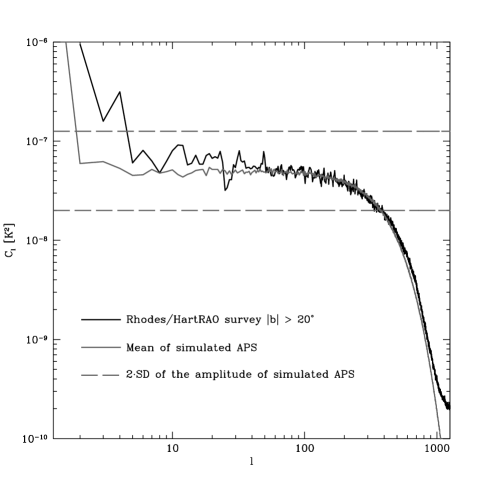
In Fig. 5 we show the APS of the sources extracted from the Rhodes/HartRAO survey by median filtering for sky regions with (black line). The results can be compared with the mean APS of the 10 realisations of sources with differential counts distribution given by Eq. 3 (continuous grey line). In the figure the standard deviation (SD) of the amplitude of the APS of the 10 realisations of point sources is also reported (dashed grey line). The APS of the point sources extracted from the Rhodes/HartRAO survey is consistent with a population of point sources having differential source counts of the form given in 3, randomly distributed in the sky.
Comparing angular power spectra is not the ideal way of comparing source count distributions. As can be seen from Eq. 4 the coefficients are given by the integral of the distribution up to a flux-cutoff, therefore different source count distributions can give angular power spectra of the same amplitude. However the APS of the point-source distribution is the quantity used to predict the level of contamination to CMB anisotropy coming from extra-galactic point sources (Toffolatti et al. (1998); Hobson et al. (1999)). This result indicates that the basic assumptions on the spatial and flux distribution of extra-galactic radio sources used in CMB studies reproduce correctly the observations at 2.3 GHz made with a 20-arcmin FWHM beam.
3 Simulations
The incomplete sky coverage of the Rhodes/HartRAO data, point source suppression by median filtering and the presence of a Galactic cut affect the accuracy with which the angular power spectrum at high Galactic latitude may be recovered. In order to assess the impact of these factors on the estimates of the APS of diffuse radio emission we have performed a series of simulations and reproduced the processing procedure used on the real data.
We have produced two sets of simulations: one for an input APS with a spectral index of and the other for an input APS with . For each set we generated 10 different realisations of a Gaussian random field on the sphere having that input APS. For this purpose we used the SYNFAST software (also part of the HEALPix software package). All the realisations were generated at a resolution of 20 arcmin (FWHM) and sampled into HEALPix maps with nside = 512, as in the case of the Rhodes/HartRAO map. From these we computed the APS for three different conditions: total sky coverage, Galactic plane cutoff with and partial sky coverage plus Galactic cutoff (). For an input APS with we also considered the case in which a population of spatially random point sources is added onto the simulated diffuse emission.
3.1 Diffuse emission only
In Fig. 6 the means of the derived APS from 10 different realisations of a spectrum with spectral index are shown. The curves are for the three different cases considered, that is deriving the APS from full sky maps of the realisations, from maps with a Galactic cutoff with and from maps with coverage identical to that of the Rhodes/HartRAO survey plus a Galactic cutoff. With a Galactic cutoff both the usual definition for the APS and the Modified APS definition have been used. As seen from Fig. 6, in this case, the incomplete sky coverage and the presence of a Galactic cutoff do not affect the recovery of the input APS in a substantial way, and there is no appreciable difference between the standard APS definition and the Modified definition.
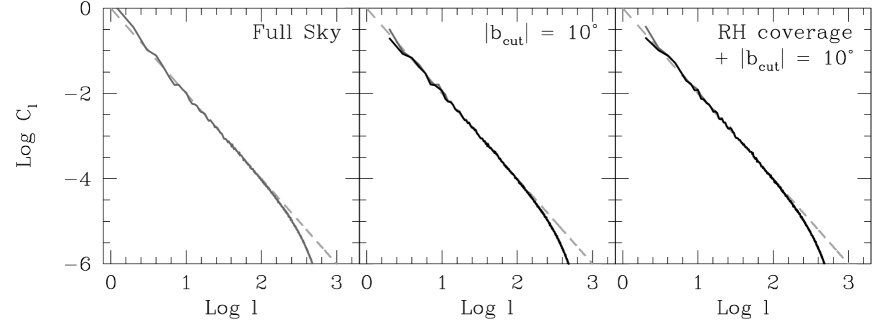
In order to quantify the accuracy of the recovery we have computed the best-fit power law of the spectra obtained from the 10 realisations, in the three different cases of sky coverage. The amplitude and spectral index of these best-fit power laws can be compared with the true amplitude and spectral index of the APS used as input for the 10 realisations. The standard deviation of the derived amplitudes and spectral indices with respect to the true (input) values provides an estimate of the standard error on the recovered amplitude and spectral index. The results are summarised in Table 1. For a full sky coverage the uncertainty in the measured spectral index over the -range 2–200 is of about 2% as can be seen simply by taking the standard deviation over the mean. An incomplete sky coverage such as the one of the Rhodes/HartRAO survey plus the introduction of a Galactic latitude cutoff brings this uncertainty up to 4%. The error on the amplitude of the power law is not significantly affected by a diminished sky coverage.
| input | Sky coverage | mean | SD | mean | SD |
|---|---|---|---|---|---|
| Full Sky | 1.0 | 0.5 | 2.04 | 0.05 | |
| 2 | 1.0 | 0.5 | 2.04 | 0.06 | |
| RH | 1.0 | 0.5 | 2.07 | 0.08 | |
| Full Sky | 1.1 | 0.7 | 3.04 | 0.05 | |
| 3 | 1.1 | 0.7 | 3.02 | 0.04 | |
| RH | 1.1 | 0.8 | 3.05 | 0.06 |
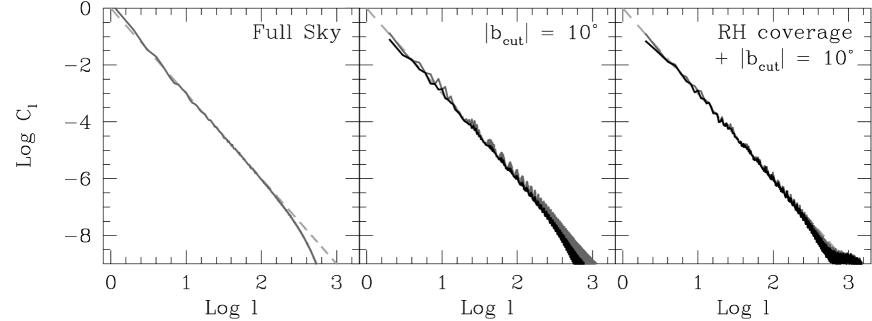
The same cases of sky coverage have been considered also for an input APS with spectral index . Fig. 7 shows the mean of the recovered spectra from 10 different sky realisations of the input APS. In this case the derived spectra are more strongly affected by a Galactic cutoff and an incomplete sky coverage. The modulation of the APS caused by introducing the Galactic plane cutoff is clearly visible in the figure (middle panel). The figure also shows how the use of the Modified APS definition helps in reducing such aliasing.
The convolution of the field Spherical Transform by the Spherical Transform of the sky coverage window (which is undersampled) introduces a coupling between the coefficients of the field, which is stronger for fields with steeper APS, simply because the gradient in is stronger. This is the reason why an input APS with is barely affected by the incomplete sky coverage, while this has such a strong impact on the measure of an input APS with . In practice the coupling introduced by the sky-coverage window means that no APS with spectral index steeper than can be recovered in the presence an equatorial cutoff or large areas of missing data.
However, despite the aliasing noise introduced by the Galactic plane cutoff and the incomplete sky coverage, one can still recover the spectral index of an input APS with . The parameters resulting from least-square fits to the Modified APS obtained from the 10 realisations are reported also in Table 1. The percentage error on the recovery of the input spectral index from a full-sky observation, is in this case about 1.5% and does not increase substantially with decreasing sky coverage.
3.2 Diffuse emission and point sources
In Sect 2.1 we have described how we generated 10 realisations of a spatially random population of point sources with differential source counts of the form given in Eq. 3. From Toffolatti et al. (1998) one can see how this expression of the differential source counts approximate quite well the extra-galactic source counts that are expected at 2.3 GHz, in the flux range Jy. Sources with flux lower than 0.1 Jy do not contribute significantly to the temperature fluctuations in the Rhodes/HartRAO survey. The 10 different realisations of point sources were then added onto 10 different realisations of an input APS with a spectral index of , normalised to the amplitude of the APS of the Rhodes/HartRAO survey measured for a Galactic cutoff with . Each resulting map, which mimics the superposition of diffuse emission with a Poissonian population of point sources was then convolved with a median filter of size 99. The APS and the Modified APS of the filtered map was then computed. This APS represents a recovery of the spectrum of the diffuse component and can be directly compared with the input spectrum of the diffuse component to assess the systematic error introduced by median filtering the map.
In Fig. 8 the angular power spectra of two simulated skies are shown on the same scale as the data in Fig. 3. As in the case of the real data the flattening of the spectrum at high due to the Poissonian APS of the point source component is clearly recognizable. These 2 particular cases of simulated skies mimic quite closely the spectra of the raw data in Fig. 3. In these two cases the fitted-spectral index up to of the input maps (diffuse emission plus sources) are respectively and 444the fit error is given in this case, and after median filtering one obtains and , which are good recoveries of the true spectral index of the simulated diffuse emission.
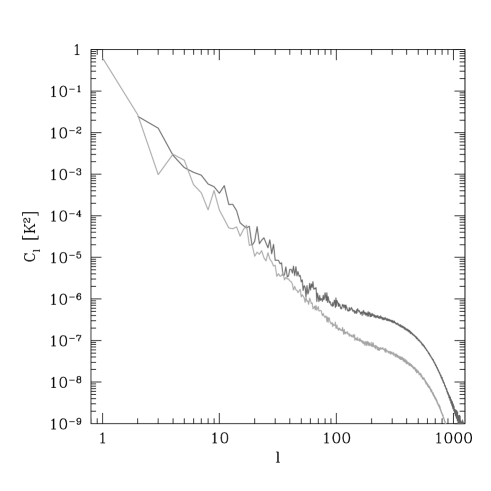
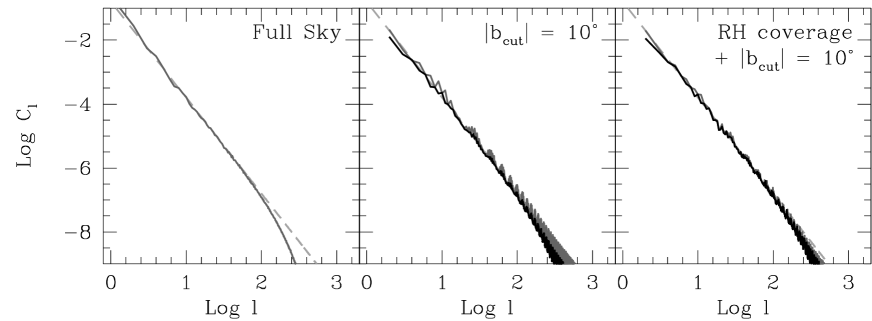
Fig. 9 shows the Mean APS of the diffuse component recovered by median filtering in the three different cases of sky coverage considered. The median filtering suppression of the high frequency signal starts to affect the APS at . Up to this multipole order the filtering process allows the correct spectral index of the input APS to be recovered, with an error lower than 3%, as taken from Table 2. The average spectral index of the spectra of the 10 maps before median filtering is 2.8, with a standard deviation of for .
| Sky coverage | mean | SD | mean | SD |
|---|---|---|---|---|
| Full Sky | 0.3 | 0.2 | 3.04 | 0.08 |
| 0.3 | 0.2 | 3.00 | 0.07 | |
| RH | 0.3 | 0.2 | 3.02 | 0.07 |
4 Discussion
The analysis of the Rhodes/HartRAO data shows that the global APS of synchrotron emission at high Galactic latitudes () is well approximated by a power law spectrum having spectral index . This result at 2.3 GHz is consistent with the results of Tegmark & Efstathiou (1996) and Bouchet et al. (1996) who found a spectral index of up to from the analysis of square patches of the 408-MHz survey. Bouchet & Gispert (1999) also found for from the analysis of patches of the 1420-MHz survey.
Lasenby (1997) found by analysing the 408-MHz and the 1420-MHz surveys in the “Tenerife” patch of sky. This is a degree patch of the northern hemisphere at high Galactic latitude. This could be a local property of that region of the sky. Alternatively, it could be due to the effect of point sources: Lasenby did not attempt to subtract point sources (private communication) and this may have the effect of flattening the spectrum. From Fig. 3 one can see that without point source subtraction the APS of the synchrotron emission has a slope of approximately in the -range 50–150, which is the -range that can be probed with a patch of sky of the size of the “Tenerife patch”, at a resolution of .
A spectral index of has also been derived for the APS of Galactic dust emission (Gautier et al. (1992); Tegmark & Efstathiou (1996); Wright (1998)) and this is the same slope measured for the APS of single velocity neutral hydrogen in the Galaxy (Crovisier & Dickey (1983)). However, Schlegel et al. (1998) report a flatter slope of for dust emission from the combined DIRBE and IRAS dust maps, at high Galactic latitudes.
The simulations we have performed showed that incomplete sky coverage and a Galactic cut do not introduce significant errors when deriving the spectrum of an input field with . This is reassuring since is approximately the spectral index of the APS of the CMB. On the other hand the incomplete sky coverage of the Rhodes/HartRAO survey and a Galactic cut seriously degrade the quality of the spectrum that can be derived from an input field with a spectral index steeper than 3. Therefore, while spherical harmonic decomposition is a suitable tool to analyse the statistical properties of CMB emission with incomplete sky coverage, it is not ideal when one tries to analyse fields whose spectra have index . This highlights the need to refine the analysis tools in view of the new observations of the Galactic diffuse emission that will be carried out by Planck and MAP satellites.
Indeed, one limit of our simulations is that the synthesized diffuse emission is a realisation of a random Gaussian field with a given APS while the Galactic signal is not a spatially random field. The spectral index measured from the map of Galactic radio emission changes significantly as the brightest regions of the Galactic plane are gradually masked off. This does not happen when one applies the same type of masking to a random field. We are planning to study the level of Gaussianity of the Galactic signal from the Rhodes/HartRAO survey data in a future work.
As it is apparent from Fig. 2, the Rhodes/HartRAO survey is affected by a certain level of striping, which reflects baseline instabilities due to ground spillover and weather effects (Jonas et al. (1998)). This is more visible around the South Pole region, where the scans necessarily traversed low elevation angles. This striping, with a typical angular scale of , will introduce some additional power in the spectrum at multipole order . However, as apparent from the map, even at high-Galactic latitudes, the amplitude of these striations are on the average lower than the observed variation of sky brightness temperature, therefore we expect striations to be only a minor contribution to the overall power measured around . The fact that no significant change of slope is observed in the APS after point-source suppression for (Fig. 4), is another indication that striping makes a minor contribution to the total power at a given angular scale. If striping does make a major contribution, then its effect is being disguised by a steeply falling power from the Galactic diffuse emission. So, for the purpose of estimating the contribution of synchrotron emission relatively to the CMB anisotropy, a spectral index of for the synchrotron APS is a conservative estimate.
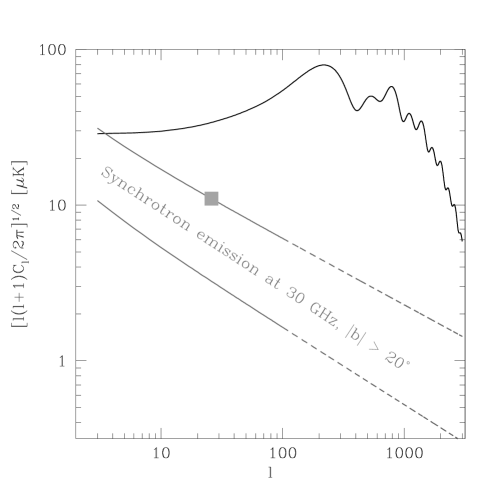
One can use the APS derived at 2.3 GHz to infer the level of contamination of the CMB signal at the different angular scales at 30 GHz: this is the lowest frequency channel of Planck and the one for which the highest level of synchrotron contaminations are expected. On the scale, Kogut et al. (1996) derived an upper limit of 11 to the temperature fluctuations due to synchrotron emission in the COBE DMR channel at 31.5 GHz for Galactic latitudes with . If we combine this limit with our measure of for the spectral index of the APS we derive an upper limit of K for the amplitude of synchrotron emission . This upper-limit to synchrotron emission is shown against a CMB spectrum in Fig. 10, as a function of the multipole order . The APS for the CMB has been computed assuming a flat inflationary model with purely scalar scale-invariant fluctuations, vacuum energy , cold dark matter density and baryon density , (where is the Hubble parameter), as derived by Tegmark & Zaldarriaga (2000) from the latest CMB measurements (de Bernardis et al. (2000); Winant et al. (2000)). From Fig. 10, it is apparent that synchrotron emission can be a significant contribution to the sky anisotropy at 30 GHz at scales larger than , but it is an order of magnitude weaker than the cosmological signal at degree angular scales where the first “acoustic” peak of the CMB is observed. Indeed from COBE observations we know that for the quadrupole (l=2), Galactic emission is comparable in amplitude to the anisotropy of the CMB (Bennett et al. (1996)).
If is the spectral index of the frequency dependency of , then K combined with the value K measured at 2.3 GHz provides a lower limit on the frequency spectral index of , between 2.3 and 31.5 GHz. At large angular scales (), Platania et al. (1998) derive an average value for the spectral index of the synchrotron frequency dependency between 1 and 7.5 GHz of . The spectral index is expected to steepen at frequencies higher than 10 GHz, since the observed energy spectrum of cosmic ray electrons steepens at energy of GeV (Banday & Wolfendale (1990); Banday et al. (1991)).
In order to bracket the synchrotron contribution to the sky fluctuations at 30 GHz one can combine the lowest () boundary of our measure for the amplitude, K, with the lowest boundary of the frequency spectral index derived by Platania et al. (1998), that is : one obtains K. This lower limit on the synchrotron contribution is also shown in Fig. 10 as a function of the multipole order.
Tegmark et al. (2000) give three possible estimates of for Galactic synchrotron emission at 19 GHz and label them as optimistic, pessimistic and “middle-of-road”. Their pessimistic value of 192 K at 19 GHz with a frequency spectral index of , corresponds to a K which is within the range of our estimate, but somewhat on the lower bound.
5 Summary and Conclusions
In order to analyse the global angular power spectrum of Galactic radio emission we have re-sampled the Rhodes/HartRAO Galactic survey at 2326 MHz into a HEALPix map with nside. The point sources were removed from the map by median filtering. We find that a best-fit to the angular power spectrum of the entire Rhodes/HartRAO survey with a power-law spectrum , gives in the range . At high Galactic latitudes, , where CMB observations are carried out, the APS of the radio emission steepens and it is well described by a power-law with spectral index and amplitude K, up to . At these latitudes radio emission is dominated by synchrotron emission. By combining our results with the upper limit of 11 K on the synchrotron contribution to temperature fluctuations at 31.5 GHz, obtained by COBE-DMR for the 7-degree angular scale, we derive an upper limit of K to the amplitude of synchrotron emission at high Galactic latidue. This in turn implies a lower limit of on the spectral index of the frequency dependency of .
With an APS index of and an amplitude K, at 30 GHz synchrotron emission could be a contaminant of CMB observations at large angular scales (), but will not obstruct a clean view of the CMB anisotropy at degree angular scales.
A map of point sources from the Rhodes/HartRAO survey was also obtained. The APS at high Galactic latitude was compared with the prediction derived from extra-galactic source counts, as interpolated between 1.4 and 5 GHz, under the assumption of a purely random sky distribution. The same source counts and the randomness assumption are the bases of the studies that predict the level of temperature fluctuation to be expected from extra-galactic point sources in CMB observations (Franceschini et al. (1989); Toffolatti et al. (1998)). We conclude that at 2.3 GHz and for a resolution of 20 arcmin, predictions of the point source contribution and observations are consistent with each other.
The simulations that we have performed to evaluate the accuracy of the results show that the spectra derived from the Rhodes/HartRAO survey in the -range 2–100 are reliable. Incomplete sky coverage does not compromise the accuracy with which one can derive the APS of the field by spherical harmonic decompoistion, if this field has a spectrum with spectral index . However we have also found that the quality of the spectrum derived degrades significantly for spectral index , if large areas of the sky are missing.
The simulations showed that median filtering can be used to effectively remove point sources and derive the APS of the diffuse component up to , for a beam FWHM of 20 arcmin.
Acknowledgements.
We thank U. Seljak & M. Zaldarriaga for their CMBFAST software, which was used to generate the CMB angular power spectrum.References
- Banday & Wolfendale (1990) Banday A. J., Wolfendale A. W. 1990, MNRAS 245, 182
- Banday et al. (1991) Banday A. J., Wolfendale A. W., Giler et al. 1991, ApJ 375, 432
- Bennett et al. (1996) Bennett C. L., Banday A. J., Gorski K. M. et al. 1996, ApJ Lett. 464, L1
- Bersanelli et al. (1996) Bersanelli M., Griffin B. D., Lamarre J. M. et al. 1996, ”COBRAS/SAMBA Phase A study for an ESA M3 mission (ESA Report D-SCI(96)3)”, European Space Agency
- Bouchet et al. (1996) Bouchet F., Gispert R., Puget J. 1996, Unveiling the Cosmic Infrared Background, ed. E. Dwek (Baltimore:AIP)
- Bouchet & Gispert (1999) Bouchet F. R., Gispert R. 1999, New Astronomy 4, 443
- Crovisier & Dickey (1983) Crovisier J., Dickey J. M. 1983, A&A 122, 282
- de Bernardis et al. (2000) de Bernardis P., Ade P. A. R., Bock J. J. et al. 2000, Nat 404, 955
- de Oliveira-Costa et al. (1999) de Oliveira-Costa A., Tegmark M., Gutiérrez C. M. et al. 1999, ApJ Lett. 527, L9
- Franceschini et al. (1989) Franceschini A., Toffolatti L., Danese L. et al. 1989, ApJ 344, 35
- Gautier et al. (1992) Gautier T. N., Boulanger F., Perault M. et al. 1992, AJ 103, 1313
- Górski et al. (1999) Górski K. M., Hivon E., Wandelt B. D. 1999, in Proceedings of the MPA/ESO Cosmology Conference ”Evolution of Large-Scale Structure” eds. A.J. Banday, R.S. Sheth and L. Da Costa, 37
- Haslam et al. (1982) Haslam C. G. T., Salter C. J., Stoffel H. et al. 1982, A&AS 47, 1
- Hobson et al. (1999) Hobson M. P., Barreiro R. B., Toffolatti L. et al. 1999, MNRAS 306, 232
- Jonas et al. (1998) Jonas J. L., Baart E. E., Nicolson G. D. 1998, MNRAS 297, 977
- Kogut et al. (1996) Kogut A., Banday A. J., Bennett C. L. et al. 1996, ApJ Lett. 464, L5
- Lasenby (1997) Lasenby A. N. 1997, in Microwave Background Anisotropies, Proc. XVI Moriond Astrophysics Meeting, 453
- Platania et al. (1998) Platania P., Bensadoun M., Bersanelli M. et al. 1998, ApJ 505, 473
- Pratt (1991) Pratt W. K. 1991, ”Digital image processing”, John Wiley & Sons, Inc.
- Reich & Reich (1986) Reich P., Reich W. 1986, A&AS 63, 205
- Schlegel et al. (1998) Schlegel D. J., Finkbeiner D. P., Davis M. 1998, ApJ 500, 525
- Tegmark & Efstathiou (1996) Tegmark M., Efstathiou G. 1996, MNRAS 281, 1297
- Tegmark et al. (2000) Tegmark M., Eisenstein D. J., Hu W., de Oliveira-Costa A. 2000, ApJ 530, 133
- Tegmark & Zaldarriaga (2000) Tegmark M., Zaldarriaga M. 2000, Phys. Rev. Lett. 85, 2240
- Toffolatti et al. (1998) Toffolatti L., Argueso Gomez F., de Zotti G. et al. 1998, MNRAS 297, 117
- Winant et al. (2000) Winant C. D., Ade P., Balbi et al. 2000, in American Astronomical Society Meeting, Vol. 196, p. 5502+
- Wright (1998) Wright E. L. 1998, ApJ 496, 1