Time Variable Faraday Rotation Measures of 3C 273 & 3C 279
Abstract
Multifrequency polarimetry with the VLBA confirms the previously reported time-varying Faraday rotation measure (RM) in the quasar 3C 279. Variability in the RM and electric vector position angle (EVPA) of the jet component (C4) is seen making it an unreliable absolute EVPA calibrator. 3C 273 is also shown to vary its RM structure on 1.5 year time-scales. Variation in the RM properties of quasars may result from a Faraday screen which changes on time-scales of a few years, or from the motion of jet components which sample spatial variations in the screen. A new component emerging from the core of 3C 279 appears to be starting to sample such a spatial variation. Future monitoring of this component and its RM properties is suggested as a diagnostic of the narrow line region in 3C 279. We also present a new method of EVPA calibration using the VLA Monitoring Program.
1 Introduction
The parsec-scale cores and jets of quasars have typical linear polarizations of 1-10% (Cawthorne et al., 1993) with the jets being more strongly polarized. If a change in the electric vector position angle (EVPA) of the polarized emission is seen with frequency, and can be attributed to the Faraday effect, then we can learn about the densities and magnetic fields of thermal gas along the line of sight.
High angular resolution polarimetry has shown that some quasars have Faraday Rotation Measures (RM) in excess of rad m-2. In the case of the quasar 3C 279 these high RMs can change over 1.5 years by over 1000 rad m-2 (Taylor (2000) and references therein). These high RMs are present within a projected distance of pc from the core of the quasars. Beyond this distance the RMs decrease to rad m-2, a value consistent with that expected from the passage of the emission through the host galaxy and through the ISM of our own Galaxy.
In §2 we describe VLBA observations of the quasars 3C 273 and 3C 279, with the results of the rotation measure analysis presented in §3. In §4 we discuss our results in light of the unified scheme of AGNs.
We assume H km s-1 Mpc-1 and q0=0.5 throughout.
2 Observations and Data Reduction
The observations, performed on 2000 January 27 (2000.07), were carried out at ten frequencies between 8.1 and 43.2 GHz using the 10 element VLBA111The National Radio Astronomy Observatory is operated by Associated Universities, Inc., under cooperative agreement with the National Science Foundation.. Sources 3C 273, 3C 279, and calibrator J1310+3220 were observed for approximately 2.5 hours each. The calibrator OJ287 was observed for almost one hour. Right- and left-circular polarizations were recorded using 1 bit sampling across a bandwidth of 8 MHz. The VLBA correlator produced 16 frequency channels across each IF during every 2 s integration.
Amplitude calibration and fringe-fitting were performed as in Taylor (2000). Weather, in particular snow on the antenna, caused us to flag the data from Hancock at 43 GHz. We also encountered radio-frequency interference at 12 GHz on our 3C 279 scans, which we attribute to geostationary television broadcasts. This required extensive editing of the 12 GHz data on 3C 279.
Feed polarizations of the antennas were determined using 3C 279 and the AIPS task LPCAL. We assumed that the VLBA antennas had good-quality feeds with relatively pure polarizations, which allowed us to use a linearized model to fit the feed polarizations. Absolute electric vector position angle (EVPA) calibration at 8–22 GHz was determined by using the EVPA of OJ287 obtained on 2000 January 29 listed in the VLA Monitoring Program222http://www.aoc.nrao.edu/smyers/calibration/ (Taylor & Myers 2000). Polarization monitoring observations of J1310+3220 on 1999 December 19 and 2000 February 18 were interpolated to the observation date and employed as a check of the OJ287 calibration (Table 1). At 43 GHz the low polarized flux density from these calibrators prevented an absolute EVPA calibration. To set the EVPA at 43 GHz we performed a linear least-squares fit to the 3C 279 component C4 EVPA data, and used this fit to set the EVPA for 3C 279 at 43 GHz. The correction applied for 3C 279 C4 was then used for the other sources (Fig 1).
Taylor (1998) suggested that C4 may be used as an absolute EVPA calibrator due to its low RM and strong polarized and total flux densities. From 1994 (Leppnen et al., 1995) through 1998 (Lister et al., 1998; Wardle et al., 1998; Denn et al., 2000; Taylor, 2000) component C4 maintained an EVPA oriented nearly parallel to the jet axis. If we define the intrinsic polarization angle (IPA) of a source as the intercept in the RM plot (Simard-Normandin et al., 1981) the IPA of 3C 279 C4 determined by our epoch 2000.07 observations is . The position angle of component C4 is significantly different from the value of found by Taylor (1998). Therefore we conclude that C4 cannot be used as an absolute EVPA calibrator, without complimentary monitoring observations.
3 Results
We present multifrequency radio observations, polarization properties, and rotation measure distributions for 3C 273 and 3C 279. In the rotation measure images presented in figures 2 through 5 the higher frequencies have been tapered to provide a matched restoring beam of the dimensions indicated in the captions.
3.1 3C 273
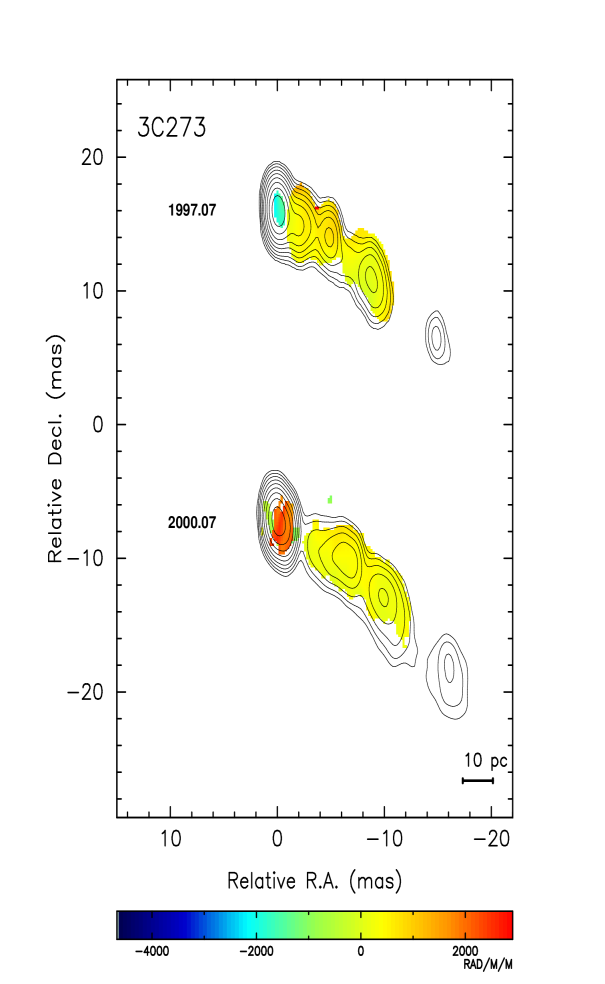
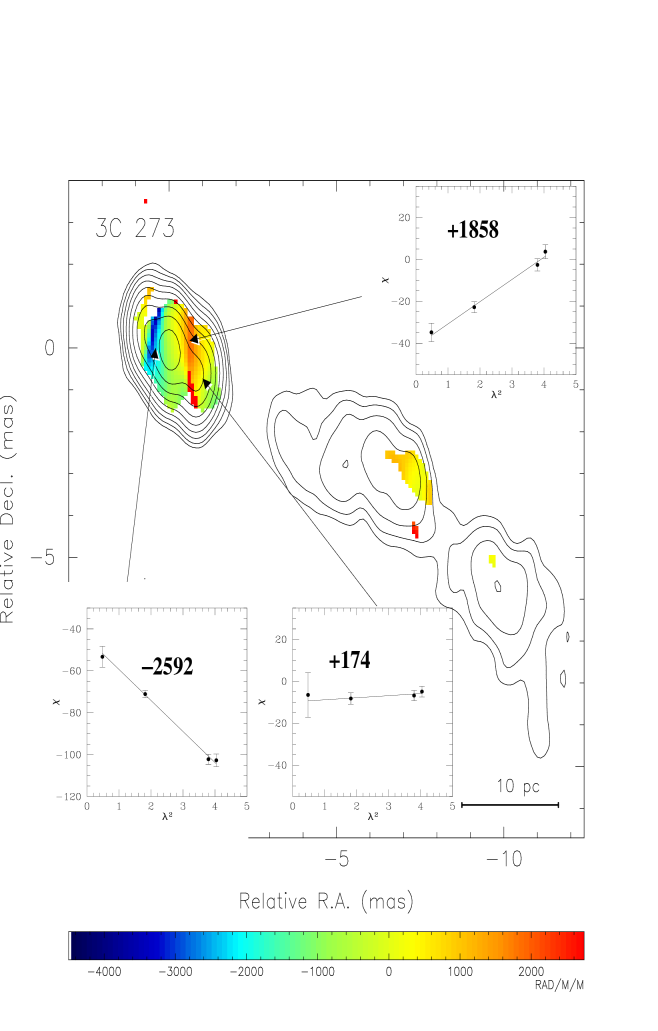
Figure 2 presents a time series RM mosaic for this quasar (epoch 1997.07 from Taylor 1998). Beyond 10 pc from the nuclear region the jet exhibits a relatively smooth and uniform RM distribution of +500 rad m-2. The RM of this region remains constant over a 3 year time span. This jet continues to show good agreement with the law of Faraday rotation. In contrast the nuclear region changes from an apparently smooth 2000 rad m-2 in 1997 to a more complex structure which varies by rad m-2 across 10 pc. To investigate the structure of this complex central region we created a higher resolution RM map in Figure 3. This map consists of data from 15-43 GHz with the high frequency data tapered to the resolution of the 15 GHz data. Inserted in this figure are the data used to obtain the indicated rotation measures. All points used to calculate the RM are at least 1% polarized. The central region consists of sub-components of RM in the range rad m-2. Good agreement to a law is present except in the northeastern-most part of the source, closest to the center of activity.
3.2 3C 279
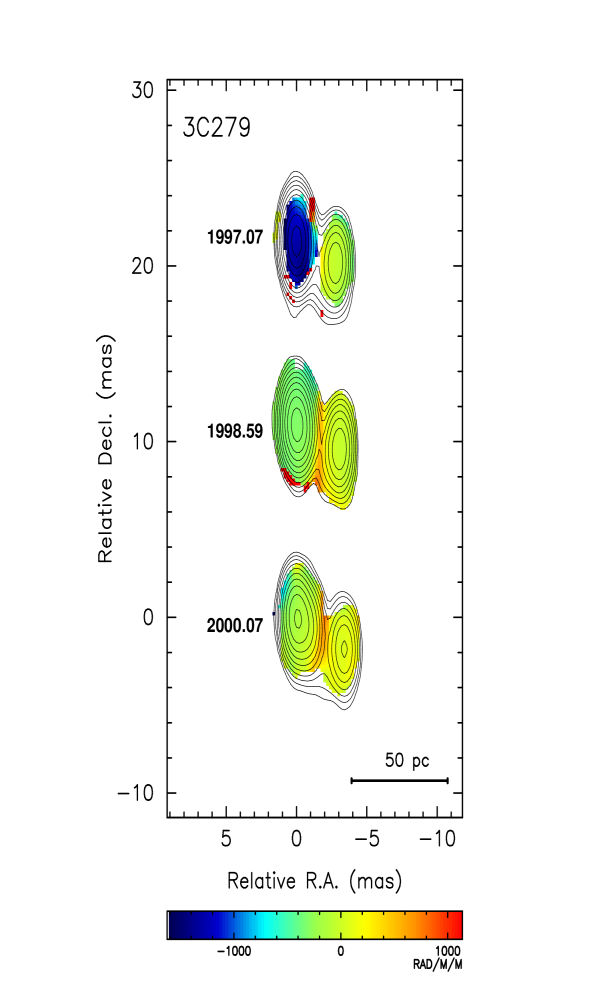
Figure 4 presents a multi-epoch RM map of 3C 279 (first two epochs from Taylor 1998 and Taylor 2000 respectively). The core may be ejecting a new jet component, as shown by the increasing extension of the emission to the southwest over the three epochs. Taylor (2000) previously showed that 3C 279 shows variation in its RM properties. The figure illustrates these changes as the central region of 3C 279 changes from to rad m-2 between the 1997.07 and 1998.5 observations. 3C 279 maintains this lower RM during our 2000.07 observation with the exception of a “bridge” of high RM which appears to connect the central region with component C4 (Leppnen et al., 1995).
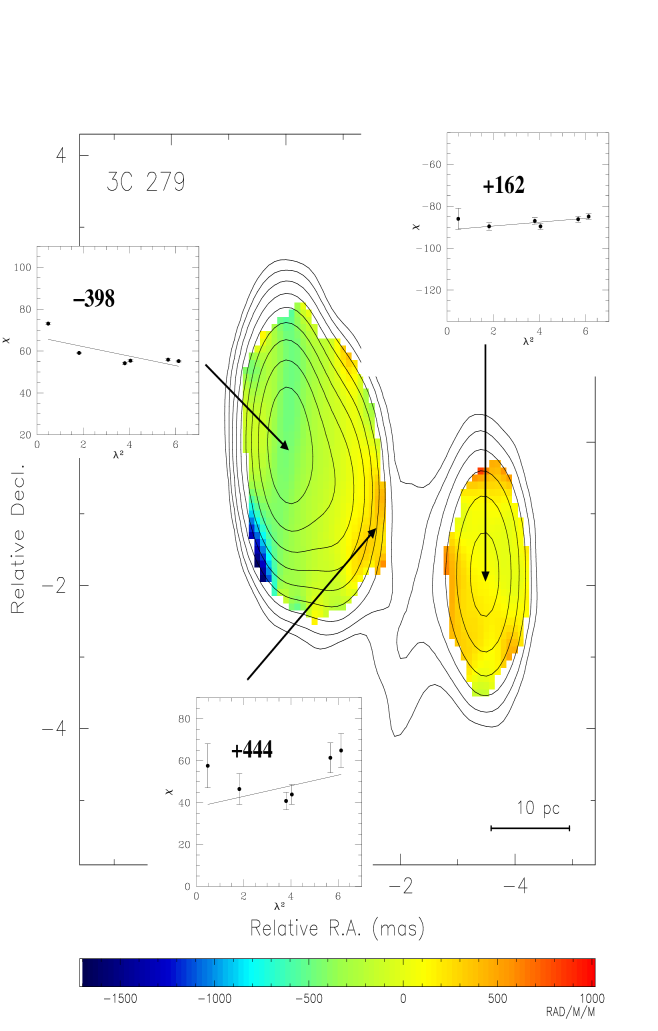
The high resolution RM structure of this quasar is presented in Figure 5. The rotation measures were determined using the 12-43 GHz data tapered to the 12 GHz resolution. The bridge appearing in the low resolution data is resolved and two edges of 500 rad m-2 bordering the central region of the quasar and C4 appear. Points used to fit the RM in the center of the image and in component C4 are at least 1% polarized. Points used in the bridge range from 0.3-0.5% polarized intensity and should be interpreted with caution. The asymmetry of the central region is consistent with the emergence of a new component from the core. This high resolution image also shows the slope of the RM changing from negative at the central peak of emission to a positive slope at the proposed newly emerging component.
4 Discussion
Taylor (1998, 2000) showed variation in the RM structure of AGNs on small spatial scales. For 3C 279 Taylor (2000) presented time variation of the RM structure of 3C 279 over 1.5 years. Our 2000.07 observations show temporal variations in 3C 273 and demonstrate that this phenomenon is not unique to 3C 279. We find good agreement to a law except near the core of 3C 273 and the resolved bridge of 3C 279. The high RMs observed in the central regions could result from the passage of the radiation through the narrow-line region (NLR) of the quasar. If the measured RM results from a polarized component which dominates within the telescope beam then the RM of the central region should vary as new components are created and ejected. As these new components emerge from the core their radiation passes through the NLR and a high RM results. The component progresses along the jet and the RM varies as the line of sight traverses an inhomogeneous NLR Faraday screen. Eventually RMs below 100 rad m-2 should be observed, which are comparable to RMs produced by traversing the ISM of the galaxy, as the NLR is exited. With this picture the jet of 3C 273 may still probe the NLR as the RM in the jet of this quasar in the 8-15 GHz mosaic is approximately 5 times that observed in radio galaxy hosts (Feretti et al., 1999). We intend to monitor the cores of quasars for time variations in the RM created as new components are ejected and sample these regions.
A crude estimate of the magnetic field strengths in these quasars can be made by using the variance in the observed RMs (Felten, 1996). This attributes the observed RMs to a randomly ordered magnetic field embedded in cells of uniform size and field strength. From our high resolution RM images we estimate a cell size () of 1 pc. We estimate in these maps as 1160 for 3C 273 and 255 for 3C 279. With an electron density , a volume filling factor and a path length through the NLR of 100 pc the field can be estimated using
| (1) |
This results in a field of 0.3 mG in 3C 273 and 0.05 mG for 3C 279. This is less than that estimated by assuming the magnetic and thermal pressures to be in equilibrium for the same physical conditions (Udomprasert et al., 1997). This estimate is also less than that estimated for the accretion disks of other AGNs obtained by equating magnetic to thermal pressures (Jones et al., 2000). Direct field measurements for other galaxies may be useful in setting a scale of reasonable field values to use in interpreting these quasar RM results. Zeeman splitting measurements in the Seyfert galaxy NGC 4258 provide an upper limit on the field within 0.2 pc of the central engine of this AGN of 300 mG (Herrnstein et al., 1998). In the more benign region of the center of our own galaxy Zeeman measurements yield fields varying from 0.5 mG in Sgr B2 ( 120 pc from the galactic center) (Crutcher et al., 1996) to 4 mG within 2.5 pc from Sgr (Plante et al., 1995). It seems reasonable that the field strengths within the NLR of a powerful quasar should be at least as strong as that in the center of our own galaxy, so the variance method of Felten may provide a lower limit on the field present in the NLR of these quasars.
5 Conclusions
Both 3C 273 and 3C 279 exhibit RM variations on spatial scales of a few parsecs and 1-3 year temporal scales. The low resolution RM structure of 3C 273 is resolved into sub-components whose general structure is visible at low resolution. Good agreement to a law is found outside of the core of this quasar. We estimate a field of 0.3 mG for 3C 273 and 0.05 mG for 3C 279 if the RMs result from a tangled field in 1 pc cells. Component C4 of 3C 279 is shown to have a varying absolute EVPA and thus is not suitable as a stand-alone EVPA calibrator. We find that the VLA Monitoring Program database provides a method of absolute EVPA calibration for VLBA observations (Taylor & Myers, 2000). The RM slope change from negative to positive in the new component of 3C 279 emerging from the core may also indicate that a new positive RM feature in the NLR is being sampled, and its progress will be examined in future VLBA observations.
References
- Cawthorne et al. (1993) Cawthorne, T. V., Wardle, J. F. C., Roberts, D. H., Gabuzda, D. C., & Brown, L. F. 1993, ApJ, 416, 496
- Crutcher et al. (1996) Crutcher, R. M., Roberts, D. A., Mehringer, D. M., & Troland, T. H. 1996, ApJ, 462, 79
- Denn et al. (2000) Denn, G. R., Mutel, R. L., & Marscher, A. P. 2000, ApJS, 129, 61
- Felten (1996) Felten, J. E. 1996 in ASP Conf. Ser. 88, Clusters, Lensing, and the Future of the Universe, ed. V. Trimble & A. Reisenegger (San Francisco: ASP), 272
- Feretti et al. (1999) Feretti, L., Perley, R., Giovannini, G. & Andernach, H. 1999, A&A, 341, 29
- Herrnstein et al. (1998) Herrnstein, J. R., Moran, J. M., Greenhill, L. J., Blackman, E. G. & Diamond, P. J. 1998, ApJ, 508, 243
- Jones et al. (2000) Jones, D. L., Wehrle, A. E., Meier, D. L. & Piner, B. G. 2000, ApJ, 534, 165
- Leppnen et al. (1995) Leppnen, K. J., Zensus, J. A., & Diamond, P. J. 1995, AJ, 110, 2479
- Lister et al. (1998) Lister, M. L., Marscher, A. P., & Gear, W. K. 1998, ApJ, 504, 702
- Plante et al. (1995) Simard-Normandin, M., Kronberg, P. P., & Button, S. 1981, ApJS, 45, 97
- Simard-Normandin et al. (1981) Plante, R. L., Lo, K. Y., & Crutcher, R. M. 1995, ApJ, 445, 113
- Taylor (1998) Taylor, G. B. 1998, ApJ, 506, 637
- Taylor (2000) Taylor, G. B. 2000, ApJ, 533, 95
- Taylor & Myers (2000) Taylor, G. B. & Myers, S. T. 2000 VLBA Scientific Memo 26, National Radio Astronomy Observatory
- Udomprasert et al. (1997) Udomprasert, P. S., Taylor, G. B., Pearson, T. J., & Roberts, D. H. 1997, ApJ, 483, L9
- Wardle et al. (1998) Wardle, J. F. C., Homan, D. C., Ojha, R. & Roberts, D. H. 1998, Nature, 395, 457
TABLE 1
Polarization Angle Calibration
| Source | |||||||
|---|---|---|---|---|---|---|---|
| (1) | (2) | (3) | (4) | (5) | (6) | (7) | (8) |
| OJ287 | 8.5 | 2.6 | 148 | 52.5 | 2.5 | 140 | 26 |
| 22 | 2.5 | 100 | -53 | 1.9 | 81 | 61 | |
| 43 | 2.1 | 89 | 37 | 1.1 | 8 | 88 | |
| J1310+3220 | 8.5 | 1.7 | 56 | 20 | 1.8 | 52 | 58 |
| 22 | 1.2 | 59 | 27.7 | 1.0 | 56 | 26 | |
| 43 | 1.0 | 52 | 29 | 1.1 | 36 | 14 |
Notes to Table 1
Col.(1).—Source name. Col.(2).—Observing band in GHz. Col.(3).—Integrated VLA flux density in Jy. Col.(4).—Integrated VLA polarized flux density in mJy. Col.(5).—VLA polarization angle (E-vector) in degrees. Col.(6).—Integrated VLBA flux density in Jy. Col.(7).—Integrated VLBA polarized flux density in mJy. Col.(8).—VLBA polarization angle (E-vector) in degrees.