HST Observations of SGR 052666: New Constraints on Accretion and Magnetar Models
Abstract
Soft -ray Repeaters (SGRs) are among the most enigmatic sources known today. Exhibiting huge X- and -ray bursts and flares, as well as soft quiescent X-ray emission, their energy source remains a mystery. Just as mysterious are the Anomalous X-ray pulsars (AXPs), which share many of the same characteristics. Thanks to recent Chandra observations, SGR 052666, the first SGR, now appears to be a transition object bridging the two classes, and therefore observations of it have implications for both SGRs and AXPs. The two most popular current models for their persistent emission are accretion of a fossil disk or decay of an enormous ( G) magnetic field in a magnetar. We show how deep optical observations of SGR 052666, the only SGR with small enough optical extinction for meaningful observations, show no evidence of an optical counterpart. These observation place strong new constraints on both accretion disk and magnetar models, and suggest that the spectral energy distribution may peak in the hard-UV. Almost all accretion disks are excluded by the optical data, and a magnetar would require a – G field.
1 Introduction
Soft -ray Repeaters (SGRs; for a recent observational review, see Hurley 2000) were initially discovered by their intense and repeated emission of soft ( keV) -rays. These bursts are significantly super-Eddington (; Hurley 2000), but are dwarfed by the giant flares. The flares are thousands of times more energetic than typical bursts and have harder spectra ( MeV), but are rare, with only two observed in the past 20 years.
SGRs also emit quiescently in X-rays. This emission exhibits a power-law spectrum with photon index , and may also have small blackbody contributions with keV. SGRs pulsate both in quiescence and during bursts with periods (5–8 s) that are longer than those typical for radio pulsars, and relatively large spin-down rates as well (; Kouveliotou et al. 1998; Hurley 2000).
Based on energetics and proximity to supernova remnants (SNRs) or star-formation regions, SGRs are generally thought to be young ( yr) neutron stars. Given this, the most widely accepted model for SGRs has been the magnetar model (Thompson & Duncan 1993). Magnetars, neutron stars with G, are objects whose primary power source is magnetic field decay rather than spin-down (radio pulsars) or accretion (X-ray binaries). The high magnetic fields were invoked to explain the very long super-Eddington tail of the 5 March 1979 outburst (Paczyński 1992) and its spin period (Duncan & Thompson 1992). In the magnetar model, SGRs produce bursts and flares through violent recombination and unpinning of the magnetic field, driven by crust fractures (Thompson & Duncan 1995). Non-thermal quiescent emission is thought to be due to currents in their magnetospheres arising from the continuing competition between crust and magnetic stresses (Thompson & Duncan 1996; Thompson 2000).
The Anomalous X-ray Pulsars (AXPs; see Mereghetti 2000 for a review) are a group of objects that appear similar to the SGRs. However, they have softer spectra ( and more prominent blackbody components) and have not been observed to burst. Thompson & Duncan (1996) proposed that both classes had similar origins, based on similar spin properties and X-ray luminosities.
While intriguing, magnetars are not the only possible models for AXPs. Propeller driven spindown of accreted/ejected matter from a fallback disk (van Paradijs, Taam, & van den Heuvel 1995; Chatterjee, Hernquist, & Narayan 2000) produced during the supernova explosion, a “pushback” disk (enhanced fallback from an overly dense environment; see Marsden et al. 2001, 2000), or a disk acquired by a high velocity neutron star that has caught up with its ejecta Marsden et al. (2001), was postulated to explain the emission and period clustering of the AXPs. With a standard -G magnetic field, an accreting pulsar would naturally reach an equilibrium spin period of s, and the observed variations in spin-down (Kaspi et al. 2000; Kaspi, Lackey, & Chakrabarty 2000) could be explained by accretion torques.
Accretion would provide a large and easily accessible reservoir of energy for the AXPs. This is in contrast to magnetars, which can only emit (for a -G field) over their lifetimes. Given the attractiveness of the accretion model on energetics ground, it has also been proposed that SGRs are powered by the same mechanism (Marsden et al. 2001). In the propeller spin-down model, the bursts are expected to result from starquakes produced (e.g. Ramaty et al. 1980, 1981; Ellison & Kazanas 1983), by fractures and phase transitions in subducted crust piled up by the extreme plate tectonics (Ruderman 1991) driven by the very rapid spindown of the neutron star. The damping times of neutron star vibrational modes in such a quake model can possibly explain (Ramaty et al. 1981) both the duration of the 5 March 1979 outburst and its very long super-Eddington tail.
The discovery of the soft power-law spectrum () of one SGR, SGR 052666 by Kulkarni et al. (2001, hereafter K00) suggests AXPs and SGRs may be linked through spectral as well as spin properties, and that SGR 052666 may be a transition object bridging the two classes.
With its high Galactic latitude, SGR 052666 has a comparatively low extinction, allowing much deeper optical observations than those of the other SGRs, despite its greater distance. The other SGRs have extinctions of 10–30 magnitudes in the optical band ( for SGR 190014 based on Hurley et al. 1999c; mag for SGR 180620; van Kerkwijk et al. 1995). Therefore, this object provides an important test for models of the quiescent optical emission from SGRs.
2 SGR 052666
On 5 March 1979, spacecraft recorded a giant -ray flare (Mazets et al. 1979; Cline et al. 1980) that is currently second in brightness, behind only the 28 August 1998 flare of SGR 190014 (Hurley et al. 1999a). The burst showed a very short rise ( ms) followed by a -ms decay and a pulsating phase (lasting min; Cline et al. 1980). While overall the spectrum is rather soft, the initial flare had a hard tail, perhaps associated with the initial outburst rather than its afterglow (Mazets et al. 1979). There were also indications of a 430-keV emission line, probably the 511-keV annihilation line redshifted by gravity from the surface of a neutron star (Mazets et al. 1979). Barat et al. (1979) and Mazets et al. (1979) identified an 8-s periodicity in the burst data.
Triangulation located the source in the Large Magellanic Cloud (LMC), specifically in the direction of SNR 052566.1 (catalog ) (N49; Evans et al. 1980). Assuming the association to hold, the inferred isotropic luminosity of the source was calculated to be , with a total energy output of (for X-rays keV; Mazets et al. 1979; Hurley 2000).
On 6 March 1979 a second burst lasting s was observed at the same position, with a similarly soft spectrum, although its intensity was a factor of 100 below that of 5 March 1979. Bursts of lower intensity were subsequently observed (Rothschild & Lingenfelter 1984), although none after . The later bursts showed a clustering which was interpreted (Rothschild & Lingenfelter 1984) as a periastron passage in a highly eccentric 164 day orbit, which was later also indicated in the observation of and optical flash from SGR 052666 (Pedersen et al. 1984). However, later analysis of the clustering of bursts from SGR 190014 which has also emitted a giant flare) and SGR 180620 has pointed towards a lognormal distribution of time intervals, similar to that of earthquakes (Cheng et al. 1996; Göğüş et al. 1999; Göğüş et al. 2000). This distribution suggests that the bursts result from internal rather than external triggers.
Later, X-ray observations identified a point source, RX J052600.3660433 (catalog ), coincident with the -ray error box (Rothschild, Kulkarni, & Lingenfelter 1994; Marsden, Rothschild, Lingenfelter, & Puetter 1996). The luminosity of the quiescent source is (0.1–2.4 keV; Marsden et al. 1996; K00), and while no periodicity was found in the ROSAT data, the limit on the pulsed fraction of 66% (Marsden et al. 1996) was not very stringent. Recent Chandra X-ray Observatory (CXO) observations of RX J052600.3660433 (catalog ) have shown that the source is indeed pointlike and has a drastically different spectrum (nonthermal with photon index of ) than the rest of the supernova remnant, leaving little doubt that RX J052600.3660433 (catalog ) is the quiescent counterpart of SGR 052666 (K00).
2.1 Distance and Reddening to SGR 052666
To find the extinction , Marsden et al. (1996) use a relation between the hydrogen column density (; K00) and the extinction. Most of the intervening hydrogen and extinction are local to the LMC (, as inferred from Burstein & Heiles 1982), so we therefore use the relation appropriate to the LMC: (Weingartner & Draine 2000) and find mag. We then use the standard Galactic reddening curve (which should also apply to the LMC longward of 200 nm; Nandy et al. 1980; Zaritsky 1999) from Schild (1977) normalized to . From this we find the reddening mag, generally consistent with that found by Vancura et al. (1992) from studies of line ratios in N49 (although there is significant variation over the remnant, with ranging from 0.0 mag to 0.5 mag). We note that the values for the extinction are somewhat imprecise and may have significant variations on scales as small as (Vancura et al. 1992), but this does not significantly affect our analysis. The extinction values that we used are listed in Table 1, and are at the upper end of the range possible for SGR 052666.
We parameterize the distance to the LMC/SGR 052666 as kpc.
3 Observations
The data consist of Hubble Space Telescope (HST) WFPC2 observations with several filters of the field centered around the supernova remnant N49 in the LMC. See Table 1 for a log of the observations. The HST WFPC2 filter designations describe the center wavelengths and widths. F300W, for example, is a wide bandwidth filter centered at 300 nm, while F547M is a medium bandwidth filter centered at 547 nm.
3.1 Image Reduction
The data from 14 November 1998 and 27 April 1999 were taken with HST in different orientations, so they were processed separately, although with the same procedure.
We used the drizzling111Drizzling is a technique to combine HST images from slightly different positions and orientations into a single image. The HST PC has pixels, and the nominal resolution is , indicating that it undersamples the point-spread function (PSF). By dithering to positions with fractional-pixel offsets, we are able to retrieve some of the lost information, eventually increasing the nominal resolution by a factor of , while preserving photometric integrity. procedure to reduce the images and remove cosmic rays (Fruchter & Mutchler 1998), employing the standard methodology and parameter values. We combined the resulting images into a master pixel image, oversampling the Planetary Camera (PC) pixels by a factor of two (changing the pixel scale from to ). We also applied geometric distortion corrections appropriate for each wavelength, so that the relative astrometry between detectors or in a given detector should be accurate. Typical stellar sources had a FWHM of , as expected from the telescope PSF.
3.2 Astrometry
We used the USNO-A2.0 catalog (Monet 1998) as our astrometric reference, fitting to the F547M images (which presented the best combination of signal to noise ratio and nebular rejection). While no USNO-A2.0 stars were visible on the PC image, we had many on the Wide Field (WF) images. Using twenty-four USNO-A2.0 stars, we computed a solution for a mosaiced image of all the WFPC2 detectors assembled with the task wmosaic. The wmosaic task corrects for geometric distortions and relative offsets between the different detectors, so using the mosaiced image to solve for stars on an individual detector should not have introduced significant errors. The solution has rms residuals in each coordinate (comparable to the accuracy of the USNO-A2.0 positions; Monet 1998). We then identified fourteen fainter stars on the PC portion of the mosaiced image, determined their positions from the mosaic plate solution, and found the solution for the drizzled images ( residuals for each coordinate), which we transferred to the other bands. The position for RX J052600.3660433 (catalog ) [determined by K00 to be , ] was located on the drizzled images, yielding the position in Figure 1. The final intrinsic astrometric uncertainties are , and the CXO systematic uncertainties are (based on other data, we believe to be a conservative estimate for CXO; E. Schegel 2000, private communication). This gives for the overall 1 uncertainty in each coordinate. From this we find the 90% confidence radius to be .
3.3 Photometry
The position of RX J052600.3660433 (catalog ), as measured with CXO by K00, is on the PC detector, so we are only concerned with these data.
Once we had drizzled images for each filter, we performed aperture photometry on each object on the PC using the SExtractor photometry package (Bertin & Arnouts 1996). Using the F547M image as the reference, we measured the positions of stars on the PC. We then used this master list of sources to do photometry for all of the filters. Because of the large amount of nebulosity in the images, it is difficult to determine the background level accurately. We computed a background by gridding the image into pixel bins (), and then producing an average (after rejecting high pixels) for each one. We subtracted this smooth background, resulting in an image that does not contain most of the variations due to nebulosity. Next, a fitted elliptical profile was analyzed for each source. The magnitude was determined by fitting this profile out to a radius of (for stars) and integrating. We then applied two types of aperture-corrected magnitude estimates with SExtractor (“adaptive aperture” and “corrected isophotal” magnitudes) to compute the true magnitude.
Zero-point magnitudes in the STMAG system222All magnitudes are in the STMAG system, where , with in . were calculated according to the WFPC2 manual333http://www.stsci.edu/instruments/wfpc2/Wfpc2_phot/wfpc2_cookbook.html, where the calibration parameters PHOTFLAM and PHOTZPT are taken from the image headers. The values we calculated are listed in Table 1. To convert the magnitudes to fluxes, we scale our count rates by the PHOTFLAM parameter, which is the flux of a source that produces .
To determine limiting magnitudes, we empirically determined the point-spread functions (PSFs) of the different images for stars. We then used this PSF to add 50 simulated stars to the central part of the images. These stars were distributed in magnitude such that some were above and some below the detection limit. We performed photometry on these simulated stars, and define the limiting (3) magnitude to be where the measured magnitudes of the stars have errors mag, indicating that stars can no longer be accurately measured. These values have an intrinsic uncertainty of mag, and are reported in Table 1. We note that these values represent completeness limits for the region around SGR 052666 — individual stars can still be detected with fainter magnitudes, but no source was missed to the limits presented here.
4 Analysis
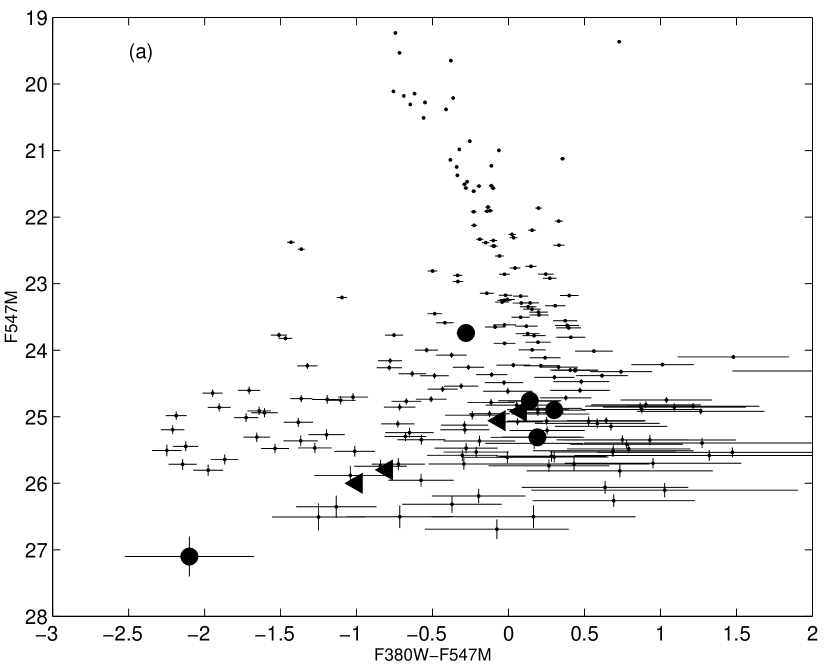
Our primary goal for these observations was to detect a counterpart to SGR 052666 or a cooling synchrotron nebula left by previous bursts (cf. the radio nebula from Frail, Kulkarni, & Bloom 1999) and confined by the hot gas in the interior of N49. We therefore examined all of the sources within the error circle that were not obviously part of the SNR. The images are shown in Figure 1. We present photometric data concerning the sources in the error circle in Table 2.
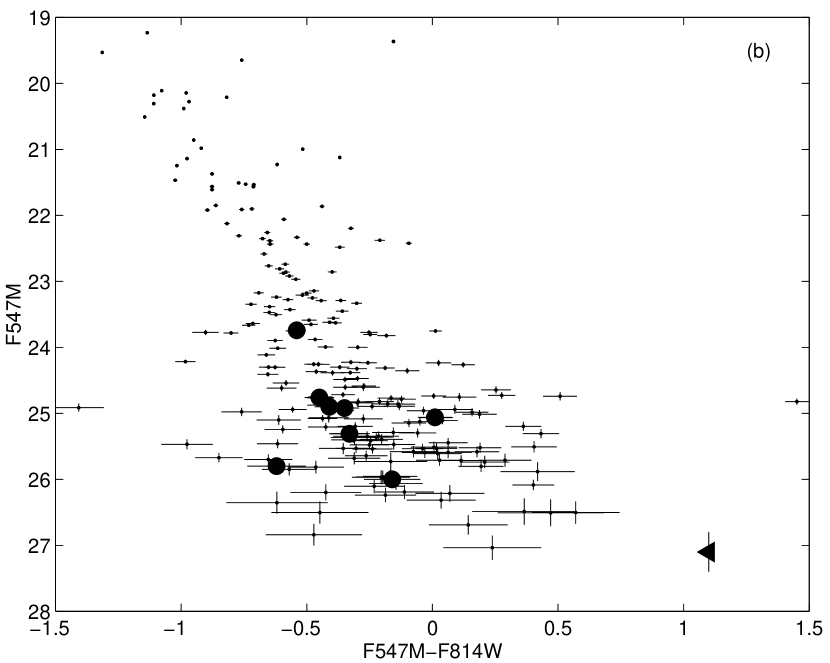
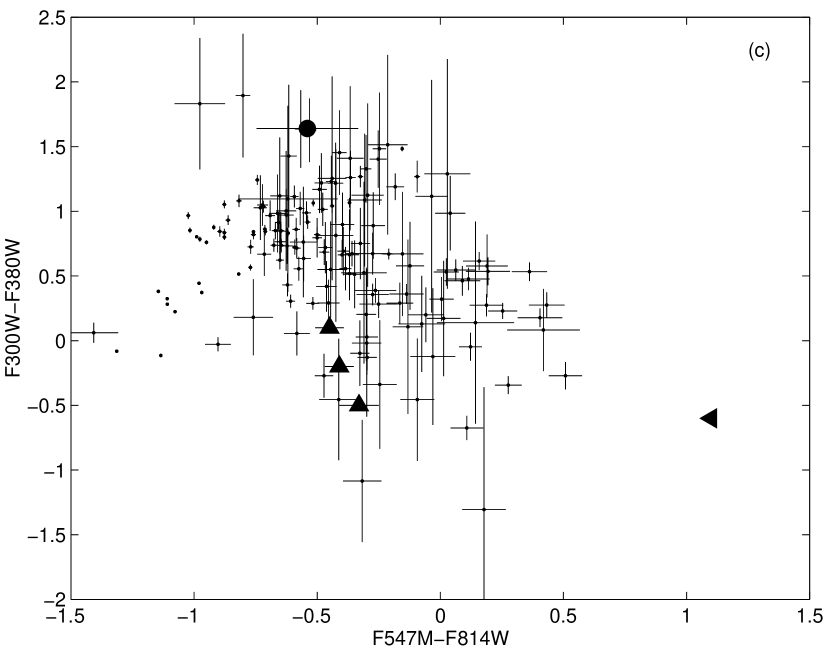
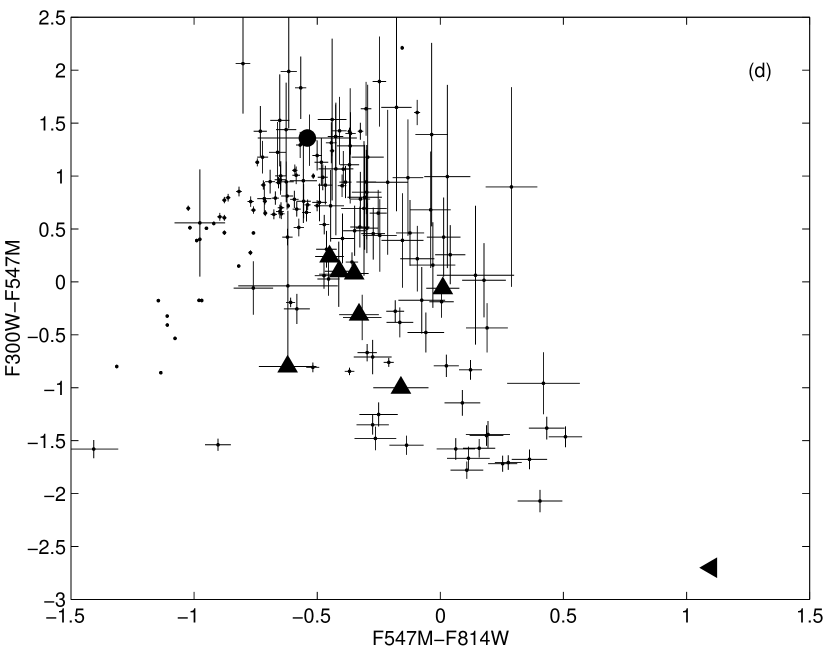
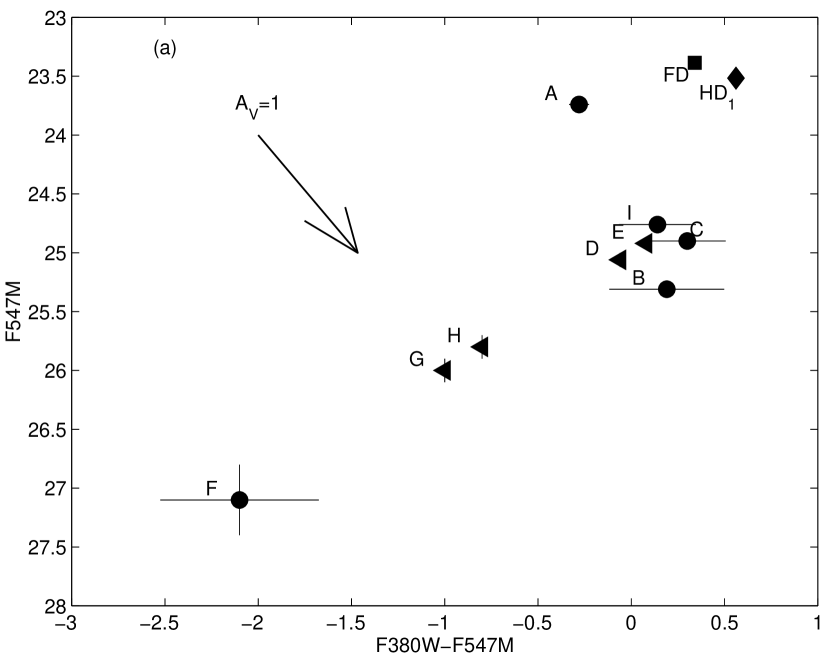
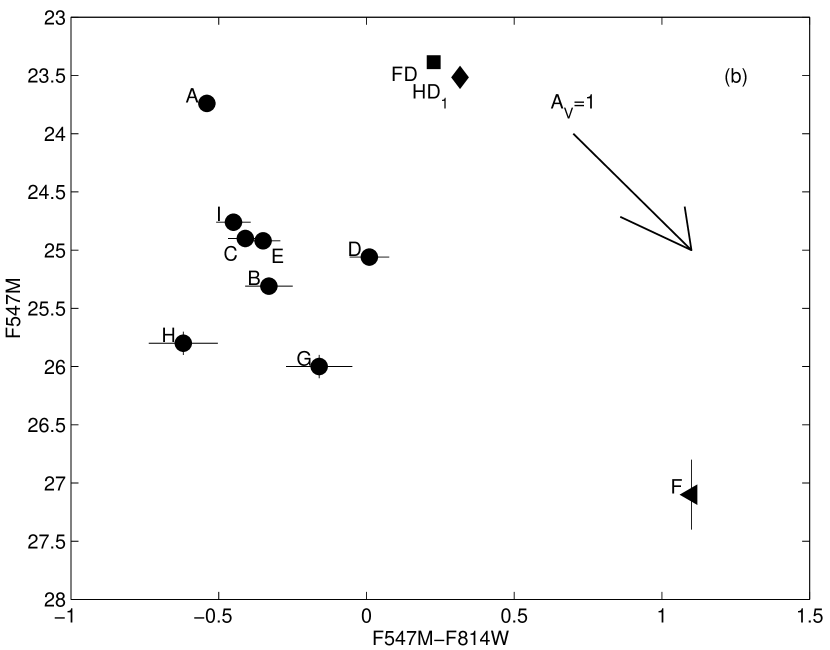
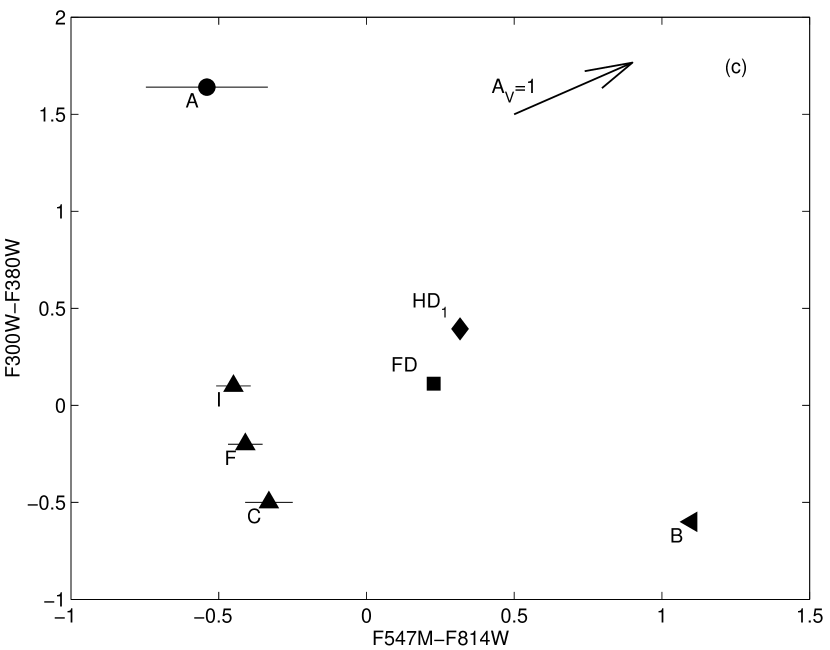
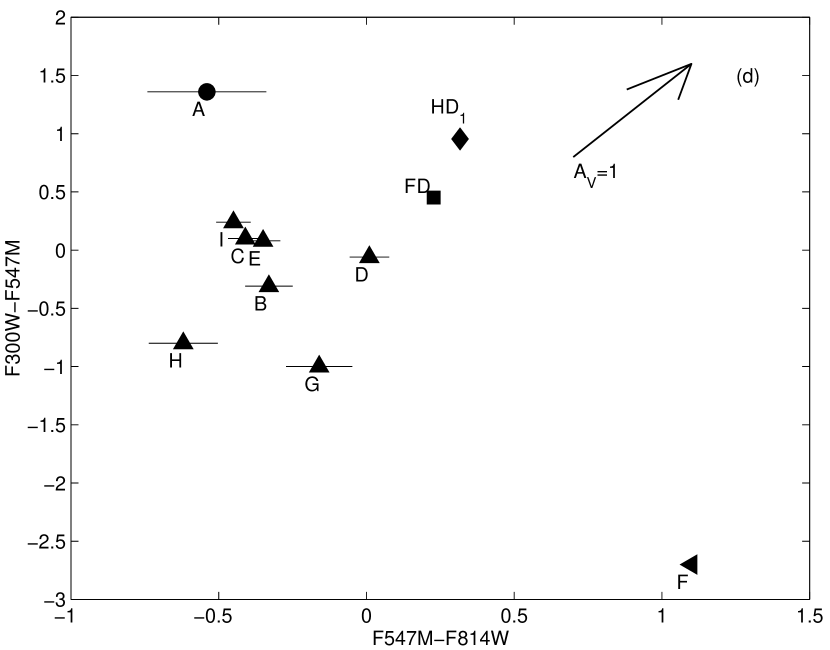
We compared the colors of these sources to those of the other sources detectable on the PC image. All but one of the nine candidate sources lie in the color-magnitude diagram formed by the field sources, as seen in Figure 2.
Seven (possibly eight) of the sources from Table 2 are generally consistent with main sequence G/K stars at the distance of the LMC, with reddening similar to that used here (). Of the two that are not (F and possibly E), both have nebulosity leading to other parts of the SNR. We now examine these sources in detail. For source E we find , , and . This may be consistent with a GV star (given reddening uncertainties), but the source has some surrounding nebulosity trailing to the South and West, in the direction of other filaments. We therefore believe that this is part of the SNR. For source F, we find , , and , and a slightly extended morphology. This is not consistent with a main-sequence star. However, the source is extended towards the South thereby making the photometry suspect, and the source merges into the SNR nebulosity. In the F814W image F appears almost to have a bow-shock morphology, but this morphology changes so much in the other images that we believe it to be coincidence. We therefore conclude that F, like E, is part of the SNR. Narrowband imaging of the field could easily settle this matter, as source F would primarily emit in emission lines if it is part of the SNR.
5 Discussion
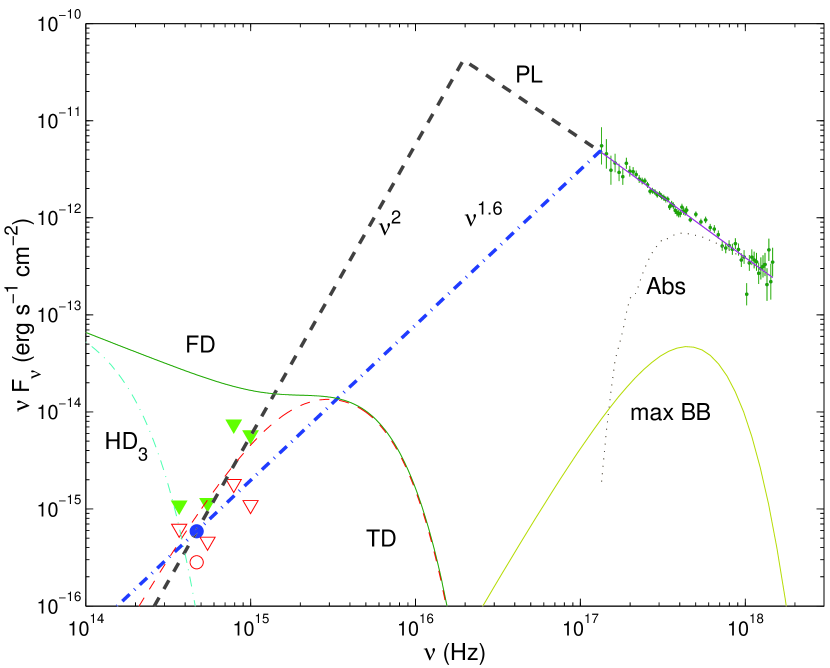
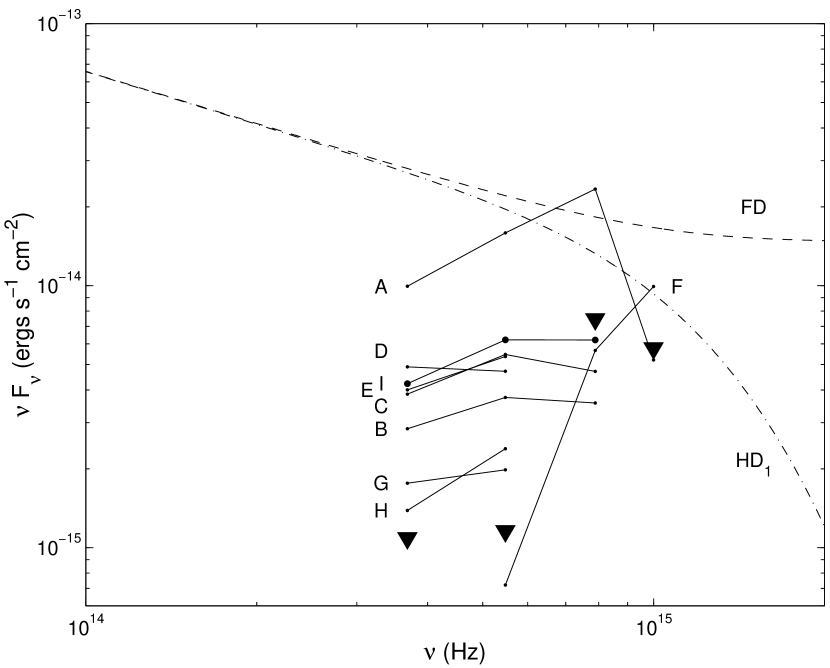
Using the optical data from this paper and the X-ray data from K00 we can plot the spectral energy distribution (SED) of SGR 052666. We find that any optical detections or upper limits severely constrain the spectrum below 0.5 keV (see Figure 3). The optical data given here demonstrate that the spectrum cannot continue to climb when going to lower frequencies, as it does in the X-rays ( from 6.0 keV down to 0.5 keV; K00). It must therefore peak between the near UV and the hard UV/soft X-ray bands. The location of the peak depends on the form of the spectrum below the peak. Below we discuss several possibilities for the nature of SGR 052666, along with consequences for its optical emission.
5.1 An Isolated NS Accreting from a Disk
We modeled the emission from a fossil disk (Chatterjee et al. 2000; Marsden et al. 2001) surrounding a neutron star based on the work of Perna, Hernquist, & Narayan (2000) and Perna & Hernquist (2000). Our model accounts for both viscous dissipation (Shakura & Sunyaev 1973) and re-radiation of X-rays emitted by the central source (Vrtilek et al. 1990), and solves for the disk structure in a self-consistent manner. This is similar to the models used by Hulleman et al. (2000) and Hulleman, van Kerkwijk, & Kulkarni (2000), and is reasonably general. The major assumption is that the disks radiate like superpositions of many blackbodies. One might think that beaming could influence the results, but Perna & Hernquist (2000) found that beaming from a relativistic central object did little to change the observed spectrum.
The basic disk model (BD), plotted in Figures 3, 4, and 5, assumes (0.5–10 keV; K00), which agrees with the ROSAT determination (calculated using W3PIMMS444http://heasarc.gsfc.nasa.gov/Tools/w3pimms.html assuming and ). The inner radius is the corrotation radius cm (, s), and the outer radius is cm (Perna & Hernquist 2000). We do not determine a value for the outer radius independently, but the results are insensitive to it as long as cm. We also consider an alternate model proposed by Perna & Hernquist (2000), where , which we designate HD1 (hollow disk); here is the magnetetospheric radius defined as the Alvén radius , and G is the magnetic field. As Figures 4 and 5 show, these models are very likely excluded for the sources in the error circle. The disk models are both significantly brighter ( mag) than the stars and have the wrong colors. This result is not very sensitive to the value of the extinction, as our value is at the high end of reasonable values, and therefore the corrected stellar fluxes in Figure 5 would only decrease upon changing . We therefore do not believe that any of the sources in Table 2 could be an accretion disk. Thus the optical counterpart to SGR 052666 must be fainter than the limits presented here.
In order to accommodate these optical limits for an accretion disk, we must modify either the inclination angle , the outer radius , or the inner radius . For the first two parameters, acceptable values are cm for reasonable values of (, at which point the central X-ray source would be hidden). We label disks with a truncated outer radius TD (truncated disk). The third parameter, , must increase by three orders of magnitude above the nominal value to cm (HD3 model). This limit needs justification — maintaining a disk with such an inner radius would be difficult. We plot these possible but unlikely disks that do satisfy our limits (by changing the parameters listed above) along with the X-ray spectrum in Figure 3.
While making significantly greater than or (in the HD3 model) seems contrived, altering or are much less so. For most values of we need to truncate the disk at a radius of cm to accommodate our limits, similar to Hulleman et al. (2000), which as they note is difficult to produce but not unprecedented. It is not likely that such a truncated disk would be able to provide sufficient material to power the SGR for its lifetime. Even so, we examine the implications of the TD model.
As there have been no timing observations to constrain possible companions to SGR 052666, a companion could exist and provide an outer limit to the disk. The suggested 164 day periodicity (Rothschild & Lingenfelter 1984) in the bursts could be consistent with such a companion, but only if the eccentricity is , which seems unlikely.
We examine the possible masses and radii of such companions in the TD model. We do this by requiring cm, where we determined as the distance from a neutron star to the outermost stable orbit of a disk (assumed to be in the orbital plane) of pressureless particles (Paczynski 1977; Paczynski & Rudak 1980). This then gives a constraint on the companion radius by requiring that it not overflow its Roche lobe (with the Roche lobe radius determined using Eggleton 1983), as this would make the source a Low-Mass X-ray Binary (LMXB) with substantially different properties. For a white dwarf with cm (), for all companion masses and such a source is acceptable. A main-sequence star with , however, would overflow for all . The mass limit is even lower if the effects of irradiation on the companion’s radius (Podsiadlowski 1991) are taken into account. Also, main-sequence stars of type K or earlier (and hotter white dwarfs) are excluded photometrically. We therefore require a faint, compact companion: a planet, brown dwarf or cool white dwarf. However, producing a white dwarf in a very tight orbit around a yr old neutron star may be very difficult.
Thus the lack of an optical counterpart to SGR 052666 places strong new constraints on accretions disk models.
5.2 A Magnetar
There are no clear predictions for the optical appearance of magnetars, and so one of the stars in the error circle (Section 4) may be such a source. However, based on spin (Thompson & Duncan 1996) and spectral (K00) properties, we believe that the SGRs and AXPs share a common origin. If this is the case, we can use optical data concerning AXPs (Hulleman et al. 2000, 2000) along with the stellar appearances of sources A–I to exclude them from consideration as counterparts to SGR 052666. We therefore conclude that SGR 052666 has not been detected. This gives an unabsorbed X-ray to optical flux ratio (where is the integrated X-ray flux and ). This ratio is extremely high — almost all neutron stars have lower ratios (Hulleman et al. 2000). We must account for this in our models for SGR 052666.
A continuation of the possible blackbody emission found in the X-ray spectrum by K00 would be extremely faint in the optical, and could satisfy our limits (see Figure 3). However, given the nonthermal optical emission from radio pulsars as well as the emission from 4U 014261 (catalog ) (Hulleman et al. 2000), we believe that the emission from SGR 052666 would arise from another process.
We neither know nor can predict the details of this process, but we examine the emission heuristically to derive its basic properties. A continuation of the X-ray power-law is impossible. In general, a broken power-law is the simplest parameterization of the spectrum, with both the peak location and index below the peak as yet undetermined. Simple choices for the index would be 2 (thermal emission) or 2.5 (self-absorbed synchrotron emission), although most indices are possible. Hulleman et al. (2000) suggest that the optical emission for 4U 014261 (catalog ) follows a power-law , with . This provides the motivation for the lines drawn on the SED in Figure 3 extending from the optical and meeting the X-ray spectrum in the hard-UV/soft X-ray. The lowest spectral index for a power-law could be 1.6, which is when the spectrum peaks just at the lower limit of the CXO data (0.5 keV; K00), but this seems artificial.
At the other extreme, if the power-law has , this would lead to the overall SED having a peak at nm and a luminosity of , or 10 times that inferred from X-ray observations alone (K00; this also ignores particle and the likely extremely luminous neutrino emission). Such a luminosity requires that we supply even more energy to the source during quiescence, further constraining the energetics and leading to G (as noted by K00), assuming that the source persists for yr (suggested by the estimated age of the supernova remnant and and the spin-down timescales of other SGRs; also see Colpi, Geppert, & Page 2000) and that the magnetic field is the primary energy supplier. This is truly a magnetar-like field! The actual case is most likely between the two curves on Figure 3, with a more gentle peak giving a more relaxed energy requirement, but one that still implies G.
Such large fields may not be consistent with the association of the SGR with N49, which has an age in the range kyr (Vancura et al. 1992; Shull 1983). Calculations for AXPs (Colpi et al. 2000) indicate that a magnetar with an initial dipolar field of G would spin-down to the present day SGR spin period in only 1000 yr, and increasing the field only makes the situation worse. However, for SGR 052666 these calculations are a simplification. The large ( G) magnetic field would likely be tangled and exist close to the surface (K00); this would then still dominate the energetics and produce crust stress but not the spin-down (which also must incorporate winds; Thompson et al. 2000; Harding, Contopoulos, & Kazanas 1999). Alternatively, the SGR 052666/N49 association could be false, as has recently been found for other SGR/SNR associations (Hurley et al. 1999b; Xilouris et al. 1998; Lorimer & Xilouris 2000). K00 found that SGR 052666 and N49 had the same value for , but they see no sign of interaction in X-rays and the projected position of SGR 052666 is near the edge of N49. SGR 052666 could merely be associated with nearby star formation that led to a massive cluster (like those for SGR 190014 and SGR 180620; Fuchs et al. 1999; Vrba et al. 2000; Mirabel, Fuchs, & Chaty 2000), which could have produced the N49 progenitor as well. A non-association could then allow the age of SGR 052666 to come closer to yr, with a consequent reduction of by a factor of . Either way, the energetic requirements of the SGR 052666 SED provide a strong constraint on the magnetar model and formation scenario for this source.
Motivated by the detection of optical emission from an AXP (Hulleman et al. 2000), we examine whether it is likely that we could detect SGR 052666. Using the same X-ray to optical flux ratio as that for 4U 014261 (catalog ) (; Hulleman et al. 2000), we estimate (see Figure 3), beyond current limits but within the range of HST.
6 Conclusions
We have obtained deep HST images of the field containing SGR 052666. There does not appear to be a point-like optical counterpart consistent with either the colors or magnitudes of the disks described by Chatterjee et al. (2000). Assuming a non-detection, optical limits place strong new constraints on both accretion disks and magnetars as the source of the X-ray luminosity and spindown. Independent of the source’s nature, however, if SGRs and AXPs are related, we might expect for SGR 052666, based on the optical to X-ray flux ratio of the one identified AXP.
References
- Barat et al. (1979) Barat, C., Chambon, G., Hurley, K., Niel, M., Vedrenne, G., Estulin, I. V., Kurt, V. G., & Zenchenko, V. M. 1979, A&A, 79, L24
- Bertin & Arnouts (1996) Bertin, E. & Arnouts, S. 1996, A&AS, 117, 393
- Burstein & Heiles (1982) Burstein, D. & Heiles, C. 1982, AJ, 87, 1165
- Chatterjee et al. (2000) Chatterjee, P., Hernquist, L., & Narayan, R. 2000, ApJ, 534, 373
- Cheng et al. (1996) Cheng, B., Epstein, R. I., Guyer, R. A., & Young, C. 1996, Nature, 382, 518
- Cline et al. (1980) Cline, T. L., Desai, U. D., Pizzichini, G., Teegarden, B. J., Evans, W. D., Klebesadel, R. W., Laros, J. G., Hurley, K., Niel, M., & Vedrenne, G. 1980, ApJ, 237, L1
- Colpi et al. (2000) Colpi, M., Geppert, U., & Page, D. 2000, ApJ, 529, L29
- Duncan & Thompson (1992) Duncan, R. C. & Thompson, C. 1992, ApJ, 392, L9
- Eggleton (1983) Eggleton, P. P. 1983, ApJ, 268, 368
- Ellison & Kazanas (1983) Ellison, D. C. & Kazanas, D. 1983, A&A, 128, 102
- Evans et al. (1980) Evans, W. D., Klebesadel, R. W., Laros, J. G., Cline, T. L., Desai, U. D., Teegarden, B. J., Pizzichini, G., Hurley, K., Niel, M., & Vedrenne, G. 1980, ApJ, 237, L7
- Frail et al. (1999) Frail, D. A., Kulkarni, S. R., & Bloom, J. S. 1999, Nature, 398, 127
- Fruchter & Mutchler (1998) Fruchter, A. & Mutchler, M. 1998, Space Telescope Science Institute Memo, 28 July
- Fuchs et al. (1999) Fuchs, Y., Mirabel, F., Chaty, S., Claret, A., Cesarsky, C. J., & Cesarsky, D. A. 1999, A&A, 350, 891
- Göğüş et al. (1999) Göğüş , E., Woods, P. M., Kouveliotou, C., van Paradijs, J., Briggs, M. S., Duncan, R. C., & Thompson, C. 1999, ApJ, 526, L93
- Göğüş et al. (2000) Göğüş, E., Woods, P. M., Kouveliotou, C., van Paradijs, J., Briggs, M. S., Duncan, R. C., & Thompson, C. 2000, ApJ, 532, L121
- Harding et al. (1999) Harding, A. K., Contopoulos, I., & Kazanas, D. 1999, ApJ, 525, L125
- Hulleman et al. (2000) Hulleman, F., van Kerkwijk, M. H., & Kulkarni, S. R. 2000, Nature, 408, 689
- Hulleman et al. (2000) Hulleman, F., van Kerkwijk, M. H., Verbunt, F. W. M., & Kulkarni, S. R. 2000, A&A, 358, 605
- Hurley (2000) Hurley, K. 2000, in Gamma-Ray Bursts: 5th Huntsville Symposium, ed. R. M. Kippen, R. S. Mallozi, & G. J. Fishman, 763, astro-ph/9912061
- Hurley et al. (1999a) Hurley, K., Cline, T., Mazets, E., Barthelmy, S., Butterworth, P., Marshall, F., Palmer, D., Aptekar, R., Golenetskii, S., Il’Inskii, V., Frederiks, D., McTiernan, J., Gold, R., & Trombka, J. 1999a, Nature, 397, 41
- Hurley et al. (1999b) Hurley, K., Kouveliotou, C., Cline, T., Mazets, E., Golenetskii, S., Frederiks, D. D., & van Paradijs, J. 1999b, ApJ, 523, L37
- Hurley et al. (1999c) Hurley, K., Li, P., Kouveliotou, C., Murakami, T., Ando, M., Strohmayer, T., van Paradijs, J., Vrba, F., Luginbuhl, C., Yoshida, A., & Smith, I. 1999c, ApJ, 510, L111
- Kaspi et al. (2000) Kaspi, V. M., Gavriil, F. P., Chakrabarty, D., Lackey, J. R., & Muno, M. P. 2000. astro-ph/0011368. submitted to ApJ
- Kaspi et al. (2000) Kaspi, V. M., Lackey, J. R., & Chakrabarty, D. 2000, ApJ, 537, L31
- Kouveliotou et al. (1998) Kouveliotou, C., Dieters, S., Strohmayer, T., van Paradijs, J., Fishman, G. J., Meegan, C. A., Hurley, K., Kommers, J., Smith, I., Frail, D., & Murakami, T. 1998, Nature, 393, 235
- Kulkarni et al. (2001) Kulkarni, S. R., Kaplan, D. L., Marshall, H. L., Frail, D. A., Murakami, T., & Yonetoku, D. 2001, Nature, submitted
- Lorimer & Xilouris (2000) Lorimer, D. R. & Xilouris, K. M. 2000, ApJ, 545, 385
- Marsden et al. (2000) Marsden, D., Lingenfelter, R., Rothschild, R., & Higdon, J. 2000, in Gamma-Ray Bursts: 5th Huntsville Symposium, ed. R. M. Kippen, R. S. Mallozi, & G. J. Fishman, 847, astro-ph/9912315
- Marsden et al. (2001) Marsden, D., Lingenfelter, R., Rothschild, R., & Higdon, J. 2001, ApJ, in press, astro-ph/9912207
- Marsden et al. (1996) Marsden, D., Rothschild, R. E., Lingenfelter, R. E., & Puetter, R. C. 1996, ApJ, 470, 513
- Mazets et al. (1979) Mazets, E. P., Golentskii, S. V., Il’inskii, V. N., Aptekar’, R. L., & Guryan, I. A. 1979, Nature, 282, 587
- Mereghetti (2000) Mereghetti, S. 2000, in The Neutron Star - Black Hole Connection, ed. V. Connaughton, C. Kouveliotou, J. van Paradijs, & J. Ventura (NATO Advanced Study Institute), astro-ph/9911252
- Mirabel et al. (2000) Mirabel, I. F., Fuchs, Y., & Chaty, S. 2000, in Gamma-Ray Bursts: 5th Huntsville Symposium, ed. R. M. Kippen, R. S. Mallozi, & G. J. Fishman, 813
- Monet (1998) Monet, D. E. A. 1998, in The PMM USNO-A2.0 Catalog (U.S. Naval Observatory, Washington DC)
- Nandy et al. (1980) Nandy, K., Morgan, D. H., Willis, A. J., Wilson, R., Gondhalekar, P. M., & Houziaux, L. 1980, Nature, 283, 725
- Paczynski (1977) Paczynski, B. 1977, ApJ, 216, 822
- Paczyński (1992) Paczyński, B. 1992, Acta Astronomica, 42, 145
- Paczynski & Rudak (1980) Paczynski, B. & Rudak, B. 1980, Acta Astronomica, 30, 237
- Pedersen et al. (1984) Pedersen, H., Danziger, J., Hurley, K., Pizzichini, G., Motch, C., Ilovaisky, S., Gradmann, N., Brinkmann, W., Kanbach, G., & Rieger, E. 1984, Nature, 312, 46
- Perna & Hernquist (2000) Perna, R. & Hernquist, L. 2000, ApJ, 544, L57
- Perna et al. (2000) Perna, R., Hernquist, L., & Narayan, R. 2000, ApJ, 541, 344
- Podsiadlowski (1991) Podsiadlowski, P. 1991, Nature, 350, 136
- Ramaty et al. (1980) Ramaty, R., Bonazzola, S., Cline, T. L., Kazanas, D., Meszaros, P., & Lingenfelter, R. E. 1980, Nature, 287, 122
- Ramaty et al. (1981) Ramaty, R., Bussard, R. W., & Lingenfelter, R. E. 1981, Ap&SS, 75, 193
- Rothschild et al. (1994) Rothschild, R. E., Kulkarni, S. R., & Lingenfelter, R. E. 1994, Nature, 368, 432
- Rothschild & Lingenfelter (1984) Rothschild, R. E. & Lingenfelter, R. E. 1984, Nature, 312, 737
- Ruderman (1991) Ruderman, M. 1991, ApJ, 382, 587
- Schild (1977) Schild, R. E. 1977, AJ, 82, 337
- Shakura & Sunyaev (1973) Shakura, N. I. & Sunyaev, R. A. 1973, A&A, 24, 337
- Shull (1983) Shull, P. 1983, ApJ, 275, 611
- Thompson (2000) Thompson, C. 2000, in The Neutron Star-Black Hole Connection, ed. V. Connaughton, C. Kouveliotou, J. van Paradijs, & J. Ventura (NATO Advanced Study Institute), astro-ph/0010016
- Thompson & Duncan (1993) Thompson, C. & Duncan, R. C. 1993, ApJ, 408, 194
- Thompson & Duncan (1995) —. 1995, MNRAS, 275, 255
- Thompson & Duncan (1996) —. 1996, ApJ, 473, 322
- Thompson et al. (2000) Thompson, C., Duncan, R. C., Woods, P. M., Kouveliotou, C., Finger, M. H., & van Paradijs, J. 2000, ApJ, 543, 340
- van Kerkwijk et al. (1995) van Kerkwijk, M. H., Kulkarni, S. R., Matthews, K., & Neugebauer, G. 1995, ApJ, 444, L33
- van Paradijs et al. (1995) van Paradijs, J., Taam, R. E., & van den Heuvel, E. P. J. 1995, A&A, 299, L41
- Vancura et al. (1992) Vancura, O., Blair, W. P., Long, K. S., & Raymond, J. C. 1992, ApJ, 394, 158
- Vrba et al. (2000) Vrba, F. J., Luginbuhl, C. B., Henden, A. A., Guetter, H. H., & Hartmann, D. H. 2000, in Gamma-Ray Bursts: 5th Huntsville Symposium, ed. R. M. Kippen, R. S. Mallozi, & G. J. Fishman, 809
- Vrtilek et al. (1990) Vrtilek, S. D., Raymond, J. C., Garcia, M. R., Verbunt, F., Hasinger, G., & Kurster, M. 1990, A&A, 235, 162
- Weingartner & Draine (2000) Weingartner, J. C. & Draine, B. T. 2000. astro-ph/0008146. submitted to ApJ
- Xilouris et al. (1998) Xilouris, K., Kouveliotou, C., Lorimer, D. R., Ramachandran, R., & van Paradijs, J. 1998, IAU Circ., 7023, 2
- Zaritsky (1999) Zaritsky, D. 1999, AJ, 118, 2824
| Date | Filter | Exposure Sequence | aaSTMAG zero-point. | bbLimiting magnitude and flux density. See Section 3.3. | bbLimiting magnitude and flux density. See Section 3.3. | |
|---|---|---|---|---|---|---|
| (s) | (Jy) | (mag) | ||||
| 1998 Nov 14 | F300W | ccThis is approximate. The actual sequence is . | 29.436 | 25.0 | 0.11 | 1.8 |
| 1998 Nov 14 | F380W | 29.385 | 24.7 | 0.23 | 1.5 | |
| 1998 Nov 14 | F547MddThe F547M filter was chosen to avoid the majority of the nebular line emission from N49 (e.g. [O III] 5007, [O I] 6300, H, H), while still retaining spectral coverage and bandwidth. | 30.695 | 26.6 | 0.084 | 1.0 | |
| 1999 Apr 27 | F814W | 32.009 | 26.7 | 0.17 | 0.6 |
| NameaaSee sources in Figure 1 and Section 4. | Magnitude | |||
|---|---|---|---|---|
| F300W | F380W | F547M | F814W | |
| A | ||||
| B | ||||
| C | ||||
| D | ||||
| E | ||||
| F | bbToo extended for good photometry. | |||
| G | ||||
| H | ||||
| I | ||||