The mysterious H I deficiency of NGC 3175
Australia Telescope Compact Array H I observations reveal the existence of of H I gas in the central 7 kpc of the edge-on spiral galaxy NGC 3175. The detected H I and CO gas can explain why star formation, as traced by other emission processes, is going on in the inner part of its disk. On the other hand, the entire outer disk, beyond 3.5 kpc radius, shows no H I emission, has a very red colour and exhibits neither radio continuum nor H emission. This indicates that the outer part of NGC 3175 is quiescent, i.e. not forming stars at a measurable rate. Its H I deficiency and the small extent of the H I layer, which is confined to the boundaries of the optically visible disk, make NGC 3175 a peculiar spiral galaxy. No intergalactic H I gas in the NGC 3175 group was detected in our interferometric observations. Earlier Parkes telescope single dish H I observations put an upper limit on the amount of diffuse gas that might have been missed by the interferometer at . On DSS plates no galaxy in the NGC 3175 group of galaxies (García 1993) is close enough to it and none exhibits disturbances that could indicate a close interaction which might have led to the stripping of large parts of its H I gas. Thus, despite an extensive multi-wavelength investigation, the reason for the unusual absence of H I and star formation activity in the outer disk of NGC 3175 remains an intriguing mystery.
Key Words.:
Galaxies: evolution – Galaxies: general – Galaxies: individual: NGC 3175 – Galaxies: interactions – Galaxies: ISM – Galaxies: spiral1 Introduction
A large number of “typical” global properties of galaxies of various Hubble types are presented and discussed by Roberts & Haynes (1994; in the following RH94). We will use these as standard reference values, with respect to which we will discuss our results from H I observations of the southern edge-on spiral galaxy NGC 3175. RH94, as well as e.g. Rhee & van Albada (1996), determined that typical spiral galaxies, i.e. galaxies near the “knee” of the galaxy luminosity function, with an absolute magnitude of , normally have H I gas masses on the order of . This usually represents a few percent of their total mass (RH94). The spatial distribution of H I gas is usually more extended than that of the stellar disk (Bosma 1981).
With respect to its global properties the edge-on spiral galaxy NGC 3175 is quite peculiar. Its Hubble type is uncertain; the Third Reference Catalogue of Bright Galaxies (RC3; de Vaucouleurs et al. 1991) classifies it as SAB(s)a?, while it is listed as Sc in the Revised Shapley-Ames Catalog (RSA; Sandage & Tammann 1981). In the Uppsala General Catalog of Galaxies (UGC), Nilson (1973) claims that de Vaucouleurs’ classification (which had been taken over from the RC2) is incorrect and that NGC 3175 is “probably a late-type galaxy”. Because of this confusion, we will compare its global properties with those of galaxies ranging from type Sa to Sc.
Although at a redshift of only 1098 km s-1 (and thus at a distance of only 15.9 Mpc)111We adopt here km s-1 Mpc-1 and a virgocentric infall velocity of 300 km s-1., this galaxy was, until a few years ago, not detected in H I emission (Mathewson et al. 1992). Recently, Mathewson & Ford (1996) and Theureau et al. (1998) found weak H I emission from NGC 3175. Despite this difficulty in tracing its H I gas, it has been readily detected in H (Ryder & Dopita 1993, 1994), radio continuum (Condon et al. 1996) and CO emission (Elfhag et al. 1996), which are tracers of star forming regions. The Infra-Red Astronomical Satellite (IRAS) measured 60 m and 100 m fluxes of 13.1 and 28.2 Jy, respectively. With an flux ratio of 0.46, tracing warm dust, and in the absence of a luminous AGN, this galaxy is obviously forming stars that heat the interstellar medium (ISM) and dust in its disk. The detection of CO emission in the central part of NGC 3175 proves that there is molecular gas from which stars can form. On the other hand, with only barely detectable H I emission, it is not clear where NGC 3715 has its gas reservoir from which to form stars in the future. We investigate this riddle here based on new H I observations conducted with the Australia Telescope Compact Array (ATCA)222The Australia Telescope is funded by the Commonwealth of Australia for operation as a National Facility managed by CSIRO..
2 Observations and data reduction
Our ATCA observations were obtained on 1997, Jan. 27–28, with the 750D configuration over a timerange of 13 hours. The total on-source integration time is 10 h. The ATCA correlator setup used by us provides a velocity resolution of 3.3 km s-1.
1934-638 was used as the primary flux calibrator and 1012-44 as phase calibrator. The measured flux of 1934-638 was 14.94 Jy at 1.42 GHz. The data reduction was performed in the standard fashion, using the software package MIRIAD. In order to achieve maximum sensitivity for extended emission, natural weighting of the visibilities was used. The disadvantage of this procedure, namely the low angular resolution of the images, is secondary for the current study.
With an angular extent of its radio emission of only a few arcmin (see below), NGC 3175 fits easily into the primary beam of the ATCA’s 22 m antennae of . Therefore, no primary beam correction is necessary. With a shortest spacing of 31 m, flux losses due to missing short spacings are negligible.
3 Results
3.1 H I distribution
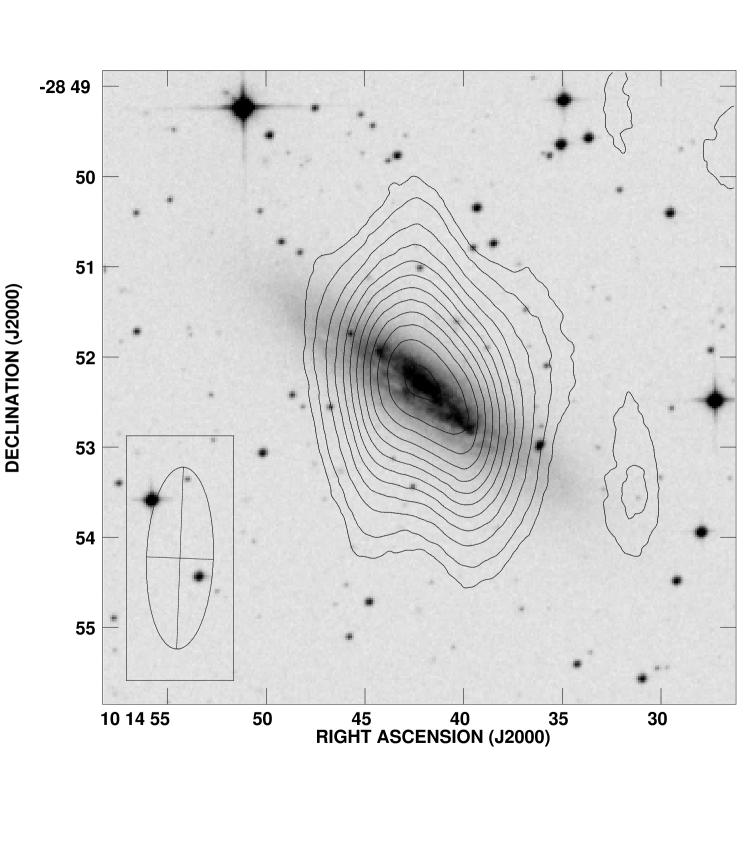
Figure 1 displays our ATCA image of the total H I emission from NGC 3175, superposed as contours on a Digital Sky Survey (DSS) image. The angular resolution (FWHM) of the H I image is , as indicated in the lower left. The emission is marginally resolved along the disk plane of the galaxy in what appears to be a double-peaked distribution.
A cut through the H I emission distribution along the galaxy’s major axis, for which we adopt a position angle of PA (Dahlem et al. 2001), is displayed in Fig. 2. In this figure the data are represented by a solid line.

| Component | H I Emission Linea | 1.49 GHz Continuumb | ||||
|---|---|---|---|---|---|---|
| Radial Offset | Relativec | Radial Offset | Relativec | |||
| ( ′′) | (kpc) | Intensity | ( ′′) | (kpc) | Intensity | |
| NE | ||||||
| Centre | ||||||
| SW | ||||||
Notes to Table 1:
a) Our data.
b) Condon et al. (1996).
c) The intensity of the central peak was normalised to unity.
It became clear very soon during our spatial analysis of the emission distribution that a two-component approximation is not adequate. Thus, a three-gaussian model was computed and graphically displayed. The individual gaussians and the sum of the three are represented by dotted lines. The remaining residual is shown as a bold dashed line. The width of of all three gaussians is identical; it represents the resolution of our data in the direction of the major axis over the width of the cut of . The fact that the three gaussians leave virtually no residuals indicates that most of the H I line emission arises from three maxima, with almost no emission from further out in the disk. The positions of the three gaussian components along the major axis and their relative intensities, normalising that of the strongest peak to unity, are tabulated in Table 1. The zero point of the radial axis is the position of the radio continuum maximum, which we assume to be associated with the galaxy centre. A justification for using a three-gaussian approximation lies in the structure of the 1.49 GHz radio continuum emission distribution, where three emission maxima are visible (Condon et al. 1996). A cut through the 1.49 GHz map (with an angular resolution of ) is displayed in Fig. 3. The corresponding offset and intensity values were measured by us and are also listed in Table 1. A direct comparison of the radial offsets and flux densities shows that, although both emission distributions can be approximated by the same model, neither the positions nor the relative intensities of the peaks coincide. The central H I component is located, within the measuring accuracy, at the position of the central radio continuum peak (and thus the centre of the galaxy). The two outer H I components are located further out along the major axis than the extranuclear radio continuum peaks. Star formation thus takes place within the H I gas layer in the central disk, as might be expected.

The secondary H I emission feature near the southwestern edge of the galaxy disk might be a small companion or a weak remnant of a tidal spur or arm. Its recession velocity of about 1050 km s-1 does not match up with the velocities on that side of the galaxy disk closest to it (see below).
3.2 H I kinematics
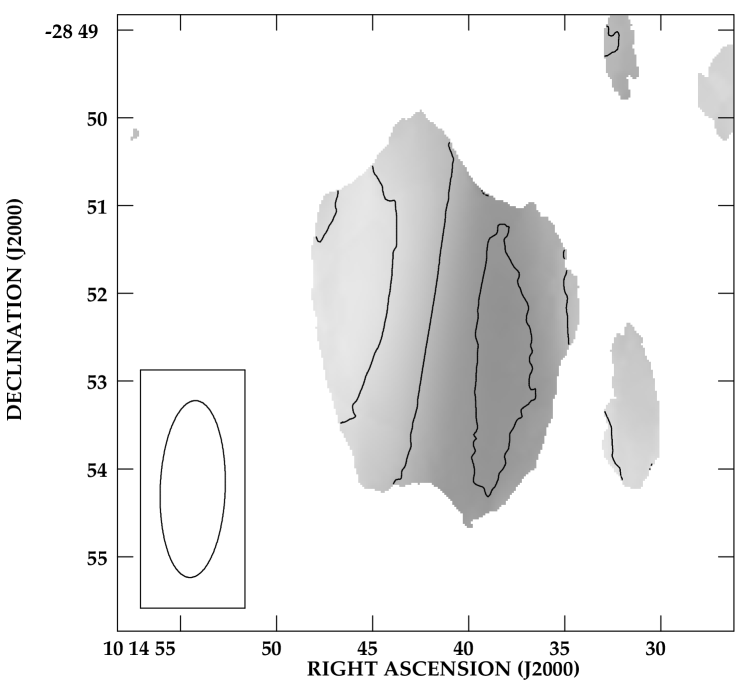
The velocity field (Fig. 4) shows that the lowest velocities are observed in the northeastern part of NGC 3175 and the highest accordingly in the southwestern half.333Based on this knowledge and the convention to define the PA as the angle from North to the receding side of a galaxy, the formally correct value is PA = . The dust lane is located on the south-east side of NGC 3175, tracing its “near side”. This determines the sense of the galaxy’s rotation uniquely. The velocity of the secondary emission blob to the southwest is clearly similar to that of the opposite side of the disk.
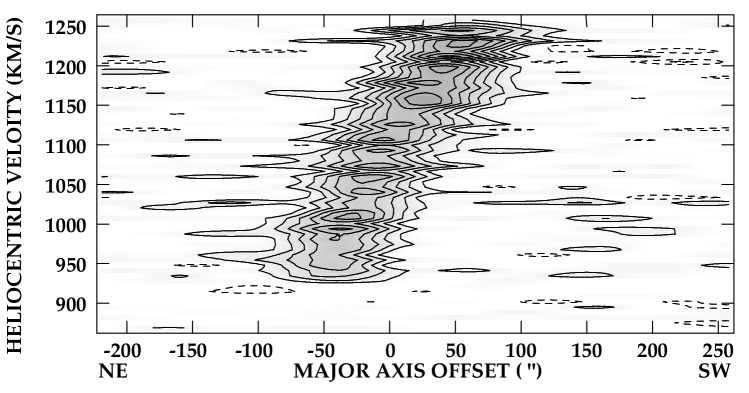
A position-velocity (pv) diagram along the major axis of NGC 3175 (along PA = ) is displayed in Fig. 5. One can discern solid body rotation out to a radius of about from the centre of the galaxy. A comparison with Fig. 3 by Mathewson et al. (1992) reveals that the velocity gradient is not so low because of beam smearing effects, but the same gradient is observed in H, with much higher angular resolution. However, it is unusual for spirals of types earlier than Scd not to have any H I gas beyond the turnover radius in the rotation curve.
The secondary emission blob is not visible here because of its low signal-to-noise ratio. It arises from several marginally positive signals in the channels in the range 1000–1050 km s-1 (at a radial offset of about ).
3.3 Total H I line flux and gas mass
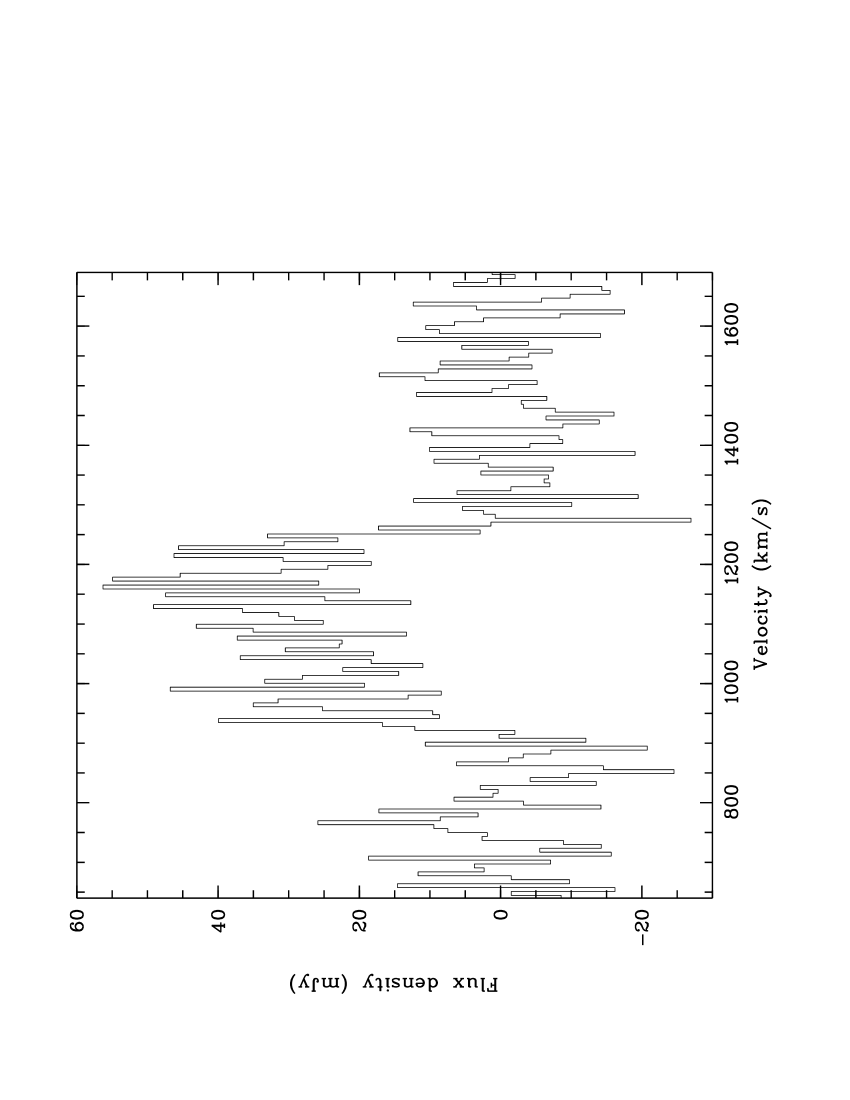
The total H I line spectrum of NGC 3175 is displayed in Fig. 6. The integral H I line spans a velocity range of 350 km s-1, from 920 to 1270 km s-1 (cf. also Fig. 5), with an approximate width at 20% of the peak of = 330 km s-1. From the integral spectrum we derive a heliocentric systemic velocity of km s-1, which is compatible with earlier measurements. The integral line flux from NGC 3175 is 11.0 Jy km s-1, with an estimated uncertainty of about 20%, which is roughly compatible with the non-detection reported earlier, with an upper limit of 8.3 Jy km s-1 (Mathewson et al. 1992). Our H I flux measurement is only slightly lower than the values obtained by Mathewson & Ford (1996) of 14.64 Jy km s-1 and Theureau et al. (1998) of Jy km s-1. One can estimate the amount of flux that might possibly have been missed by our interferometer observations by taking the flux values from our ATCA data and the one from the Parkes data by Mathewson & Ford (1996) at face value. Our measurement reflects the amount of H I gas in the disk of NGC 3175, while the value by Mathewson and Ford might be considered as the possible “full flux”, including low surface brightness or intergalactic H I. One can then argue that if any extended flux had been missed by the interferometer, it would not exceed the difference between both flux measurements, i.e. about one third of the flux displayed in Fig. 1.
The 1.344 GHz continuum flux density of NGC 3175 from our ATCA run of mJy is in very good agreement with the value from the VLA data at 1.425 GHz (Condon et al. 1996) of 71.8 mJy. Thus, the relative calibration between our data and the VLA is good. Because of the weak continuum emission, one can assume that the measured total H I line flux is not measurably influenced by intrinsic self-absorption. Our continuum map is not displayed here, because it does not add anything new to what is already known from the one by Condon et al. (1996).
Using the relation by Roberts (1975) in Eq. 1 and assuming optically thin emission, we can calculate the H I gas mass in NGC 3175 from the integral H I line flux as follows:
| (1) |
where is the distance in units Mpc and is the measured integral H I line flux. = 14.64 Jy km s-1 (from the Parkes data by Mathewson & Ford 1996) then translates into a total H I gas mass of NGC 3175 of , which is quite low for an Sa–Sc type spiral. Other late-type spirals have H I gas masses of order , typically (e.g. Rhee & van Albada 1996).
The H I line flux of = 11.0 Jy km s-1 measured from our data corresponds to an H I gas mass of . This implies that there are, if any, only small amounts ( ) of intergalactic H I gas in the vicinity of NGC 3175 that might have such a low surface brightness as to be missed by the ATCA.
Thus, our present observations prove the presence of small amounts of H I gas in the inner disk of NGC 3175, an area where other tracers of star formation (SF) processes had been detected previously. Elfhag et al. (1996) report the detection of CO emission from the central part of NGC 3175. It appears that the gas from which stars can be formed has finally been detected in emission.
One can use the CO(1–0) line flux derived by Elfhag et al. (1996) of K km s-1 (on the main beam temperature scale) to calculate an estimate of the total molecular gas mass of NGC 3175. This estimate is a lower limit, because only one beam area (FWHM = ; Elfhag et al. 1996) was observed. Assuming that the radial CO emission distribution is similar to that of the radio continuum, as observed in many galaxies (see for example García-Burillo et al. 1992), the CO emission of NGC 3175 should arise from within the central . At the high inclination angle of NGC 3175, the apparent thickness of the disk will probably be only a few arcseconds, thus contained within the SEST beam. Based on the fact that the CO spectrum is peaked near the systemic velocity of NGC 3175 it is also likely that the CO gas distribution is centrally peaked. Therefore, we estimate that the SEST has gathered at least 50% of the total CO(1–0) line flux from this object.
We calculate the molecular gas mass, , following the relation
| (2) |
where K km s-1 is the observed surface brightness of CO line emission, is the CO-to-H2 conversion factor (“X” factor) between H2 column density and observed CO line surface brightness, for which we adopt the “standard” value of cm-2/K km s-1, is the distance of 15.9 Mpc in units cm, is the area over which emission is observed (in units sterad; here the beam FWHM of the SEST) and is the mass of an H2 molecule of 1.68 10-57 .
Filling in these quantities, we determine that . This infers a ratio of .
In the context of the results by Young & Knezek (1989), this makes it likely that NGC 3175 is an Sc type spiral. If up to 50% of the total CO line flux should have been missed, the corrected ratio is also still consistent with an Sb–Sbc classification. This ratio of 0.74 would be unusual for a galaxy of type earlier than Sb though.
4 Discussion
4.1 Global properties of NGC 3175
| Property | Symbol | Measurement |
|---|---|---|
| Absolute blue magnitude | (mag) | |
| Total blue luminosity | () | |
| Total H I gas mass | () | |
| Total virial mass | () | |
| H I to total mass ratio | ||
| H I to blue light ratio | () | |
| Total mass-to-light ratio | () | |
| Optical colour indexb | B–V (mag) | |
| Total FIR luminosity | () |
Notes to Table 2:
a) All values calculated by us based on Mpc.
b) Both and magnitudes are from the RC3.
In order to interpret the H I gas properties of NGC 3175 in general terms and compare the galaxy with other spirals, we have calculated a few standard properties, as tabulated in Table 2. The far-infrared luminosity, , was taken from Dahlem et al. (2001).
The total virial mass, , was calculated using the formula
| (3) |
where , the 25th magnitude isophotal radius, was used as a measure of and half the width of the integral H I spectrum, km s-1, as (see Figs. 5 and 6), adopting an inclination of .
From a comparison of the values in Table 2 with the data by RH94 (in particular their Figs. 2–5), one can conclude the following:
-
•
The total blue luminosity, , of NGC 3175 is quite normal for a spiral of type Sa–Sc.
-
•
Its total virial mass, , lies near the 25%-level for galaxies of type Sa–Sc in the sample by RH94.
-
•
Accordingly, the total mass-to-light ratio of NGC 3175, , also lies near the 25%-level in RH94’s sample.
-
•
The total H I gas mass of NGC 3175 is relatively low (near the 25%-level) if it were an Sa or Sab galaxy; for types Sb–Sc, it is well below the 25th percentile mark of the data used by RH94, indicating an H I deficiency.
-
•
The ratio of H I gas mass to total mass of only about 1% is at about the 25%-level in RH94’s data if it were an Sa or Sab galaxy. For all later types, this percentage represents a pronounced deficiency (because there is little variance in the ratios for spirals of type Sb or later). Note that if we use our own H I line flux measurement this deficiency is yet much more pronounced, with an H I-to-total mass ratio of only 0.8%.
-
•
The same is true for the ratio.
-
•
Even for an Sa galaxy, NGC 3175’s B–V colour is unusually red, being far beyond the 75%-level of RH94’s data. For galaxies of later types the discrepancy is yet more pronounced. NGC 3175 is in fact one of the reddest nearby spiral galaxies, with a predominantly old stellar population. The same was already found by Ryder & Dopita (1993).
-
•
On the other hand, its FIR luminosity, , is normal for galaxies of types Sa–Sc.
One should note that , and do not show a strong dependence on Hubble type (see RH94). On the other hand, quantities like , and do show a dependence of Hubble type (albeit with considerable overlaps). According to these properties, NGC 3175 shows an H I deficiency. For type Sa–Sab, this deficiency would not be very pronounced, but if NGC 3175 should be of a later Hubble type, its H I content is clearly deficient.
4.2 Star formation in the central disk
H I gas has been found by us, corroborating earlier detections; as stated above, NGC 3175 is H I–deficient. The ATCA data provide for the first time spatially resolved information. Our total H I intensity map in Fig. 1 indicates that most of the detected H I gas is located within the central part of the galaxy. Because this is difficult to quantify by looking at the map only, we have produced the radial cut through the emission distribution shown in Fig. 2. From the position of the gauss components (see also Table 1) it follows that practically all H I gas is contained within the central 7 kpc, and that the ongoing SF is enveloped by H I gas. It is very unusual that H I is detected only in the central (7 kpc) of NGC 3175, while normally the stellar disks of spiral galaxies are embedded in extended H I envelopes (Bosma 1981). The radial extent of the H I distribution in NGC 3175 roughly coincides with that of the H and 1.4 GHz radio continuum emission (Ryder & Dopita 1993; Condon et al. 1996). Therefore, only the central part of the disk is apparently forming stars at the present time. This is corroborated by the fact that this is the only region in NGC 3175 with optical colours suggesting the presence of a young population of stars (Ryder & Dopita 1994). All over this central area the H I gas follows a solid body rotation pattern (Fig. 5).
There is no reliable estimate on the total molecular gas content of NGC 3175 in the literature and it is doubtful that Elfhag et al. (1996) measured the total CO line flux of NGC 3175 within one beam of the Swedish-ESO Submillimetre Telescope. Still, the CO spectrum by Elfhag et al. (1996) can serve to give a first impression of the molecular gas properties of the nuclear area in NGC 3175. Its peak antenna temperature of ca. 0.15 K is quite typical for galaxies at a distance of 15.9 Mpc (see also for comparison Young et al. 1995). This and the numbers derived above suggest that H I gas, which is normally more extended than CO, might be more deficient than molecular gas.
Inside the inner disk of NGC 3175, within a radius of 3.5 kpc, the density of cold atomic and molecular gas appears to be high enough for the onset of SF. In fact, the FIR properties of the inner disk in NGC 3175, especially its flux ratio of 0.46 and the implied warm dust temperatures, are reminiscent of starburst galaxies with disk-halo interactions (e.g. Heckman et al. 1990; Dahlem 1997). This is consistent with the observed radio continuum emission distribution which indicates the presence of an outflow from the H II regions in the central disk into the halo (Condon et al. 1996, Dahlem et al. 2001). Since all SF activity is visibly occurring in the central 7 kpc of NGC 3175, it can be assumed that the FIR emission comes from that same region.
4.3 The quiescent outer disk of NGC 3175
Virtually no H I gas was detected beyond a radius of 3.5 kpc (see Fig. 2) with the sensitivity of the current data. At the same time, the outer disk of NGC 3175 exhibits no measurable signs of ongoing SF. There is neither H nor radio continuum emission and there is also no sign of a young, blue population of stars. The outer disk of NGC 3175 does show signs of spiral arms; thus it can be assumed to rotate differentially, but there is not enough gas to trace its rotation pattern.
Such a situation, and also the observed activity in the inner disk, might be created by an interaction (possibly a distant passage of a companion) in the past, which could have affected the outer, volatile neutral atomic gas component, but not the more centrally concentrated and therefore more stably bound molecular gas (e.g. Kenney & Young 1989). RH94 and Giovanelli & Haynes (1988) note that interacting galaxies in groups can lose up to 50% of their gas, galaxies in clusters even up to 90%.
All this would also be consistent with the exceptionally red colour of NGC 3175’s disk beyond a radius of 3.5 kpc, because a gravitational interaction could remove part of the gas from the outer disk, while a fraction of the remaining gas would move into the central region (e.g. Combes 1987). The outer, quiescent disk dominates the mean B-V colour index of NGC 3175, because it covers about 90% of the surface area.
4.4 The “missing” H I gas
Our H I observations cannot explain where the H I gas is that must at one point in time have been present in the outer disk of NGC 3175. Except the one weak emission blob to the south-west of NGC 3175, which is negligible in terms of its gas mass (0.8 Jy km s ), our H I data show no sign of emission from either tidal features (like tails, plumes, tidal arms or any other sort of intergalactic or galactic emission from a potential optically faint partner) within a radius of (70 kpc). These results are consistent with those of García (1993), according to whom NGC 3175 is a member of a group of 5 galaxies, none of which is close enough (in spatial projection and at the same time in velocity space) to be directly interacting with it at the current time (Table 2 by García 1993).
A look at the DSS does not help in proposing a likely scenario for the removal of gas from NGC 3175 either. There is no visible interaction partner near NGC 3175 (within a projected distance of , i.e. 230 kpc) massive enough to have stripped it of a significant fraction of its H I gas. ESO 436-G004, about south of NGC 3175, is at a different redshift and thus distance (and therefore not detected in our observations). Two small objects west of ESO 436-G004 that are visible on the second generation DSS (DSS-2) plates, if at approximately the distance as NGC 3175, must be dwarf galaxies.
Our ATCA data are most sensitive to structures with a spatial extent similar to the beam size and the sensitivity after only one aperture synthesis is still limited. Thus, a non-detection of intergalactic H I gas in this data set does not necessarily impose strong constraints on its potential properties. However, the presence of substantial amounts of H I gas in an area of about around NGC 3175 is ruled out by the Parkes data (see above). Also the new Parkes multi-beam survey database, which was searched by us, does not exhibit any signs of H I emission in the relevant redshift interval closer to NGC 3175 than (or 360 kpc), where NGC 3137, one of the group members, is detected. Therefore, the riddle about the fate of NGC 3175’s H I gas remains unsolved for the time being. It is not clear where it might have gone or whether NGC 3175 ever had more H I gas than is detectable at the present time. Certainly there must have been H I gas in the outer disk before from which the observed old stellar population formed.
The fact that NGC 3175 is not a member of a cluster of galaxies, but at the same time H I–deficient, makes this deficiency with simultaneously ongoing SF in its inner part so intriguing. However, a more solid interpretation of this issue must await high-resolution H I and CO imaging observations.
Acknowledgements.
We thank the referee, Dr. A. Bosma, for useful comments that helped improve the paper considerably and Dr. J. Condon for making available the 1.49 GHz radio continuum map in digital form. The Digitized Sky Survey was produced at the Space Telescope Science Institue under U.S. Government grant NAG W-2166. The National Geographic Society - Palomar Observatory Sky Atlas (POSS-I) was made by the California Institute of Technology with grants from the National Geographic Society.References
- (1) Bosma A. 1981, AJ 86, 1825
- (2) Combes F. 1987, in Proceedings NATO Conference on “Galactic and Extragalactic Star Formation”, R. Pudritz and M. Fich (eds.), Reidel, Dordrecht, p. 475
- (3) Condon J. J., Helou G., Sanders D. B., Soifer B. T. 1996, ApJS 103, 81
- (4) Dahlem M. 1997, PASP 109, 1298
- (5) Dahlem M., Lazendic J., Haynes R. F., Ehle M., Lisenfeld U. 2001, A&A (subm.)
- (6) Elfhag T., Booth R. S., Höglund B. et al. 1996, A&AS 115, 439
- (7) García A. M. 1993, A&AS 100, 47
- (8) García-Burillo S., Guélin M., Cernicharo J. J., Dahlem M. 1992, A&A 266, 21
- (9) Giovanelli R., Haynes M. P. 1988, in “Galactic and Extragalactic Radio Astronomy”, G. L. Verschuur, K I. Kellermann (eds.), Springer Verlag, Heidelberg, p. 522
- (10) Heckman T. M., Armus L., Miley G. K. 1990, ApJS 74, 833
- (11) Kenney J. D. P., Young J. S. 1989, ApJ 344, 171
- (12) Mathewson D. S., Ford V. L. 1996, ApJS 107, 97
- (13) Mathewson D. S., Ford V. L., Buchhorn M. 1992, ApJS 81, 413
- (14) Nilson P. 1973, “Uppsala General Catalog of Galaxies”, Uppsala Astronomical Observatory
- (15) Rhee M.-H., Albada T. S. 1996, A&A 115, 407
- (16) Roberts M. S. 1975, in “Galaxies and the Universe”, A. Sandage, M. Sandage, J. Kristian (eds.), Cambridge University Press, Chicago
- (17) Roberts M. S., Haynes M. P. 1994, ARA&A 32, 115
- (18) Ryder S. D., Dopita M. A. 1993, ApJS 88, 415
- (19) Ryder S. D., Dopita M. A. 1994, ApJ 430, 142
- (20) Sandage A. R., Tammann G. A. 1987, “A Revised Shapley-Ames Catalog of Bright Galaxies”, Carnegie Institution of Washington Publ. 635, Washington, 2nd edition
- (21) Theureau G., Bottinelli L., Coudreau-Durand N. et al. 1998, A&AS 130, 333
- (22) de Vaucouleurs G., de Vaucouleurs A., Corwin H. G., Buta R. J., Paturel G., Fouqué P. 1991, “Third Reference Catalogue of Bright Galaxies”, Springer Verlag, New York
- (23) Young J. S., Xie S., Tacconi L., et al. 1995, ApJS 98, 219
- (24) Young J. S., Knezek P. M. 1989, ApJ 347, L55