Abstract
We investigate multicolour imaging data of a complete sample of low redshift () QSO host galaxies. The sample was imaged in four optical (BVRi) and three near-infrared bands (JHKs), and in addition spectroscopic data is available for a majority of the objects.
We extract host luminosities for all bands by means of two-dimensional modeling of galaxy and nucleus. Optical and optical-to-NIR colours agree well with the average colours of inactive early type galaxies. The six independent colours are used to fit population synthesis models. We assess the presence of young populations in the hosts for which evidence shows to be very weak.
QSO host galaxy star formation history from multicolour data
1 Goals
For an assessment of galaxy-formation timescales QSO hosts play a vital role, due to their obvious connection to black hole formation. Dating the nuclear activity and possibly connecting this to external events in the galaxy can help to decide on merger scenarios and the triggering mechanism for activity.
With this work we wanted to start an assessment of the stellar content of host galaxies. By decomposing the host into stellar components we will be able in the future to make detailed comparisons to inactive galaxies.
2 Why multicolour data?
In QSO host galaxy studies using single band or single optical–near infrared (NIR) colours is sufficient to characterise morphological properties like galaxy types, host and nuclear luminosities, apparent signs of interaction or to conduct environment studies (e.g. McLeod & Rieke 1995, Percival et al. 2001). Optical colours or spectra permit the characterisation of the dominant stellar population or allows assessment of black hole masses (McLure et al. 1999, Boisson et al. 2000). The NIR on the other hand yields, for low , the best contrast of host against nucleus and allows to assess the mass-to-light ratio of a host.
For the separation of an SED into stellar populations of different ages, using only optical information becomes insufficient for a unique solution. In the NIR the emission of young populations rapidly decreases and old populations dominate. Thus for a study of the stellar components information about the entire SED from the optical to NIR wavelength range is needed.
For luminous AGN the spectral separation of nuclear and host components is very difficult and at the moment largely dependent on subjective or ad hoc criteria for the nuclear component. The S/N requirements limit studies to small redshifts and low nuclear luminosities, as the acquisition of spectra becomes very expensive, requiring 8m-class telescopes already at . While the quality of the spectral separation methods might change in the future the now available two-dimensional modeling software for QSO hosts allows a detailed and solid assessment of host galaxy fluxes and thus colour information with a high degree of reliability.
3 Sample & observations
We have compiled a sample of 20 objects with , drawn from the Hamburg/ESO survey (HES) for luminous QSOs (Wisotzki et al. 2000). The HES is a flux limited objective-prism survey, with a limiting nuclear magnitude B depending on the field, designed to detect QSOs solely on basis of their spectral properties. Thus unlike samples from many other QSO surveys, the sample is not biased against extended objects.
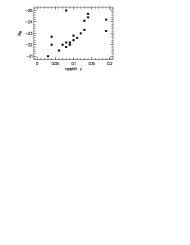
The sample used is a complete sample from a sky area of 611 deg2, a low- subsample of a sample defined by Köhler et al. (1997) to study the luminosity function of QSOs. Distribution in redshift and absolute magnitude are shown in Fig. 1, the sample represents moderately luminous QSOs when compared to the total population at all redshifts. The radio properties of most of the objects in the sample are not yet known, but as a subset of the QSO population most will be radio-quiet.
For all 20 objects we have acquired BVRiJHKs broadband photometry to evenly sample the SED over the optical–NIR wavelength interval. With three NIR bands we get some redundancy in the NIR to stabilise the stellar population fits. In addition we can make comparisons of sample properties to samples at higher redshift without the need for K-corrections. The B band images were integrated 30 s at the ESO 3.6m telescope (EFOSC2), VRi images 300–1200 s at ESO Danish 1.5m (DFOSC), and JHKs 160–900 s at ESO NTT (SOFI). In addition we have available optical spectra (3800–7500 Å) for 14 of the objects, taken with the ESO 3.6m telescope.
4 Fitting stellar populations
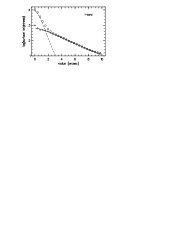
The nuclear contribution of the total QSO light has to be separated from the stellar light. We have developed a package for simultaneous two-dimensional modelling of a parametrised host model and the nuclear contribution. Luminosities for the hosts are determined from radial flux growth curves of the images, after subtracting the nuclear model resulting from the best fit (Fig. 2). More details about the modeling are given in the contribution by B. Kuhlbrodt et al. (these proceedings).

We could produce colours for 18 of the 20 objects. In the two remaining cases the separation was not yielding unique solutions due to highly disturbed morphological structure. We excluded these two from further analysis.
For the optical spectra we are currently developing a two-dimensional separation method similar to the imaging case. For some objects the current program already yields host spectra almost free of broad emission line components from the nucleus. Since this is not the case for all objects we use the optical spectra only for an independent cross-check of fit-results based on the broad-band colours derived from our imaging data.
To assess the primary stellar populations of the hosts, we fit stellar population synthesis model spectra to the multicolour data. For this we use single age, single metallicity population (SSP) spectra from the GISSEL96 library (Bruzual & Charlot 1996, Leitherer et al. 1996). We chose models with a Salpeter initial mass function and solar metallicity, ages 0.01–14 Gyr.
These specra were converted to BVRiJHKs colours using ESO filter curves and fitted to the measured host galaxy colours via a least- fit in two steps: 1) fitting only one SSP, age as free parameter, 2) fitting two SSPs, ages and mass-ratio of the two components free.
5 Results & Discussion
The general photometric properties of the sample comply well with values for inactive galaxies, but of course with a large object-to-object variation, B–V (0.78 for an inactive Sab galaxy), V–R (0.55 for intermediate type galaxies), and V–K (3.2 for intermediate type galaxies), values taken from Fukugita et al. (1995) and Griersmith et al. (1982).
Of the 20 objects we could classify three as spheroidal, ten as disks from morphological analysis. Seven show signs of at least mild disturbance.
Fitting one or two SSPs is a strong simplification. At least for disks with a significant amount of onging continuous starformation this will surely oversimplify the picture.
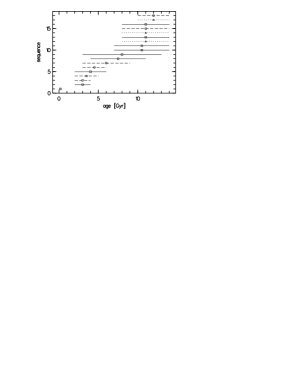
Fitting one SSP in principle only compares general optical-to-NIR colours of host and SSP. Still the ages derived from the fits (Fig. 3) show a generally good agreement between with ages expected from the morphological classification. The three classified spheroidals correspond to old populations of 7–17 Gyr while the majority of the disks have a clear tendency towards younger SSPs.
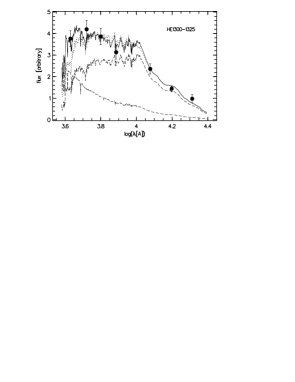
When fitting two SSPs, we can distinguish contributions from old and young populations. For most objects though, contributions from a second population did not improve the fit by a great amount. If at all, the involved masses of a young population were small, only for two objects of the order of . The resulting spectra for one of them are shown in Fig. 4. We see an excess of blue light in the data (points) compared to the dotted line (single SSP fit). Since both objects are morphologically classified as disks, models with continuous star formation will also be able to explain the blue component.
For the other objects no major second component was detected, and in fact all these objects are consistent with only one SSP and a uniform upper limit for the second, younger component of (by mass).
In total we find no signs for strong starburst activity, neither from the spectral fitting nor from general sample colours. The results are in favor of the idea that the parent population of QSO host galaxies is in fact the general field population of inactive galaxies.
In the future we will use spectral models representing continuous star formation for disk-type hosts and in addition combine spectral and colour information into one fitting criterium to make use of all information available. In order to do this, the contribution from the current main source of uncertainty, nucleus-galaxy separation, has to be reduced: we are currently improving our software for spectral separation to reach a confidence level comparable to that of the photometric separation.
xxx
References
- [1] C. Boisson, M. Joly, J. Moultaka, D. Pelat, M. Serote Roos, A&A, 357, 850B (2000)
- [2] G. Bruzual & S. Charlot, unpublished (1996)
- [3] M. Fukugita, K. Shimasaku, T. Ichikawa, PASP, 107, 945 (1995)
- [4] D. Griersmith, A. R. Hyland, T. J. Jones, AJ, 87, 1106 (1982)
- [5] C. Leitherer et al., PASP, 108, 996 (1996)
- [6] T. Köhler, D. Groote, D. Reimers, L. Wisotzki, A&A, 325, 502 (1997)
- [7] K. K. McLeod & G. H. Rieke, ApJ, 441, 96 (1996)
- [8] R. J. McLure, M. J. Kukula, J. S. Dunlop, S. A. Baum, C. P. O’Dea, D. H. Hughes, MNRAS, 308, 377 (1999)
-
[9]
W. J. Percival, L. Miller, R. J. McLure, J. S. Dunlop, MNRAS (2001),
astro-ph/0002199 - [10] L. Wisotzki, N. Christlieb, N. Bade, V. Beckmann, T. Köhler, C. Vanelle, D. Reimers, A&A, 358, 77 (2000)