The Ursa Major Cluster of Galaxies. III. Optical observations of dwarf galaxies and the luminosity function down to
Abstract
Results are presented of a deep optical survey of the Ursa Major Cluster, a spiral-rich cluster of galaxies at a distance of 18.6 Mpc which contains about 30% of the light but only 5% of the mass of the nearby Virgo Cluster. Fields around known cluster members and a pattern of blind fields along the major and minor axes of the cluster were studied with mosaic CCD cameras on the Canada-France-Hawaii Telescope. The dynamical crossing time for the Ursa Major Cluster is only slightly less than a Hubble time. Most galaxies in the local Universe exist in similar moderate density environments. The Ursa Major Cluster is therefore a good place to study the statistical properties of dwarf galaxies since this structure is at an evolutionary stage representative of typical environments yet has enough galaxies that reasonable counting statistics can be accumulated. The main observational results of our survey are: (i) The galaxy luminosity function is flat, with a logarithmic slope for from a power-law fit. The error in is likely to be less than 0.2 and is dominated by systematic errors, primarily associated with uncertainties in assigning membership to specific galaxies. This faint end slope is quite different to what was seen in the Virgo Cluster, where . (ii) Dwarf galaxies are as frequently found to be blue dwarf irregulars as red dwarf spheroidals in the blind cluster fields. The density of red dwarfs is significantly higher in the fields around luminous members than in the blind fields. The most important result is the failure to detect many dwarfs. If the steep luminosity function claimed for the Virgo Cluster were valid for Ursa Major then in our blind fields we should have found galaxies with where we have found two dozen. There is a clear deficiency of dwarfs compared with the expectations of hierarchical clustering theory. It is speculated that the critical difference between the Virgo and Ursa Major clusters is the very different dynamical collapse times, which probably straddle the timescale for reionization of the Universe. Dwarf galaxies in the proto-Virgo environment probably formed before the epoch of reionization. The equivalent dwarf halos in the proto-Ursa Major environment probably only formed after the epoch of reionization, when the conditions for star formation were inhospitable.
keywords:
galaxies: luminosity function – galaxies: photometry – galaxies; clusters: individual: Ursa Major1 Introduction
The galaxy luminosity function , defined as the number density of galaxies per unit luminosity , is an important probe of the physical processes that leads to galaxy formation. The luminosity function depends on both the primordial fluctuation spectrum and on the physics governing star formation. The luminosity function has been a popular diagnostic since it is so straightforward to measure, at least at high luminosities, and it is expected to tell us something about a more fundamental parameter, the mass function. Early theoretical attempts were successful at reproducing the general form of the luminosity function (e.g. White & Rees 1978), which decreases monotonically with increasing luminosity, and decreases very steeply indeed above some characteristic luminosity (Schechter 1976; where ; H∘ is the Hubble Constant). More recent theoretical models (e.g. Baugh et al. 1998, Somerville & Primack 1999, Diaferio et al. 1999) have been based on a semi-analytic approach to the study of galaxy formation and are able to make more detailed predictions.
The luminosity function of galaxies in the field is normally determined based on an imaging survey over a chosen angular region of the sky with follow-up redshift measurements of the galaxies (e.g. the Las Campanas Redshift Survey of Lin et al. 1996 and the Autofib survey of Ellis et al. 1996). From Hubble’s law, one has distances and hence can compute luminosities and construct a luminosity function for a cone volume with the observer at the origin. The luminosity functions measured this way tend to be very well-determined at the bright end but poorly-determined at the faint end. Most galaxies in a magnitude-limited sample are distant luminous galaxies, not nearby low-luminosity galaxies. The clumpiness of the distribution of galaxies and the fact that the faintest galaxies are drawn from a very small region means the normalization of the faint end relative to the brighter end is usually dubious. Imaging to extremely deep limits does not help since the angular coverage on the sky is then necessarily small – for example there are only two galaxies in the faintest bin of the Keck survey of Cowie et al. (1996). Galaxies in the Local Group are known down to very faint limits (), but the local luminosity function (van den Bergh 1992, 2000) suffers from poor counting statistics at all luminosities, in addition to possible incompleteness at the very faint end. For example, the Cetus dwarf (Whiting et al. 1999), with , was discovered only last year.
An alternative approach to measuring the luminosity function down to very low luminosities is as follows. The vast majority of low-luminosity galaxies (the “dwarf galaxies”) have low surface-brightnesses and follow (albeit with some scatter) the absolute magnitude vs. central surface-brightness correlation shown in Figure 1 of Binggeli (1994). Red dwarf spheroidal (dSph) and blue dwarf irregular (dIrr) galaxies both have azimuthally-averaged light profiles that are exponential, and follow the same absolute magnitude vs. central surface-brightness correlation (Binggeli & Cameron 1991, Binggeli 1994). Therefore if one finds a low surface-brightness galaxy of a given apparent magnitude in a cluster, it is far more likely to be a low-luminosity member of that cluster than a high-luminosity background galaxy. The converse is true if one finds a high surface-brightness galaxy of the same apparent magnitude. These statements can be made more quantitative by observations of blank sky fields – there is a marked absence of low surface-brightness galaxies in these fields, as we shall see later in this paper. One place where this kind of technique has been employed very successfully is in the Virgo Cluster, where Phillipps et al. (1998) find a very steep galaxy luminosity function, with (here is the logarithmic slope of the luminosity function: ) between and , close to the predicted slope of the galaxy mass function from Press & Schechter (1974) theory, assuming the cold dark matter fluctuation spectrum of Bardeen et al. (1986). These results probe significantly deeper than the well-known Virgo luminosity function of Sandage, Binggeli & Tammann (1985; see also Impey, Bothun & Malin 1987), or the studies of nearby groups of Tully (1988) or of Ferguson & Sandage (1991), all of whom found far shallower luminosity functions. The Virgo results, however, do not necessarily tell us anything about the field luminosity function, which is what is important for cosmology. That is because the Virgo Cluster is a dense environment where the galaxies formed early and where galaxy-galaxy interactions probably played an anomalously important role in shaping present-day galaxy properties.
So we now apply these techniques to the Ursa Major Cluster, a large but diffuse cluster of spiral galaxies at distance of 18.6 Mpc (Tully & Pierce 2000), close to the Virgo Cluster, and attempt to determine the luminosity function of low-luminosity galaxies there. This cluster is very loosely held together and has no appreciable X-ray halo. It is quite different from clusters of elliptical galaxies like Virgo (itself not a particularly rich cluster). The velocity dispersion of the Ursa Major Cluster is low (148 km s-1, compared to 715 km s-1 for Virgo), and its mass is about 1/20 of the mass of the Virgo Cluster (Tully 1987). The results for the Ursa Major Cluster are expected to be be far more representative of what the field galaxy luminosity function will look like at the faint end because most galaxies in the Universe exist in diffuse spiral-rich environments.
A deep optical survey of sufficient angular area for good Poisson statistics is made possible in nearby clusters like Ursa Major by the advent of mosaic CCDs on large telescopes. In this work we used the UH8K (Metzger, Luppino & Miyazaki 1995) and CFH12K (Cuillandre et al. 1999) mosaic cameras on the Canada-France-Hawaii Telescope (hereafter CFHT) to image the cluster along its major and minor axes, along with a number of pointed observations around known cluster members. Additionally we have obtained HI images with the Very Large Array (hereafter VLA) of the fields along the major and minor axes. In this paper we present all the optical data. The radio data are presented elsewhere (Verheijen et al. 2001). The fields around known cluster members already have HI data available, from the Westerbork Synthesis Radio Telescope (hereafter WSRT; Verheijen 1998). We also have taken pointed multicolour images of probable new members and present those data here.
Additionally, we will be able to use the results to determine the colour distribution of low-luminosity galaxies in the cluster, which constrains star formation histories, and give attention to the morphology-density relation of dwarf galaxies in the Ursa Major Cluster. It should be clear from our data whether the dwarf galaxies congregate around the giant galaxies or are more uniformly distributed within the cluster, and whether or not the answer depends on the dwarf galaxy morphology, HI mass, and colour. In the local Universe, these three properties certainly play an important role: red gas-poor dwarf spheroidals cluster around giant galaxies, whereas blue gas-rich dwarf irregulars are less correlated in position with giant galaxies (Binggeli, Tarenghi & Sandage 1990).
This paper is organized as follows. In Section 2 we describe the observations and basic data processing. In Section 3 we describe how we perform photometry and outline how we identify plausible cluster candidate members. In Section 4 we look at the sample so constructed in more detail and describe how confident we are about each identification. Using this sample, we determine luminosity functions, colour distributions, and morphology-density relations in Sections 5 – 7. Finally in Section 8 we summarize and attempt to put all the results together to obtain a coherent picture of the Ursa Major Cluster.
2 Observations and Data Reduction
2.1 General strategy
Our basic observing strategy for this project was as follows: in March 1996 and March 1999 we observed regions in the Ursa Major Cluster using large-format mosaic CCDs with the intention of finding low luminosity galaxies, which we identified based on their low surface brightnesses. A number of background fields were taken for comparison purposes. Pointed three filter observations of the candidates that we identified were then taken in February 2000 using a single-chip CCD so that colours could be measured. In 1996 we mostly observed fields centered on known cluster members (see Figure 1 and Table 1). In 1999 we observed contiguous fields along the major and minor axes of the cluster (again see Figure 1 and Table 1; the field designations we used are presented there). All the fields studied in 1999 were also observed with the HI line receiver at the VLA and all but the ‘blank’ fields observed in 1996 were observed with the HI line receiver at the WSRT. A number of dwarf candidates turned out to be HI gas-rich and we are therefore able to confirm that they really are members from their observed velocities.

For the regions of the sky we study, Galactic extinction is small: mag but varies slightly from field to field and we use the measurements of Schlegel, Finkbeiner & Davis 1998 to correct our data for this effect.
|
|
-
∗
Magnitudes from Paper I. More details about the known members can be found there.
-
†
Magnitudes from this work. When the galaxy was not completely in our field of view, magnitudes are taken from the NASA Extragalactic Database, and the reader is referred there for the original sources. When magnitudes are not available, magnitudes are quoted.
-
∗0
NGC 3977 is a background grand-design spiral galaxy with a heliocentric velocity of 5722 km s-1.
-
∗1
NGC 3888 is a background late-type galaxy at .
-
∗2
NGC 3898 is centered just off this field to the East, and is only partly visible. It is a member of the nearby 12-3 Group and has a heliocentric velocity of 1176 km s-1.
-
∗3
NGC 3850 is a member of the nearby 12-3 group, with a heliocentric velocity of 1140 km s-1 (Verheijen et al. 2000).
-
∗4
UGC 6828 is a grand-design spiral, presumably background.
-
∗5
UGC 6956 is centered just off this field to the East, and is only partly visible in our field of view.
-
∗6
PC1200+4755 is a foreground emission-line galaxy with a spectroscopic redshift (Schneider et al. 1994).
-
∗7
CGCG215022 is a giant red early-type galaxy, presumably background.
-
∗8
UGC 7069 is a luminous flat late-type galaxy not seen in HI (Verheijen et al. 2000) and therefore presumably not a cluster member.
-
∗9
NGC 3811 is a background late-type galaxy at .
-
∗10
NGC 4047 is a background late-type galaxy at .
-
∗11
UGC 7358 is a background late-type galaxy at .
2.2 First Observing Run (1996)
Images were taken of the fields listed in Table 1. All images were taken at the prime focus of the CFHT on Mauna Kea, using the UH8K mosaic camera, a mosaic of eight 4K 2K CCDs (Metzger et al. 1995; scale 0.22 arcsec pix-1; total field of view 0.5 degree 0.5 degree). The total area surveyed was then 2.2 square degrees. Each field was imaged as a set of three 1200 seconds exposures in the -band, dithered by up to an arcminute to reject cosmic rays and bad pixels, and to ensure that regions that fell in the gaps between the CCDs on any particular exposure were imaged in at least one other exposure. The -band filter was chosen for this survey to maximize the magnitude limit for the detection of low surface-brightness galaxies with this instrumental setup; the unthinned CCDs had low quantum efficiency at shorter wavelengths and airglow emission contaminates at longer wavelengths. All images were dark-subtracted and flat-fielded using twilight sky flats. Due to geometric distortions arising from the large size of the camera, we did not combine the images until after the galaxy detection stage since these geometric transforms alter the noise statistics in a complex way (see Section 3; to compensate for this effect we ran the detection programs at a low significance threshold so as not to miss any marginally-detected galaxies). Instrumental magnitudes were computed from observations of standard stars, and the photometry was converted to the Cousins magnitude system of Landolt (1992). Images taken under non-photometric conditions were calibrated initially using the data of Tully et al. (1996, hereafter Paper I) and eventually using the data we obtained during the third observing run of the current program (see Section 2.4). The median seeing was 1.0 arcseconds.
2.3 Second Observing Run (1999)
Images were taken of the fields listed in Table 1. All images were taken at the prime focus of the CFHT on Mauna Kea, using the CFH12K mosaic camera, a mosaic of twelve 4K 2K CCDs (Cuillandre et al. 1999; scale 0.22 arcsec pix-1; total field of view 0.7 degree 0.5 degree). The total area surveyed was then 15.8 square degrees. Each field was imaged for 420 seconds. Subsequent exposures were progressively shifted a half–field diameter. Hence, most parts of the sky along the major and minor axes were imaged twice. The projection of camera gaps or flaws shift between exposures so all parts of the sky along these axes were imaged at least once. The fields are designated by the letter A along the major axis (along with a number between 1 and 33 in decreasing order of declination) and by the letter B along the minor (along with a number between 4 and 16 in increasing order of right ascension; fields B01–03 and B17–22 were covered in the VLA survey but not the optical one). Exposures were taken in the -band in order to maintain consistency with the 1996 data. The areas covered by the combined datasets are shown in Figure 1. All images were bias-subtracted (the dark current was negligible) and flat-fielded using twilight sky flats. Instrumental magnitudes were computed from observations of standard stars, and the photometry was again converted to the Cousins magnitude system of Landolt (1992). Some of the images were taken under marginally non-photometric conditions. Originally, photometric zero-points were obtained using the data on luminous galaxies of Paper I with interpolation across the overlapping fields. However, the CFHT12K mosaic camera is large enough that extinction due to cirrus could vary across the detector by up to 0.2 magnitudes along the long axis of the chip (this happened in one or two of the images, where the average extinction was as much as one magnitude; in most images it was much smaller). The entire dataset was recalibrated once the data from the 2000 observing run was reduced. The median seeing was 0.8 arcseconds.
2.4 Third Observing Run (2000)
Images were taken of the candidate cluster members that we identified in the 1996 and 1999 data (see Sections 3 and 4). All images were taken at the f/8 Cassegrain focus of the University of Hawaii 2.2 m Telescope, also on Mauna Kea, using a Tektronix 2048 2048 thinned CCD (scale 0.22 arcsec pix-1; field of view 7.5 arcmin 7.5 arcmin). All data were taken under photometric conditions. Each object was imaged for 360 seconds with a filter, 180 seconds with an filter, and 180 seconds with an filter. All images were bias-subtracted (the dark current was negligible) and flat-fielded using twilight sky flats. Instrumental magnitudes were computed from observations of a large number (about 100 in each filter) of standard stars, and the photometry was again converted to the Johnson () – Cousins () magnitude system of Landolt (1992). The photometric zero-points were accurate to approximately one percent. The median seeing was 0.8 arcseconds.
3 3 Photometry and membership considerations
In a diffuse environment like the Ursa Major Cluster, at the number of background galaxies is higher than the number of cluster members (both the 1996 and 1999 datasets). Statistical background subtraction, as done in distant clusters (e.g. Trentham 1998), will not be sufficient to allow us to correct for background contamination. We need to take the morphologies of the galaxies that we detect into account. As outlined in Section 1, members can be identified based on the magnitude vs. central surface-brightness relation of Binggeli (1994). For galaxies of a given apparent magnitude, cluster members that are dwarfs have lower surface-brightnesses and larger sizes than background giants of the same apparent magnitude. The light is much less concentrated in the dwarfs. Our approach is to make a detailed study of the 1996 dataset plus a number of background fields (two blank UH8K fields near the cluster – the “Blank 1” and “Blank 3” fields – taken in 1996 and nine CFH12K fields taken in 1999) and derive a condition for membership candidature based on the concordance between measured light concentrations (quantified according to Binggeli’s correlation) and the existence of a number of objects (19 in the 1996 dataset) having lower light concentrations than any galaxies of equivalent apparent magnitude in any of the background fields. We then apply these criteria to the far bigger 1999 dataset. Note that dwarf spheroidals and dwarf irregulars follow the same magnitude vs. central surface-brightness correlation (Binggeli 1994) so that if the objects in the 1996 fields are mostly dwarf spheroidals but those in the 1999 fields are mostly dwarf irregulars, this will not bias our results.
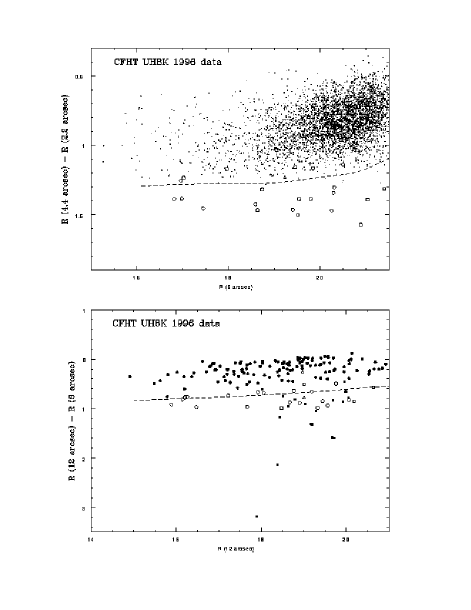
Our application to the 1996 data was then as follows. Objects were detected above local sky (Poisson noise-dominated, 1 between 27 and 28 mag arcsec-2) at a low (2) significance level using the FOCAS detection algorithm (Jarvis & Tyson 1981; Valdes 1982, 1989). For each detected galaxy we then define an inner concentration parameter based on aperture magnitudes:
and an outer concentration parameter:
Both the ICP and OCP are more negative for galaxies of larger scale length, which for a given apparent magnitude equates to galaxies of lower surface-brightness. Both are close to zero for stars, since the seeing was always much less than 2.2 arcsec (the seeing was always good enough that its effect on the concentration parameters for all the galaxies that we consider here was negligible). These concentration parameters characterize the light distribution on physical scales between about 0.2 kpc and 1 kpc (in Ursa Major one arcsecond is equivalent to 0.09 kpc). The concentration parameters for galaxies in the 1996 dataset are presented in Figure 2. We now define two conditions:
and
Only one object in the background fields satisfies these conditions (which we later excluded as being an object that would mimic a candidate member had it turned up in a cluster field, under point (v) in the list below) yet a significant number of low surface-brightness objects in the cluster fields do satisfy these conditions. One would expect normal dwarf galaxies to satisfy both conditions, given Figure 1 of Binggeli (1994 – see the lines in Fig. 2). We therefore regard objects that satisfy both conditions as possible cluster members. Figure 2 shows that the differential between members and non-members as defined by these conditions is not completely clean: some objects which satisfy these conditions are certainly background objects due to their being either (i) grand-design luminous spirals with very negative concentration parameters due to star formation in spiral arms at large distance from the galaxy center, (ii) merging galaxies with no well-defined center, (iii) objects with a neighboring galaxy or star that did not get separated into two objects by the detection algorithm, (iv) extremely flat edge-on galaxies (dwarfs are relatively stubby), or (v) low surface-brightness material that seems to be debris or ejecta associated with a nearby giant galaxy. These cases are easily excluded from the sample. A few objects are less straightforward to exclude as background objects since they may show some of these signatures at a low level; these are the objects that we categorize “2” or “3” later in this section and discuss individually in Section 4. In the entire 1996 dataset there were 4154 extended objects with a 6 arcsecond aperture magnitude , only 130 of which were left after imposing condition C1. Those that pass condition C1 were mostly normal background galaxies towards the lower end of the surface-brightness distribution (condition C1 was a very conservative one), but also included clusters members, objects satisfying (i) – (v) above, and some borderline cases. All these objects were studied by eye and the different kinds of objects identified. After imposing condition C2, there were 40 objects left, 17 of which were excluded as being candidate members based on criteria (i) through (v). The remaining 23 were identified as probable or possible members. Four were marginal as regards satisfying these conditions and/or have some morphological hints that they could be background objects. We were less certain about these and categorize them “2” or “3” later in this section. In addition there was one object amongst the 130 that satisfied C1 but failed to satisfy C2 that is probably background, but in our judgment could be an extreme cluster member; we categorize this one “3” as discussed later in this section. Finally, we excluded one very flat low surface-brightness object that appeared to move with respect to the background galaxies between exposures; this may have been a small comet or alternatively an internal reflection within the camera.
|
|||||||||||||||||||||||||||||||||||||||||||||||||||||||||||||||||||||||||||||||||||||||||||||||||||||||||||||||||||||||||||||||||||||||||||||||||||||||||||||||||||||||||||||||||||||||||||||||||||||||||||||||||||||||||||||||||||||||||||||||||||||||||||||||||||||||||||||||||||||||||||||||||||||||||||||||||||||||||||||||||||||||||||||||||||||||||||||||||||||||||||||||||||||||||||||||||||||||||||||||||||||||||||||||||||||||||||||||||||||||||||||||||||||||||||||||||||||||||||||||||||||||||||||||||||||||||||||||||||||||||||||||||||||||||||||||||||||||||||||||||||||||||||||||||||||||||||||||||||||||||||||||||||||||||||||||||||||||||||||||||||||||||||||||||||||||||||||||||||||||||||||||||||||||||||||||||||||||||||||||||||||||||||||||||||||||||||||||||||||||||||||||||||||||||||||||||||||||||||||||||||||||||||||||||||||||||||||||||||||||||||||||||||||||||||||||||||||||||||||||||||
|
||||||||||||||||||||||||||||||||||||||||||||||||||||||||||||||||||||||||||||||||||||||||||||||||||||||||||||||||
-
∗
See Table 1 for the designations. For the 1996 data, the fields are named for luminous giant galaxies. For the 1999 data, the fields are labelled according to their position along the major or minor axis.
-
†
Legend for the third column: A: No HI detection, although clearly irregular/late-type morphology B: weak evidence for a bar C: high central surface-brightness (i.e. small physical size) if a cluster dwarf D: possibly associated with a nearby galaxy E: smooth morphology; probably a dSph F: huge extended halo G: blue colour H: extreme low surface-brightness I: irregular morphology; probably a dIrr J: extremely flat; probably background K: two nucleii; probably a recent merger
The prescription outlined in the previous paragraph can now be applied to the 1999 dataset, which is much larger (there were about 30,000 galaxies with ). All objects satisfying C1 and all that were within 0.1 magnitudes of satisfying both C1 and C2 were looked at individually. Contaminant objects according to the criteria (i) through (v) above were excluded upon inspection by eye. Additionally we found a number of bright late-type galaxies that satisfied both C1 and C2 but were not seen in HI, and questioned their membership on these grounds (see Section 4 for further details). Most of the difficult cases are found at the north end of the major axis, close to the 12-3 Group (Tully 1987), and could arise from contamination by that group. Note that the HI observations did not cover the entire velocity range of the 12–3 group.
It will be clear from the previous two paragraphs that we are somewhat more confident about the membership possibilities of some objects than others. We therefore introduce the following subjective rating scheme, based on our own assessment, for all objects we find other than those presented in Paper I. Candidates are characterized “0” to “3”, where “0”: membership confirmed from HI data (Verheijen et al. 2000, Verheijen et al. 2001). There were no new HI detections in the 1996 fields, but nine new detections in the 1999 fields; “1”: probable member, but no HI detection; “2”: possibly a member, but conceivably background; “3”: probably background, but conceivably a member. Our judgments are based primarily on by how clearly each object satisfies C1 and C2, the morphological criteria (i) through (v), and on the implications of no HI detection in bright galaxies with distinctly irregular morphologies. The justifications for our rating of each object are listed in the next section, along with comments on some objects that we excluded as being possible candidates.
For each candidate we estimate its total magnitude as follows. (i) We compute the flux within some isophote slightly above the extraction limit set by the sky background. This isophote corresponded to the 1.8 isophote in the 1996 data and the 1.5 isophote in the (less deep) 1999 data. For a few extremely large low surface-brightness galaxies, the galaxies could reliably be followed beyond this isophote to a fainter one. (ii) We compute the amount of light that falls below the specified isophote at large radius by fitting an exponential light profile to a part of the galaxy where there are no condensations and extrapolating this light profile beyond the last fitted isophote to infinity (Paper I). The results are estimates of the total, as opposed to isophotal magnitudes. The uncertainties in these magnitudes depend on the details of the light distribution beyond the isophotal radius for each galaxies, which are uncertain, but are likely to be far less than the bin size (2 mag) that we shall use in computing luminosity functions. We only consider galaxies whose isophotal magnitudes are brighter than . At fainter magnitudes it is difficult to rate with confidence any galaxies as “1” since low surface-brightness galaxies in the background fields begin to appear at these faint limits. The faintest magnitude for our luminosity function is therefore not determined by detection constraints, but by where we lose the ability to distinguish cluster members from background galaxies on surface-brightness grounds. Apparent magnitudes were then converted to absolute magnitudes assuming a distance of 18.6 Mpc, corresponding to a distance modulus of 31.35. Colours (from the 2000 data) were computed from apertures centered on the -band galaxy center. Using aperture magnitudes ensures that we are probing the same stellar populations in all filters. The aperture sizes were between 6 and 24 arcseconds. Larger apertures were used for bigger galaxies so as to improve the signal-to-noise. Errors in the colours are dominated by Poisson sky noise and are large for the faintest galaxies. The apertures were always large enough so that differential seeing effects between the different filters were always negligible.
Clearly our methods of identifying members a priori bias us towards selecting a particular kind of galaxy – normal dwarf galaxies. By far most local dwarfs are normal dwarf spheroidals or dwarf irregulars (Binggeli 1994), but it is still instructive to see how we fare with other kinds of low luminosity galaxies like blue compact dwarfs (BCDs). Most BCDs have irregular morphologies (Telles, Terlevich & Melnick 1997) and extended star-formation and/or low surface-brightnesses. We expect these objects to satisfy both C1 and C2 and so to appear in our samples. As a test, we placed the well-studied BCD galaxy UGC 6456 (Lynds et al. 1998) in the Ursa Major Cluster and were able to recover it using the above strategy. In addition, we expect BCDs to be detected in HI and so turn up in the VLA sample.
There are, however, two kinds of objects that we do miss, given our selection criteria. (i) We do not find extreme low surface-brightness disks, which have central surface-brightnesses below 27 mag arcsec-2. No such galaxies are known (although they would be extremely difficult to find anywhere; e.g. Disney 1976). If they did exist and were gas-rich we would find them in our HI survey. The disks of Malin 1 (Bothun et al. 1987), F5686 (Bothun et al. 1990) and GP1444 (Davies, Phillipps & Disney 1988), would have easily turned up in our HI survey, and probably in our optical survey as well. It is only gas-poor extreme low surface-brightness galaxies we need to worry about (the stars in such hypothetical objects could be gravitationally bound by a dark matter halo, for example). (ii) We also miss galaxies with smooth de Vaucouleurs light profiles but faint ( mag arcsec-2) central surface-brightnesses, because they look like background ellipticals. Recall from the fundamental plane (see Kormendy & Djorgkvoski 1989) that higher luminosity ellipticals have fainter central surface-brightnesses, so that if we observe an elliptical galaxy with a moderate central surface-brightness, it is a priori likely to be a background luminous galaxy. Galaxies with the surface brightness profiles of elliptical galaxies but that lie so far away from the fundamental plane as to cause misidentifications with the background appear to be rare, but there was at least one in our survey. Markarian 1460, a Blue Compact Galaxy, failed to satisfy C1 and C2 very substantially, but is a known cluster member based on optical spectroscopy (Pustilnik et al. 1999) and on an HI detection (Verheijen et al. 2001). Only this one object is known in the cluster (Trentham, Tully & Verheijen 2001), although cases with less HI could be missed.
4 Sample
As described in the previous section, we now have a list of possible members, each with a rating “0” to “3” depending on our confidence regarding membership. These are listed in Table 2, along with the coordinates and photometric properties. Images from the CFHT data are presented in Figure 3. The objects are numbered in order of increasing right ascension. For the galaxies we detect we make various specific comments in the third column of Table 2; these often indicate why a particular galaxy received a particular rating.
We do not attempt classifications as dwarf spheroidals or irregulars (although see the list below for more obvious cases) because such classifications are not reliable based on morphological information alone (eg, some ellipsoidal, textureless dwarfs have HI and some lumpy dwarfs are not detected in HI).
Below are comments on some of the more interesting objects that satisfied the above selection criteria but we excluded from our sample. Where no names exist, we derive them from the J2000 coordinates: hhmm.m(+/-)ddmm. These are: NGC 3850 – This galaxy easily satisfied both C1 and C2, but its heliocentric velocity of 1140 km s-1 (Verheijen et al. 2001) places it in the nearby 12-3 Group and not in Ursa Major. We therefore exclude it from the sample; 1145.9+5605 – This very bright () late-type galaxy would surely have been seen in HI were it in the cluster, but it was not. It therefore must be a background object. Additionally we see signs of weak spiral structure, which would be consistent with this being a luminous background late-type galaxy; 1154.7+5053 – This late-type peculiar galaxy () shows weak spiral structure, including a number of knots embedded in one arm, which are probably HII regions. This object was not seen in HI and so is presumably background; 1154.2+5053 – This bright () late-type peculiar galaxy was not seen in HI and so is presumably background; PC1200+4755 – This irregular low surface-brightness galaxy easily satisfied both C1 and C2, but it is a foreground object given its spectroscopic redshift (Schneider, Schmidt & Gunn 1994); 1152.9+4754 – This bright () late-type peculiar galaxy was not seen in HI and so is presumably background. It has two nucleii and weak spiral structure, which would support this interpretation; 1155.5+4846 – This bright () interacting peculiar galaxy was not seen in HI and so is presumably background; 1207.1+4259 – This bright () late-type peculiar galaxy was not seen in HI and so is presumably background. It has some spiral structure with many condensations (presumably HII regions) embedded in the arms, which would support this interpretation; 1206.4+4226 – This bright () flattened late-type galaxy was not seen in HI and so is presumably background; 1209.6+4201 – This bright () late-type galaxy was not seen in HI and so is presumably background. There is weak evidence for spiral structure, which would support this interpretation; 1213.4+4901 – This bright () late-type galaxy was not seen in HI and so is presumably background. Again there is weak evidence for spiral structure, which would support this interpretation. Additional notes on these and other galaxies that were excluded are presented in the notes to Table 1.
5 Luminosity functions
The luminosity functions are presented in Figure 4. It is immediately apparent that wherever we set the borderline between members and non-members (based on our ratings), the Ursa Major luminosity function is much shallower than the Virgo one. Values of were computed from power-law fits to the data and the results are presented in Table 3. The value of appropriate to Ursa Major is about , with an uncertainty of about 0.2. In comparison, in the Virgo Cluster from a similar power-law fit over the range (Phillipps et al. 1998). Note, however, that in this study of the Virgo Cluster there was no culling of the sample for background objects, as in the present paper, which might lead to a slight overestimate of the Virgo numbers.

|
-
Known members from Tully et al. (1996) are included in all the fits, in addition to the new candidates.
The Virgo and Ursa Major luminosity functions are therefore highly inconsistent with each other. There is one caveat: the Ursa Major sample may be incomplete if there exist substantial numbers of either (see Section 3) gas-poor extreme low-surface-brightness galaxies or low-luminosity galaxies that look like distant elliptical or S0 galaxies due to the combination of central surface-brightnesses around 19 mag arcsec-2 and smooth de Vaucouleurs light profiles (like Markarian 1460). In order for the Ursa Major luminosity function to be the same as the Virgo one, we would need to have missed many hundred such objects. Objects of the first type do not appear to be common: on going to fainter magnitudes we did not find proportionately more galaxies with extremely low surface brightnesses. The lowest surface brightness object that we detected was umd 27, which had an average surface brightness of 24.6 mag arcsec-2 within the 20% light radius, somewhat brighter than the 1- limit quoted in Section 3. Given that the only case of the second type known is Markarian 1460, we do not regard as a serious worry either.
Since the Ursa Major Cluster is a diffuse unevolved cluster of spiral galaxies and since most galaxies in the Universe reside in such environments, our results may be representative of the field luminosity function as well, down to (). The Local Group is another example of such an environment and has a similarly shallow luminosity function (; van den Bergh 1992), albeit with large errors due to poor counting statistics. More negative values of (i.e. steeper luminosity functions) have been found in the spectroscopic surveys of Lin et al. (1996) and Marzke et al. (1994), although these values of come from a Schechter (1976) function fit to the bright galaxies, not a power-law fit to galaxies as faint as the ones we observe here. The values of we present are only valid for the magnitude ranges identified in Table 3, which only overlap marginally at the bright end with the spectroscopic samples. Given this fact, and the difference in the way is computed from the data, the two results are not inconsistent.
The fraction of HI–detectable objects is decreasing toward fainter absolute magnitudes. Nevertheless some of the faintest optical galaxies (like umd 40) do have significant amounts of cold gas. A more quantitative investigation of this phenomenon is presented in Verheijen et al. (2001).
6 Colours
The colours of the new galaxies are listed in Table 2 and presented in Figures 5 and 6. In Figure 7 we present a histogram of the colours of galaxies whose errors in are less than 0.2 mag. The galaxies we consider here all have if they lie in Ursa Major, hence qualify as dwarfs (see Binggeli 1994).


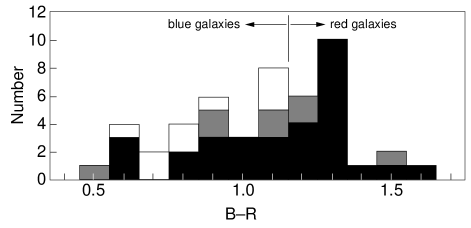
Typical values are for dSph galaxies and for dIrr galaxies (see Coleman, Wu & Weedman 1980 and Section 5 of Trentham 1998; see also references within those papers). With as a division between “red” and “blue” dwarfs, we find that in the 1996 data there are 10 (12) red dwarfs rated “0” or “1” and 5 (7) blue dwarfs (where the number before the brackets is restricted to cases with colour errors and the number in brackets includes cases with large colour errors). In the 1999 data there are 5 (11) red dwarfs rated “0” and “1” and 10 (12) blue dwarfs. Most of the red dwarfs have featureless morphologies, indicating that they are indeed dSph galaxies. The fraction of dwarfs that are dSph was higher in the 1996 dataset than in the 1999 dataset, suggesting that the dSphs might cluster around luminous galaxies more than dIrrs within the Ursa Major Cluster, just as Binggeli et al. (1990) found in the local Universe.
By contrast with the Ursa Major Cluster, in the Virgo Cluster the vast majority of low luminosity galaxies are dwarf spheroidals (Sandage et al. 1985, Phillipps et al. 1998).
7 Distribution of dwarfs in the cluster
The total area covered by the 1999 dataset was about 7.7 times the area covered by the 1996 dataset, yet we only found 1.2 times as many galaxies rated “0” or “1”. It therefore appears that galaxies are somewhat more likely to be found around luminous galaxies in the cluster than in random places in the cluster. This tendency is more marked for red dSph galaxies than for blue dIrr ones.

There is a strong suggestion of a correlation between the tendency to have a substantial satellite population and parent luminosity within the 1996 dataset. The four galaxies with the largest satellite populations are NGC 3992 (Sbc; ; 6 probable/possible dwarfs), NGC 3998 (E/S0; ; 6 probable dwarfs), NGC 4157 (Sb; ; 5 probable/possible dwarfs), and NGC 4100 (Sbc; ; 4 probable/possible dwarfs). Note that NGC 4157 was just to the north of the field centered on UGC 7176. There were four luminous Sb-bc galaxies in the 1996 dataset, only one not manifesting a significant satellite population (NGC 3953: Sbc; ; 1 probable dwarf). The three cluster fields observed in 1996 centered on a low luminosity galaxy or no known member were completely devoid of new dwarf candidates.
One of the two 1996 fields with the largest number of dwarfs (six) contains the NGC 3998/3990/3972 subgroup, an aggregation of three luminous galaxies (including two S0s), which may be a region of the cluster with an anomalously low local crossing time. One of these galaxies, NGC 3998, is the only galaxy in Ursa Major seen to have a large globular cluster population.
The 1996 fields were chosen based on prior information on the positions of galaxies so an unbiased analysis of the clustering properties within these fields is not possible (they were chosen because prior WSRT observations of the fields were available). On the other hand, the 1999 fields were chosen to simply march along the major and minor axes in the cluster, so they represent a reasonable random sampling. In Figure 8, we show the positions of the galaxies in the 1999 fields in supergalactic coordinates. It is clear from this figure that our sampling intersects two aggregations of dwarfs, one at each end of the major axis.
The aggregation at the high supergalactic longitude end lies in the general vicinity of the subcondensation of early-type galaxies, NGC 4111, 4117, and 4143, in and adjacent field A30. The only other subcondensation of early type galaxies in the Ursa Major Cluster, that around NGC 3998, was found from the 1996 data to be an environment elevated in dwarfs.
The aggregation at the low supergalactic longitude end might suffer serious contamination from the nearby 12-3 Group. The 12-3 Group is nearby in the sky to this end of the major axis of the cluster but at slightly higher velocity than the Ursa Major Cluster. In Paper I it is noted that it is at this border with the 12-3 Group that the Ursa Major Cluster is least cleanly defined. It is distinctly possible that the dwarfs in this region identified as possible/probable group members are not in the Ursa Major Cluster but, rather, are in the adjacent 12-3 Group and it will take velocity information or precise distance discrimination to settle the question. We are assuming that these galaxies are members of the Ursa Major Cluster, so if they are not members the luminosity function has even a lower slope than we claim.
Outside these two condensations, the clustering of dwarfs within the 1999 dataset is weak. The principal finding is the paucity of dwarf candidates. Along the major and minor axis strips, it is as likely to find a big, previously cataloged cluster member as a dwarf galaxy probably/possibly associated with the cluster. There are so few candidate dwarfs that it makes little sense to look for spatial correlations.
We have found that the red spheroidal candidates do tend to reside near most of the luminous giant galaxies in our survey region, though they are not abundant even there. Elsewhere they are rare. The blue candidates, some with detectable HI and others with only HI upper limits, are more loosely distributed through the cluster but in remarkably small numbers.
8 Discussion and Summary
The following eight observations and inferences present a summary view of aspects of the Ursa Major Cluster (see also Paper I). The last six derive from the present work. For each of these new results we discuss possible reasons for why the cluster behaves the way it does in the context of the wider galaxy formation problem. (1) The Ursa Major Cluster is a diffuse cluster of 62 luminous galaxies with (assuming a distance Mpc), all but eight of which are late-type galaxies (Paper I). The early-type galaxies in the cluster are lenticulars, with at most one elliptical, and none are extremely luminous. Five of the early-type galaxies lie in two nests at opposite ends of the cluster. (2) The mass of the Ursa Major Cluster is , about one-twentieth the mass of the Virgo Cluster (the -band mass-to-light ratio is 6 times higher for Virgo than for Ursa Major; see the introduction to Paper I) . The collapse timescale for the Ursa Major Cluster is Gyrs, roughly a Hubble time (Tully 1987). By comparison, the collapse timescale for the Virgo Cluster is Gyrs, so that cluster is much more dynamically evolved. Most galaxies in the Universe exist in unevolved environments like the Ursa Major Cluster. This cluster is therefore a good place to study dwarf galaxy properties in an environment akin to the field yet the density of galaxies is high enough that counting statistics have significance. (3) The luminosity function of dwarf galaxies in the Ursa Major Cluster is very flat, with a logarithmic slope and an uncertainty not more than 0.2. This distribution is far shallower than the Virgo Cluster luminosity function, which has (Phillipps et al. 1998). Dwarf galaxies are thought to be heavily dark-matter dominated (e.g. Aaronson & Olszewski 1987, Persic & Salucci 1988, Kormendy 1990, Pryor & Kormendy 1990). Cold dark matter hierarchical clustering theories of galaxy formation predict large numbers of these small dark-matter halos everywhere, a robust prediction that follows directly from the fluctuation spectrum. It appears that the expectations of the theory are met, and only met, in dynamically evolved regions like the Virgo Cluster. Hence there is apparently suppression in low density environments.
Galaxies within evolved clusters have had many crossing times in which to interact. Gas cannot continue to be accreted onto galaxies once they enter cluster environments since the gas is outside the Roche-limit of the galaxies within the cluster potential (Shaya & Tully 1984). That gas thermalizes and becomes the X-ray plasma. The environment in low density regions is much more benign for gas accretion onto the dwarfs. In spite of this the dwarfs are numerous in dynamically evolved environments and not in low density environments.
Suppose that dwarfs that have ended up in evolved clusters formed very early, on top of the large scale fluctuation that grew into the cluster. Most of them have been absorbed into bigger systems but there were such large numbers of them that many survive. Over in the low density regions the entire process was slowed. The small scale perturbations that produced dwarfs collapsed over a more extended time. Supernovae and massive star formation periodically evacuate or rarefy the gas. If nothing else was going on, perhaps this gas could re-accumulate and continue to form stars. But something else is going on: in the low density phase the gas is being ionized by the metagalactic ultraviolet flux. The dark wells might persist but gas cannot accumulate to form stars (Klypin et al. 1999, Bullock et al. 2000). The result is a dwarf luminosity function that is steep in clusters but flat in the field. In such a scenario, the dwarf formation in Virgo happens much earlier than the dwarf formation in Ursa Major; this timescale difference is consistent with what is expected given hierarchical cluster models of galaxy formation given a plausible redshift for the reionization of the Universe (Tully et al. 2001). (4) Dwarfs in the Ursa Major Cluster are as likely to be dwarf irregulars as dwarf spheroidals. This finding derives particularly from the 1999 dataset, where we observed blind fields along the minor and major axes. Many low luminosity galaxies therefore appear to be capable of ongoing star formation, as is the case with the giant galaxies in the cluster. This property is probably linked to the young dynamic age of the cluster. The galaxies in question have been relatively isolated all their lives and have been able to draw upon gas reservoirs over an extended time. The Ursa Major Cluster is quite different from the Virgo Cluster, where HI gas reservoirs have more frequently been depleted and the dwarf galaxies that we see there today are mostly dwarf spheroidals. (5) Most dwarfs that we detect have reasonably low surface brightnesses and follow the absolute magnitude vs. surface brightness correlation suggested by Figure 1 of Binggeli (1994; also see Tully & Verheijen 1997, Paper II). Compact dwarfs are rare. The same is true in both the local field (Binggeli, Sandage & Tammann 1988) and in richer clusters like Coma (Karachentsev et al. 1995) where the luminosity function of high surface brightness ellipticals is falling rapidly at faint magnitudes. (6) The dwarf galaxies seem to be clustered within the Ursa Major Cluster. In particular, there appear to be two aggregations, each of about twelve galaxies, at each end of the major axis. Dwarfs probably have substantial dark-matter halos which themselves are highly clustered in the context of hierarchical clustering models of galaxy formation. Clustering within the Ursa Major Cluster has not yet been washed out by galaxy-galaxy interactions. This circumstance is not surprising given the low velocity dispersion, hence long crossing time. (7) All but one of the giant galaxies targetted in the 1996 observations have a significant number of spheroidal candidates projected within kpc. Perhaps their presence manifests a small-scale version of the physical processes discussed in point (3) since the local dynamical time on the mass scale of the giant galaxy is short. Alternatively, since the numbers of dwarfs are modest, these objects could be debris from ancient galaxy formation interactions (Mirabel, Dottori, & Lutz, 1992) (8) Galaxies with HI detections can be as faint as (). The details of the HI observations are presented elsewhere (Verheijen et al. 2000).
Acknowledgments
NT acknowledges the PPARC for financial support. Helpful discussions with M. Disney, R. Terlevich, and E. Terlevich are gratefully acknowledged. Observations were made at the Canada-France-Hawaii Telescope, which is operated by the National Research Council of Canada, the Centre National de la Recherche Scientifique de France, and the University of Hawaii.
References
- [bl] Aaronson M., Olszewski E., 1987, in Kormendy J., Knapp G. R., ed., IAU Symposium 117: Dark Matter in the Universe. Reidel, Dordrecht, p. 153
- [bl] Bardeen J. M., Bond J. R., Kaiser N., Szalay A. S., 1986, ApJ, 304, 15
- [bl] Baugh C. M., Cole S., Frenk C. S., Lacey C. G., 1998, ApJ, 498, 504
- [bl] Binggeli B., 1994, in Meylan G., Prugneil P., ed., ESO Conference and Workshop Proceedings No. 49: Dwarf Galaxies. European Space Observatory, Munich, p. 13
- [bl] Binggeli B., Cameron L. M., 1991, A&A, 252, 27
- [bl] Binggeli B., Sandage A., Tamman G. A., 1988, ARAA, 26, 509
- [bl] Binggeli B., Tarenghi M., Sandage, A., 1990, A&A, 228, 42
- [bl] Bothun G. D., Impey C. D., Malin D. F., Mould J. R., 1987, AJ, 94, 23
- [bl] Bothun G. D., Schombert J. M., Impey C. D., Schneider S. E., 1990, ApJ, 360, 427
- [bl] Bruzual G., Charlot S., 1993, ApJ, 405, 538
- [bl] Bullock J. S., Kravstov A. V., Weinberg D. H., 2000, ApJ, submitted, (astro-ph/00002214)
- [bl] Coleman G. D., Wu C-C., Weedman D. W., 1980, ApJS, 43, 393
- [bl] Cowie L. L. Songaila A., Hu E. M., Cohen J. G., 1996, AJ, 112, 839
- [bl] Cuillandre J.-C., Luppino G., Starr B., Isani S., 1999, CFHT Bulletin 40
- [bl] Davies J. I., Phillipps S., Disney M. J., 1988, MNRAS, 231, 69p
- [bl] Diaferio A., Kauffmann G., Colberg J. M., White S. D. M., 1999, MNRAS, 307, 537
- [bl] Disney M. J., 1976, Nat, 263, 573
- [bl] Ellis R. S., Colless M., Broadhurst T., Heyl J., Glazebrook K., 1996, MNRAS, 280, 235
- [bl] Ferguson H. C., Sandage A., 1991, AJ, 101, 765
- [bl] Impey C., Bothun G., Malin D., 1988, ApJ, 330, 634
- [bl] Jarvis J. F., Tyson J. A., 1981, AJ, 86, 476
- [bl] Karachentsev I. D., Karachentseva V. E., Richter G. M., Vennik J. A., 1995, A&A, 296, 643
- [bl] Klypin A., Kravtsov A., Valenzuela O., Prada F., 1999, ApJ, 522, 82
- [bl] Kormendy J., 1990, in Kron R. G., ed., The Edwin Hubble Centennial Symposium: The Evolution of the Universe of Galaxies. Astronomical Society of the Pacific, San Francisco, p. 33
- [bl] Kormendy J., Djorgovski S., 1989, ARAA, 27, 235
- [bl] Landolt A. U., 1992, AJ, 104, 340
- [bl] Lin H., Kirshner R. P., Shectman S. A., Landy S. D., Oemler A., Tucker D. L., Schechter P. L., 1996, ApJ, 464, 60
- [bl] Lynds R., Tolstoy E., O’Neil E., Hunter D. A., 1998, AJ, 116, 146
- [bl] Marzke R. O, Geller M. J., Huchra J. P., Corwin H. G., 1994, AJ, 108, 437
- [bl] Metzger M. R., Luppino G. A., Miyazaki S., 1995, BAAS, 187, 73.05
- [bl] Mirabel I. F., Dottori H., Lutz D., 1992, A&A, 256, L19
- [bl] Persic M., Salucci P., 1988, MNRAS, 234, 131
- [bl] Phillipps S., Parker Q. A., Schwartzenberg J. M., Jones J. B., 1998, ApJ, 493, L59
- [bl] Press W. H., Schechter P., 1974, ApJ, 187, 425
- [bl] Pryor C., Kormendy J., 1990, AJ, 100, 127
- [bl] Pustilnik S., Engles D., Ugryumov V., Lipovetsky V. A., Hagen H. J., Kniazev A. Y., Izotov Y. I., Richter G., 1999, A&AS, 137, 299
- [bl] Salpeter E. E., 1955, ApJ, 121, 161
- [bl] Sandage A., Binggeli B., Tammann G. A., 1985, AJ, 90, 1759
- [bl] Schechter P., 1976, ApJ, 203, 297
- [bl] Schlegel D. J., Finkbeiner D. P., Davis M., 1998, ApJ, 500, 525
- [bl] Schneider D. P., Schmidt M., Gunn J. E., AJ, 107, 1245
- [bl] Shaya E. J., Tully R. B., 1984, ApJ, 281, 56
- [bl] Somerville R. S., Primack J. R., 1999, MNRAS, 310, 1087
- [bl] Telles E., Melnick J., Terlevich R. J., 1997, MNRAS, 288, 78
- [bl] Trentham N., 1998, MNRAS, 295, 360
- [bl] Trentham N., Tully R. B., Verheijen M. A. W., 2001, MNRAS, submitted
- [bl] Tully R. B., 1987, Nearby Galaxies Catalog, Cambridge University Press,
- [bl] Tully R. B., 1987, ApJ, 321, 280
- [bl] Tully R. B., 1988, AJ, 96, 73
- [bl] Tully R. B., Pierce M J., 2000, ApJ, 533, 744
- [bl] Tully R. B., Somerville, R. S., Trentham N., & Verheijen M. A. W., 2001, ApJ, to be submitted
- [bl] Tully R. B., Verheijen M. A. W., 1997, ApJ, 484, 145 (Paper II)
- [bl] Tully R. B., Verheijen M. A. W., Pierce M. J., Huang J. -S., Wainscoat R. J., 1996, AJ, 112, 2471 (Paper I)
- [bl] Valdes F., 1982, Proc. SPIE, 331, 465
- [bl] Valdes F., 1989, in Grosbol P. J., Murtagh F., Warmels R. H., ed., ESO Conference and Workshop Proceedings No. 31: Proceedings of the 1st ESO/St-ECF Data Analysis Workshop. European Space Observatory, Munich, p. 35
- [bl] van den Bergh S., 1992, A&A, 264, 75
- [bl] van den Bergh S., 2000, PASP, 112, 529
- [bl] Verheijen M. A. W., 1998, PhD Thesis, University of Groningen
- [bl] Verheijen M., Trentham N., Tully B., Zwaan M., 2000, in Kraan-Korteweg R. C., Henning P. A., Andernach H., eds, Mapping the Hidden Universe: The Universe Behind the Milky Way - The Universe in HI. ASP, San Francisco, in press (astro-ph/0006122)
- [bl] Verheijen M., Trentham N., Tully B., Zwaan M., 2001, in preparation
- [bl] White S. D. M., Rees M. J., 1978, MNRAS, 183, 321
- [bl] Whiting A. B., Hau G. K. T., Irwin M., 1999, AJ, 118, 2767