The Stellar Content of Obscured Galactic Giant H II Regions III.: W31
Abstract
We present near infrared (, , and ) photometry and moderate resolution ( 3000) band spectroscopy of the embedded stellar cluster in the giant H II region W31. Four of the brightest five cluster members are early O–type stars based on their spectra. We derive a spectro–photometric distance for W31 of 3.4 0.3 kpc using these new spectral types and infrared photometry. The brightest cluster source at is a red object which lies in the region of the vs. color–color plot inhabited by stars with excess emission in the band. This point source has an plus band spectrum which shows no photospheric features, which we interpret as being the result of veiling by local dust emission. Strong Brackett series emission and permitted Fe II emission are detected in this source; the latter feature is suggestive of a dense inflow or outflow. The near infrared position of this red source is consistent with the position of a 5 GHz thermal radio source seen in previous high angular resolution VLA images. We also identify several other band sources containing excess emission with compact radio sources. These objects may represent stars in the W31 cluster still embedded in their birth cocoons.
1 INTRODUCTION
Blum et al. (1999, hereafter Paper I) and Blum et al. (2000, hereafter Paper II) presented near infrared imaging and spectroscopic observations of two optically obscured Galactic giant H II regions, W43 and W42, respectively. These observations revealed the massive star clusters at the center of the H II regions which had been previously discovered and studied at longer wavelengths. Our earlier work builds off the original success by Hanson et al. (1997) in elucidating the massive stellar content in M17 through detailed spectral classification of O–type stars in the band (Hanson et al., 1996). The combination of imaging and spectroscopy at near infrared wavelengths is proving to be a powerful tool in exploring the youngest stages of stellar evolution and the birth environments of massive stars. The chief advantage of the near infrared is that it is long enough in wavelength to lessen (by upto a factor of ten in magnitudes) the effect of interstellar extinction over optical wavelengths and still short enough in wavelength to potentially probe the stellar photospheric features of massive stars. Thus, the near infrared is ideal to explore stellar nurseries to identify and elucidate the nature of their massive stars.
In the present paper, we continue our investigation of the high end of the Galactic stellar mass function and search for massive young stellar objects (YSOs) with observations toward W31. W31 is a well known star forming region which has been observed at radio, far infrared (FIR), and mid infrared (MIR) wavelengths. The W31 complex consists of three H II regions, G10.2–0.3, G10.3–0.1, and G10.6-0.4 (Wilson, 1972). The first, G10.2–0.3 is a giant H II region (GHII) which we define (following the suggestion of Dr. Robert Kennicutt, private communication) as one which produces at least Lyman continuum ( Lyc) photons per second. This is about ten times the luminosity of the Orion nebula and roughly the number emitted from the hottest single O3-type star. As these stars are not found in isolation, there is an implication that a “giant” H II region contains some minimum of multiple O-type stars. The embedded stellar cluster in G10.2–0.3 (which we refer to as W31) is the subject of this paper. Recent FIR and radio observations as well as a summary of earlier long wavelength work are presented by Ghosh et al. (1989).
W31 is located at 10.2∘, ∘ in the first Galactic quadrant. Its distance is not well known ( 4.1 0.9 kpc) owing to the classic radio recombination line velocity degeneracy and a non-definitive molecular absorption velocity (Wilson, 1972). We have modified the Wilson (1972) lower limit by taking the sun–to–Galactic center distance as 8 kpc (Reid, 1993). We discuss the distance to W31 in §4 in light of our new spectro–photometric observations. Smith et al. (1978) put the Lyman continuum output of W31 at 21050 s-1 (for a distance of 4.1 kpc, corrected to 8 kpc).
2 OBSERVATIONS AND DATA REDUCTION
( m, m), ( m, m), and ( m, m) images of W31 were obtained on the nights of 04 May 1999 and 22 May 2000 with the f/14 tip–tilt system on the Cerro Tololo Interamerican Observatory (CTIO) 4m Blanco telescope using the facility infrared imager OSIRIS. 111OSIRIS is a collaborative project between the Ohio State University and CTIO. OSIRIS was developed through NSF grants AST 9016112 and AST 9218449. Spectroscopic data for bright stars in W31 were obtained on the nights of 19, 21, and 22 May 2000 using the f/14 tip–tilt system at the Blanco telescope with OSIRIS. OSIRIS is described in the instrument manual found on the CTIO web pages (www.ctio.noao.edu); see also DePoy et al. (1993). The tip-tilt system is described by Pérez & Elston (1998). The tip–tilt system uses three piezo–electric actuators to move the secondary mirror at high frequency in a computer controlled feed–back loop which corrects the natural image centroid motion. OSIRIS employs 0.16′′ pixels in the mode used for all data described in this paper.
All basic data reduction was accomplished using IRAF222IRAF is distributed by the National Optical Astronomy Observatories.. Each image/spectrum was flat–fielded using dome flats and then sky subtracted using a median combined image of five to six frames. For W31 itself, independent sky frames were obtained 500 arcseconds south of the cluster. Standard stars used the median combination of the data for sky.
2.1 Images
The OSIRIS 1999 May images were obtained under variable photometric conditions with some thin cirrus and in 0.5′′ to 0.6′′ FWHM seeing (with the tip–tilt correction). Total exposure times on source were 504 s, 281 s, and 181 s at , , and , respectively. The individual , , and frames were shifted and combined (Figure 1, 1, 1), and these combined frames have point sources with FWHM of 0.51′′, 0.54′′, and 0.56′′ at , , and , respectively. DoPHOT (Schecter et al., 1993) photometry was performed on the combined images. The flux calibration was accomplished using standard star 9172 from Persson et al. (1998) which is on the Las Campanas Observatory photometric system (LCO) in combination with short , , and images on W31 on 22 May 2000 under photometric conditions. The LCO standards are essentially on the CIT/CTIO system (Elias et al., 1982), though color transformations exist between the two systems for redder stars. No transformation exists between OSIRIS and either CTIO/CIT or LCO; the impact of this lack of transformation is further discussed below in §3.4.
The standard observations were made immediately after the W31 data were obtained and within 0.1 airmass of the airmass for W31. No corrections were applied for these small differences in airmass. Aperture corrections using 20 pixel radius apertures were used to put the instrumental magnitudes on a flux scale using between five and eight relatively uncrowded stars on the W31 images.
Uncertainties for the final , , and magnitudes include the formal DoPHOT error added in quadrature to the published error of the photometric standards and to the uncertainty of the aperture corrections (between the OSIRIS 1999 and 2000 data and the OSIRIS 2000 data and the standard star). The sum in quadrature of the aperture correction and standard star uncertainties is 0.027, 0.018, 0.021 mag in , , and , respectively. The DoPHOT errors ranged from approximately 0.01 mag to an arbitrary cut–off of 0.2 mag (stars with larger errors were excluded from further analysis).
The flat–field illumination for the 1999 May images was not uniform. A smooth gradient with full range of about 10 was present. Corrections to the final photometry were made based on observations of a standard star taken over a 49 position grid covering the array.
2.2 Spectra
The band spectra of six of the brightest stars in the center of W31 were obtained with a 0.48′′ wide slit (oriented EW) in 0.5′′ to 7′′ FWHM seeing and divided by the spectrum of HR 6953 (B9V), HR 6962 (A2V), or HR 7183 (B8V) to remove telluric absorption features. Total on source integration times were between 10 and 21 minutes for each W31 object and about 100 seconds for each telluric standard. Br absorption in the HR stars was removed by eye by drawing a line across it between two continuum points. One dimensional spectra were obtained by extracting and summing the flux in 2 pixel apertures (0.64′′ wide). The extractions include background subtraction from apertures centered 1.0′′ on either side of the object.
An band spectrum was obtained of the brightest cluster object, W31 #1. The slit width, telluric correction, seeing, and extraction were similar to those for the band spectra. HR 6962 (A2V) was used to correct for telluric absorption. The intrinsic Br absorption in HR 6962 was removed by making smooth fits to the line profiles, and then dividing the original spectrum by the fit line spectrum. Regions outside the line profiles were set to unity in the fit line spectrum. The total on source integration time was 14 minutes.
The wavelength calibration was accomplished by measuring the positions of bright OH- lines from the band sky spectrum (Olivia & Origlia, 1992). Lines in the W31 spectra are identified by their relative differences between one and another. The measured dispersion is 0.0002762 m pix-1 in and 0.0003683 m pix-1 in . The spectral resolution at 1.65 and 2.2 m is 3000.
3 RESULTS
The , , and band images shown in Figure 1–1 have been combined into a false color image (Figure 2) with colors red, green, and blue representing , , and , respectively. Figure 2 reveals a rich cluster of newly formed stars at the heart of W31. Some of these (see below) are shown to be massive O stars from their band spectra. Spectroscopic and photometric evidence is also given below which indicates that young stellar objects (YSO) are present; thus the W31 cluster must be very young and its stars still undergoing their birth pangs.
The bright object (source “A”) near the center of Figure 2 is a foreground star. Our unpublished band spectrum and its position in the color–color plot (see below) suggest it is an M dwarf star. We have identified this object (and several others) on the Digital Sky Survey 333 Based on photographic data obtained using The UK Schmidt Telescope. The UK Schmidt Telescope was operated by the Royal Observatory Edinburgh, with funding from the UK Science and Engineering Research Council, until 1988 June, and thereafter by the Anglo-Australian Observatory. Original plate material is copyright (c) the Royal Observatory Edinburgh and the Anglo-Australian Observatory. The plates were processed into the present compressed digital form with their permission. The Digitized Sky Survey was produced at the Space Telescope Science Institute under US Government grant NAG W-2166. red image. The USNO A2 catalog gives the coordinates of this object as (2000) = 18, ∘.
3.1 Color Magnitude and Color–Color Diagrams
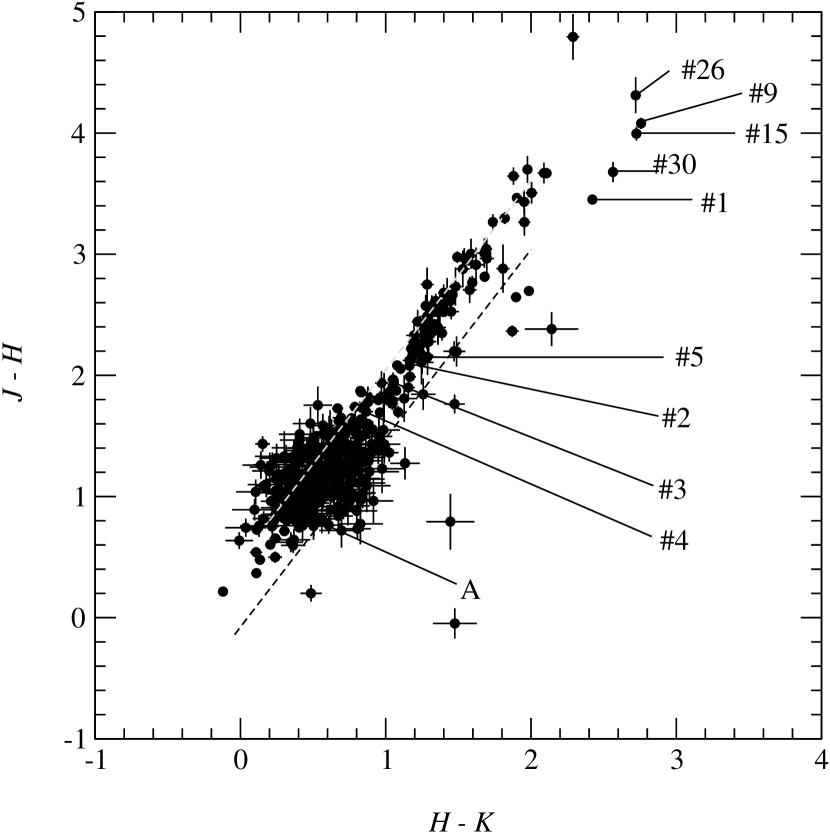
The vs. color–magnitude diagram (CMD) and vs. color color plot are shown in Figures 3 and 4. A foreground sequence is seen in Figure 3 at 0.5 mag. To the red and lying at between about 1.0 and 2.0 is the W31 main sequence. Some stars for which spectra are presented below are labeled. The relative colors of the reddest stars can be used to distinguish two sequences in Figure 4. There is a well populated sequence beginning near vs. 0, 0 which is taken to be the reddened main sequence. A second sequence lying to the red in is populated by sources with a clear indication of excess emission and much larger extinction. We argue below that these are young stellar objects (YSOs; e.g. Lada & Adams (1992); see also the discussion in Paper II), though the precise evolutionary state is difficult to pin down from near infrared observations alone. One of these objects, W31 #1, was observed spectroscopically and is discussed further in §3.2 and §4.
3.2 Spectra
Spectra for each of four hot stars in the W31 cluster are presented in Figure 5. We name these objects W31 #2, #3, #4, and #5 as they are the second to fourth brightest sources at in Figure 3, excluding foreground sources (defined as objects with 0.6 mag). The plus spectrum of W31 #1 (the brightest cluster source) is shown in Figure 6. All the spectra have been ratioed by an A–type star as described in §2 to correct for telluric absorption; the spectra in Figure 5 have been further normalized by a low order fit to the continuum. In the case of W31 #1, the spectrum has been put on a flux scale by multiplication by an appropriate blackbody (10000 K). The and band segments are normalized based on the photometry of Figure 3. The spectrum in Figure 6 is not corrected for extinction. The upturn in the continuum at the end of the band is probably due to vignetting in the OSIRIS camera optics; the continuum slope in this wavelength region is not reliable though the line profiles should not be substaintially afected relative to the local continuum. An analogous downturn may be present at the very end of the band.
3.2.1 O Stars
The spectra of sources W31 #2–5 may be compared to the band spectroscopic standards presented by Hanson et al. (1996). The features of greatest import for classification are (vacuum wavelengths) the C IV triplet at 2.0705, 2.0796, 2.0842 m (emission), the N III complex at 2.116 m (emission), and He II at 2.1891 m (absorption). The 2.0842 m line of C IV is typically weak and seen only in very high signal to noise spectra (Hanson et al., 1996). The presence of N III and He II leaves no doubt that these are O–type stars, and the C IV emission firmly places each in the kO5–O6 subclass. This class is predominantly made up of stars with optical MK spectral types of O5 to O6, but several O4 stars presented by Hanson et al. (1996) also show C IV emission. None of the spectra in Figure 5 show He I 2.12 m absorption which is present in later type O7-9 stars.
Generally strong absorption in Br is expected for kO5–6 dwarf and giant stars and weak absorption or emission for super–giants, so the absorption wings seen in Figure 5 suggests the stars are not highly evolved. However, there is also residual emission seen in W31 #2, 4, and 5. The emission appears superposed on a broader absorption profile and might otherwise be suggestive of a circumstellar origin (e.g. in a disk, though there is no evidence of excess emission for these stars in Figure 4) were it not for the following. There are two problems with Br which make it difficult to interpret and thus render any observations speculative. The first is the fact that Br has to be corrected in the telluric standard (§2), and this is only accurate to five or ten percent for the method used here. Since the correction is for absorption in the standard and is typically under corrected (the core of the line is straight forward to identify, but the wings and continuum more difficult), the tendency is to reduce the intrinsic absorption in the object. It is also possible that any residual absorption in the telluric standard would have a different profile and position than the object. The second problem is that the nebular emission, which is subtracted by using background apertures, can vary over small scales. Even though the background is an average from either side of the object and in close spatial proximity to it, there is no guarantee that it is uniform or linearly varying across the source. It is interesting to note that we find no residual emission from He I 2.06 m. Though Br is often seen in emission in O supergiants (Hanson et al., 1996), the character of the emission is not like that shown in Figure 5 with absorption superposed upon emission. In summary, we can not tell if the residual emission in the O–stars is real (i.e. circumstellar) or an artifact. Higher spectral and spatial resolution observations will be required to make further progress.
3.2.2 W31 #1
The spectrum of W31 #1 is shown in Figure 6. The spectrum rises more steeply to the red relative to the unratioed spectra of the O stars discussed in §3.2.1 (only the continuum divided O star spectra are shown here). This suggests a larger line-of-sight extinction and/or excess emission at redward wavelengths than for the O stars. There are no discernible photospheric absorption features present in either the or bands, though the signal-to-noise is relatively high, 70, in the fainter band. Besides the lines discussed above for the band, lines of He I (1.700 m) and He II (1.692 m and 1.572 m) are expected for luminous hot stars (Blum et al., 1997; Hanson et al., 1998). Fe II emission is identified at (1.6878 m) and perhaps also at 1.7419 m; see Figure 7. There is weak He I 2.06 m emission seen in Figure 6; however He I 1.700 m is absent from the band spectrum of W31 #1. These facts suggest that the line producing region seen in W31 #1 is not very hot.
3.3 Mid and Far Infrared Sources
Our position for the stellar cluster places it near ( 38′′NW) the strong far infrared peak S9 presented by Ghosh et al. (1989) and to the SE of the even more luminous far infrared source S7. The far infrared beam was several arcminutes in diameter and the positional uncertainty quoted is 1′. The position given by Frogel et al. (1977) for the mid infrared source toward G10.2–0.3 (29′′ aperture diameter) is approximately 38′′ east of the near infrared cluster center; Frogel et al. (1977) quote coordinates good to about 20′′. S9 and the mid infrared source are thus possibly coincident with each other and also with the stellar cluster. However, we believe the positional offsets should be taken at face value. It is more likely that the stellar cluster has cleared away much of the gas and dust in its immediate vicinity and that the hottest stars are exciting the material surrounding this cavity. This situation is similar to that for W43 (Paper I). The dust distribution is apparently non–uniform and the exciting cluster gives rise to the strong far infrared sources S9 and S7 to the SE and NW of the cluster, respectively.
3.4 Extinction
The results of the preceding sections may be used to estimate the total line–of–sight extinction to individual sources in the W31 cluster. However, as discussed in § 2, the OSIRIS colors are not on a standard system. The largest effect is expected to be in the filter (Persson et al., 1998; Elston et al., 1997, Paper II) such that the observed and colors are more red than CIT/CTIO. There is no evidence for a significant color term in (Persson et al., 1998).
An estimate of the extent to which color–terms are important can be made by comparing the W31 colors to the dashed reddening lines in Figure 4. The intrinsic colors for O stars and red giants are taken from Koornneef (1983) and Frogel et al. (1978), respectively. The former colors have been put on the CIT/CTIO system (Paper II) by making minor (1) corrections; the latter colors are on the CIT/CTIO system. The reddening lines themselves are derived using the interstellar extinction law of Mathis (1990) which is itself based on average relations from multiple photometric systems. The range of values for the near infrared extinction laws considered by Mathis result in a difference of about 0.15 mag for the lines shown in Figure 4 at 2.0 mag. There is a trend for the OSIRIS colors to be too red in evident in Figure 4 which is in agreement with expectations as noted above. If we were to apply the same transformation to the band colors as for the CTIO facility IR imager CIRIM (Elston et al., 1997) which has similar filters and detector as OSIRIS, then the effect would be for the reddened main sequence of the cluster to more closely match the lower reddening line in Figure 4 and for the stars with excess to lie even further below the line. The correction would be about 0.2 mag in for the red stars like W31 #1 in Figure 4. This suggests that the magnitude of the undetermined color transformation to put OSIRIS magnitudes on the CIT/CTIO system is consistent with a negligible correction for .
We will therefore assume that the colors of OSIRIS are the same as for the CIT/CTIO system and compute estimates of the extinction based on alone and the Mathis interstellar extinction law. Table 1 lists the photometry and derived for the four O-type stars presented in this paper. The mean extinction toward these four objects is 1.71 mag 0.12 mag where the uncertainty is the standard deviation in the mean. We add to this value (in quadrature) 0.15 mag due to the expected range in the power–law exponent of the Mathis (1990) extinction law ( 0.1 in the exponent).
4 DISCUSSION
W31 hosts a complex mixture of newly formed stars, gas, and dust as Figure 2 attests. The spectra presented in §3 indicate that some of these newly formed stars are quite massive and also that massive stars are still forming, or at least have not yet shed their natal material and revealed their photospheres. In the following sections we discuss these spectra and the stellar and young stellar content in more detail, establishing the basic properties of the W31 cluster.
4.1 Distance
As mentioned in §1, the distance (and hence luminosity) of W31 has not been well known. Wilson (1972) discusses the radio recombination line velocity for W31. The Galactic rotation model is degenerate for this case, but the absorption due to H2CO in intervening clouds is significantly higher than the H recombination line velocity indicating the absorption is not local and that the H II region is not at the near distance. Interestingly, Georgelin & Georgelin (1976) placed W31 at the far distance of 18.7 kpc; it is the most distant GHII region in their famous plot (their Figure 11) of Galactic structure, well beyond the Galactic center. On the other hand, the H2CO absorption does not extend to the maximum velocity on the line–of–sight, so only a minimum, intermediate distance, 4.1 0.7 kpc can be estimated from this method. Even this limit is quite uncertain as the H2CO may be affected by non–circular velocities.
We can now constrain the distance to W31 using the spectroscopic and photometric results of §3. We compute distances assuming the O stars shown in Figure 5 are ZAMS or dwarf luminosity class (i.e. hydrogen burning). The results of the following sections firmly demonstrate that W31 is a very young cluster; hence, we will not consider the O stars to be evolved giants for which ages would be between about 2.5 and 5 Myr (Schaller et al., 1992). The near infrared spectra of the O–stars are also not consistent with those of supergiants (§3.2.1). The spectral type in each case is assumed to be O5.5V, consistent with the infrared type assigned above, and only the luminosity is varied. For the ZAMS case, the is taken from Paper II. For the dwarf case, the distance is determined using the given by Vacca et al. (1996) and from Koornneef (1983). In all cases the distance estimate uses the photometry and given in Table 1. The distance estimates are shown in Table 1 and result in mean distances of 3.1 0.3 kpc and 3.7 0.4 kpc for the ZAMS and dwarf cases, respectively. The uncertainty quoted for the mean distance is the standard deviation in the mean of the individual distances added in quadrature to the uncertainty in ( 250–350 pc).
The Wilson (1972) distance is a lower limit. Comparing this limit with the spectro–photometric estimates above, the radio limit is consistent (within one ) with the estimates using the dwarf or ZAMS luminosity. As mentioned above, we argue below that W31 is very young based on the presence of YSOs. Thus, we do not expect the O–type stars to be highly evolved and we can firmly constrain the distance to be within 3.1 and 3.7 kpc with the expectation that it may be at or near the ZAMS distance. We will adopt a mean distance of 3.4 kpc. Then, the region shown in Figure 1 is about 1.7 pc across, and that of the central cluster 0.6 pc.
4.2 Luminosity and Age
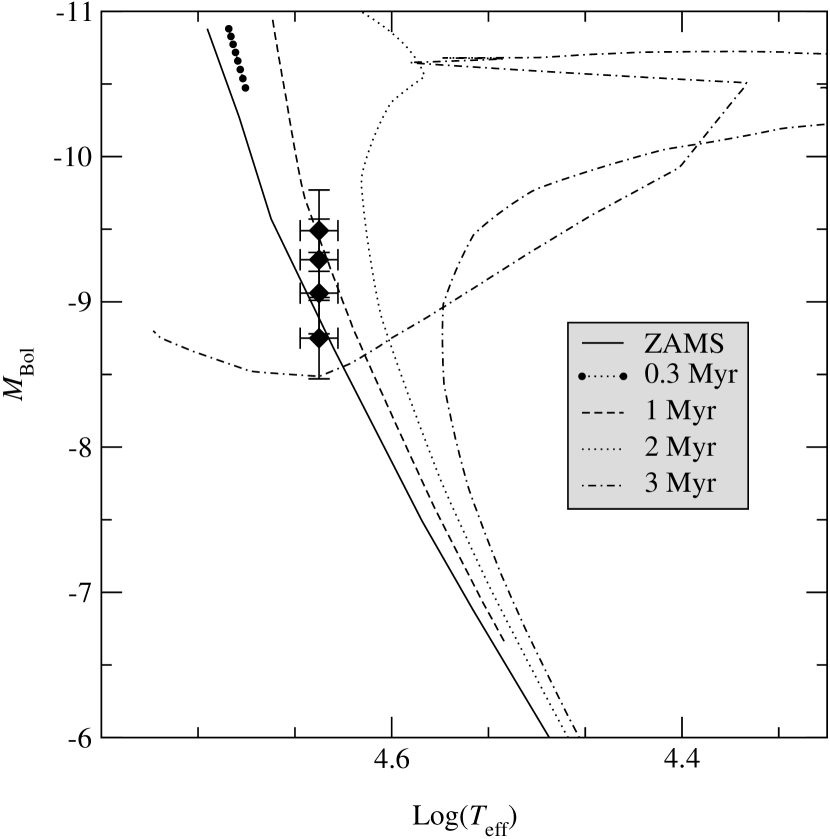
We can estimate the age of the O stars by placing them in the Hertzprung–Russell diagram (HRD). The average O star luminosity was set in the previous section by adopting the intrinsic luminosities consistent with the observed spectral types (the average of the ZAMS and dwarf cases) in order to derive the distance to the cluster. To place the individual stars in the HRD, we use this average distance (3.4 kpc), the bolometric correction vs. spectral type relationship given by Vacca et al. (1996), the photometry of Table 1, and the for O–type stars presented by Koornneef (1983). The result is shown in Figure 8. The uncertainty in is due to an assumed distance uncertainty of 0.3 kpc and the uncertainty in and as given in Table 1. The uncertainty is taken as the range in for the O5–O6 spectral types as tabulated by Vacca et al. (1996). The data points are compared to the model isochrones of Schaller et al. (1992). Figure 8 indicates that the W31 O–type stars are quite young, less than about one million years with a mean age of perhaps 500 thousand years.
The Lyman continuum (LyC) output of W31 cited by Smith et al. (1978) is 21050 sec-1 (for kpc). For a distance of 3.4 kpc to W31, this number becomes 1.41050 sec-1 (14 O star equivalents – Vacca et al. (1996)). The LyC output for a single O5.5V star, similar to what we observe, is 2.71049 sec-1. Thus, five such stars can account for the total ionizing radiation production estimated from radio measurements. For the distance of 3.4 kpc derived in the previous section, the average of the O stars is about 9.1 mag (Figure 8). This is about 0.2 mag fainter than the O5.5V luminosity, so the corresponding LyC value is also about 20 lower. If the O stars are truly on the ZAMS, then the distance, and hence average luminosity, is an additional 20 lower than the O5.5V value (i.e. 0.4 mag total). There is thus room for 59 O5.5 stars; i.e. we have found four hot stars which account for about 50 to 80 of the ionization indicated by radio emission (which does not account for destruction by dust or loss by leakage). Ghosh et al. (1989) and Woodward et al. (1984) presented 5 GHz maps of the W31 region. They suggested that many of the sources in their maps could be embedded young stars. Some of these objects may contribute to the ionization in W31, though in light of the smaller distance derived above, none of their sources is particularly luminous (their most luminous source overlapping with our images would be consistent with a O9 or B0 star). We further discuss below the Ghosh et al. (1989) sources in conjunction with near infrared excess emission objects presented in this paper.
4.3 Star Formation
In the midst of the complex gas and dust morphology evident in Figure 2, we have identified four luminous O–type stars. Figure 3 indicates there are more which are not yet spectroscopically confirmed. And more importantly, Figure 4 indicates there are a number of red objects which might be still dramatically affected by their natal dust clouds. These are the objects which appear offset to the red from the normal sequence of stars in Figure 4; see the object labeled #1 in the Figure. A clear excess emission (at least in ) is indicated by the offset. This excess is attributed to accretion luminosity in a circumstellar disk for lower mass YSOs (Meyer et al., 1997; Lada & Adams, 1992) or perhaps circumstellar envelopes in the case of Herbig Ae/Be (HAEBE) stars (Hartmann et al., 1993; Pezzuto et al., 1997). Lada & Adams (1992) identified lower mass objects in this region of the color–color plot as possible protostars. The protostars are distinguished from more evolved PMS stars by their location farther along the reddening line indicating extinction by more obscuring circumstellar material. Accounting for a foreground extinction as derived for the O–type stars in Table 1, then the YSO candidates in Figure 4 would lie near the lower end of the region identified by Lada & Adams (1992) as being populated by protostars. However, Lada & Adams (1992) did not attempt to account for foreground extinction in their YSO sample.
In Papers I & II, we identified similar YSO candidates in W43 and W42. These objects are likely massive stars in the process of shedding their birth material. Like the YSOs identified in M17 by Hanson et al. (1997), the objects in W43 and W42 may be of somewhat lower mass (based on their position in the CMD) than the more luminous spectroscopically identified O stars (perhaps late O–type or early B–type; see Hanson et al. (1997)). In M17, the more massive stars showed no evidence for circumstellar disks, but several later type stars did. An obvious question is whether the most massive stars formed disks at all, but the case in M17 is not conclusive because the stars with disk signatures are spatially segregated from the most massive O–type stars.
Several possibilities exist. All the massive stars are coeval, but the most massive either formed with no disks or the active disk phase was rapid and now beyond detection. Or, perhaps the later types simply formed later in a sequential mode. It is significant that the object W31 #1 is both spatially located in the heart of the cluster and more luminous at than any of the O–stars, unlike the suggestion of a spatial segregation of the stars with disks and without in M17.
In any event, the near infrared excess emission alone does not indicate the physical source of emission (e.g. from a disk or envelope), but it is a clear indication that this is a YSO. W31 #1 is more than 0.5 mag brighter at than any of the O stars listed in Table 1 indicating it is a massive YSO.
The spectrum of W31 #1 shown in Figure 6 shows no sign of photospheric hot–star features. Therefore, it does not allow us to determine whether it is a ZAMS late-O or early-B–star which has yet to clear away its remnant natal material (like a compact H II region) or perhaps a younger object just transitioning from an earlier proto–stellar phase. The Brackett series emission suggests an internal ionizing source (recall that background apertures, §2.2, have been used in an attempt to remove the nebular emission from the circumstellar emission). The connection between dense, hot molecular cores which might be massive protostars in a collapse or accretion phase and ultra compact H II (UCHII) regions which represent enshrouded but hydrogen burning objects (albeit very young) is the subject of intense recent study; see Kurtz et al. (2000) for a review. These objects probably form an evolutionary sequence (Kurtz et al., 2000) and the former are often sought by observations toward the latter. Figure 7 shows a detailed view of the band spectrum of W31 #1. There is both Brackett emission and Fe II emission present. Such permitted lines are indicative of dense flows or winds and require large amounts of UV photons and dense gas (106 cm-3), for example, in the massive evolved star Eta Carina (Hamann et al., 1994). The Fe II emission is narrow, and may also be consistent with dense material in a circumstellar disk.
Thus the emission–line spectrum of W31 #1 is consistent with the picture that a massive object lies hidden within a large amount of circumstellar material. This object would be sufficiently massive to produce a dense outflow/inflow and to produce sufficient ionizing photons to ionize the flow/wind. Massive protostars may remain “hidden” (i.e. they are not detected as UCHII) during the collapse/accretion phase because the mass infall rate is sufficient to arrest the development of an H II region around the ionizing protostar (Walmsley, 1995). Since we see evidence for ionized circumstellar material around W31 #1, this suggests it is not still in such an early proto–stellar phase. In this case we might expect W31 #1 to be associated with one of the radio sources reported by Ghosh et al. (1989); i.e. it would be an UCHII region. In Figure 9 we plot an overlay of the band image of Figure 1 with the positions of the Ghosh et al. (1989) radio sources (5 GHz sources from their Table 2). The Ghosh et al. (1989) 5 GHz beam was 7.5′′4.2′′ FWHM. As can be seen in the figure, there is a radio source near the position of W31 #1. This is radio source 23 from Ghosh et al. (1989), and it is about 4′′ from the near infrared position of W31 #1. Thus, W31 #1 is a candidate UCHII region.
W31 #1 is not the only YSO candidate in the cluster; in fact, it is one of five bright objects in the excess region of the color–color plot (Figure 4). Each of these objects (W31 #1, 9, 15, 26, 30) is in the bright end of the vs. CMD, so is potentially massive (see Table 2). They all appear to be forming in the central region of the cluster where massive stars may be preferentially expected; see, for example, Hillenbrand & Hartmann (1998). These objects are indicated in Figure 1 with open circles. The position of W31 #26 is consistent with the 5 GHz radio source 21 of Ghosh et al. (1989). This is the brightest of the Ghosh et al. sources in our field (and one of the brightest in their entire list).
In Figure 9, we plot the positions of the remaining Ghosh et al. radio sources as well as their radio sources 21 and 23 discussed above. We searched our near infrared source list for candidate matching objects to each of the remaining Ghosh sources. We have identified the reddest object within the radio FWHM as a possible candidate and show the results in Table 3. We have identified a potential radio counterpart in all cases except for Ghosh radio source 15. Though there is no spectroscopic information for these sources, we suggest that they may also be UCHII regions based on their infrared colors and likely conincidence with the 5 GHz radio sources. All the candidate counterparts identified in Table 3 are sufficiently red that they have no band detections (except for radio sources 21 and 23 as discussed above). Since the radio sources are relatively bright at , the lack of band detections suggests they also exhibit excess emission, though we can’t prove it. Radio source 15 has no obvious counterpart on the band image. If the radio source represents an embedded object, then it is still too buried to be seen at shorter wavelengths and may represent the most recent, on–going, star birth in the W31 cluster. The last three candidates in Table 3 may be too faint to be associated with the radio sources, as the implied magnitudes are inconsistent with an interpretation as early B–type stars. If so, the true sources may still be buried and invisible at near infrared wavelengths, for example, as are the “western” UCHII regions in W49 – (Smith et al., 2000).
We have tabulated the Lyman continuum luminosity for each of the Ghosh et al. (1989) sources in our field in Table 3. These values have been corrected for the distance derived above, and so are somewhat less luminous than reported by Ghosh et al. (1989). We also tabulate spectral types based on these values using the derived properties of dwarf OB stars from Vacca et al. (1996). Most are about B0. Could W31 #1 harbor such an embedded source? If we assume the excess emission from W31 #1 is due to reprocessing of the stellar radiation by a circumstellar disk, we can estimate its intrinsic stellar luminosity. Using the tabulation of Hillenbrand et al. (1992) for reprocessed radiation from a flat circumstellar disk, we find that 3.71 mag and mag. This is the maximum luminosity that such a reprocessing disk may produce and assumes that the disk is viewed along the line of sight (it is seen along an axis perpendicular to the plane of the disk) and extends to the stellar surface (there is no hole in the disk).
Adjusting the observed magnitudes for this putative disk, we find that the would be 2.9 mag for the Mathis (1990) extinction law. This results in an intrinsic magnitude which is 1.71 mag fainter than the O stars in W31, equivalent to a B0.5 star (Paper II). This luminosity or spectral type estimate is consistent with the Ghosh et al. (1989) estimate from the radio continuum observations; see Table 9. Such an object does not have a very hard ionizing continuum and so might also explain the lack of neutral helium emission in Figure 6. Low ratios () of He I to Br are expected for such stars (Blum & Damineli, 1999). Recall that one of the other YSO candidates, W31 #26, is associated with the brightest radio source in our field, radio source 21. An inclined circumstellar disk would explain why its apparent band excess is not as prevalent as that for W31 #1 (see Figure 3 and Table 9).
While illustrative, our model for the production of the near infrared excess in W31 #1 is not unique. We have not considered accretion luminosity contributing to the band emission or dust destruction of the ionizing radiation in the UCHII region, for example. We plan to make longer wavelength observations in the mid–infrared to further explore the nature of this object by expanding the wavelength baseline to better constrain the source of its circumstellar emission. In general, we envision a situation where the O–stars and most of the YSO candidates are revealed and are ionizing the nebula in W31. The majority of the Ghosh et al. sources, however, may be less evolved, optically thick, UCHII regions.
It is interesting to further speculate on the nature of the star birth history in W31. If the Ghosh et al. sources are indeed associated with the near infrared sources, then their radio luminosities (Table 3) indicate they are generally less massive than the spectroscopically identified O–stars. We then have a situation similar to what may have occured in M17 (Hanson et al., 1997) where the most massive stars are revealed first with the later type O and B stars taking longer to clear away their natal material (or being slower to form). In the present case, there may also be on–going star birth of somewhat less massive hot stars (the buried radio source 15 of Ghosh et al. (1989)). A further similarity to M17 is that the most massive O stars appear not to show obvious disk signatures, and the implication is that the active disk phase for the most massive O stars is shorter than for lower mass O and B stars or that these objects don’t form disks at all. In the present case we can not yet firmly place the YSO W31 #1 on a mass scale, but its near infrared and radio properties are consistent with an early B–type star surrounded by circumstellar material.
5 Summary
We have presented initial, yet detailed, observations of the stellar and young stellar content embedded in the giant H II region W31. Our , , and images reveal a dense stellar cluster in W31, including young stellar objects. band spectra are presented for five objects. Four of these are identified as early O–type by comparison to standard stars. The fifth and brightest cluster member at has near infrared colors which are similar to known young stellar objects. Strong excess band emission places it to the red of the normal stellar sequence in the vs. color–color plot. We find that the position of this object, W31 #1, is consistent with a 5 GHz thermal radio source and suggest it therefore may be an ultra compact H II region, though perhaps one with an early B–type exciting star. It has an and band spectrum devoid of photospheric lines, indicating it is still heavily enshrouded by circumstellar material. The Brackett lines are in emission. Its band spectrum exhibits permitted Fe II line emission which we suggest indicates a dense circumstellar environment, perhaps a strong inflow, outflow or circumstellar disk.
We identified four other YSO candidates based on photometry in the vs. color–color plot. These stars (which may also be massive as indicated by their band magnitudes) and W31 #1 are found in the heart of the W31 cluster among the O–type stars. We also identified a thermal radio source with one of these YSO candidates. Further, for the remaining 5 GHz sources in our field, we identified potential band counterparts with offsets less than the size of the FWHM of the radio observations (5′′). We suggest that these may be ultra compact H II regions representing the most recent massive star birth in the cluster.
Spectral types of the newly identified O–stars and the photometry presented herein firmly constrain the distance to W31 which was previously uncertain from radio observations. Based on the band spectra and presence of YSOs, we argued that the O–stars can not be highly evolved stars (i.e. giants or supergiants). We then computed distances assuming the O–star spectra were consistent with ZAMS or dwarf luminosity classes by taking the appropriate range of intrinsic luminosities for O–stars. We find the distance to W31 must be less than about 3.7 kpc which is consistent with the previous lower limit from radio studies. Shorter distances (about three kpc) would be inferred for the O–stars (but still consistent with the radio data within the uncertainties) if they are precisely on the ZAMS. The inferred age of the O–stars is about half a million years or less.
PSC appreciates continuing support from the National Science Foundation. AD thanks PRONEX and FAPESP for support. We appreciate the comments of an anonymous referee which have helped to improve our paper. We are grateful to S. Strom for useful conversations regarding young stellar objects.
References
- Blum et al. (1997) Blum, R.D., Ramond, T.M., Conti, P.S., Figer, D.F, & Sellgren, K. 1997, AJ, 113, 1855
- Blum & Damineli (1999) Blum, R.D., & Damineli, A. 1999 ApJ, 512, 237
- Blum et al. (1999) Blum, R.D., Damineli, A., & Conti, P.S. 1999, AJ, 117, 1392 (Paper I)
- Blum et al. (2000) Blum, R.D., Conti, P.S., & Damineli, A. 2000, AJ, 119, 1860 (Paper II)
- DePoy et al. (1993) DePoy, D. L., Atwood, B., Byard, P., Frogel, J. A., & O’Brien, T. 1993, in SPIE 1946, “Infrared Detectors and Instrumentation,” pg 667
- Elias et al. (1982) Elias, J. H., Frogel, J. A., Matthews, K., & Neugebauer, G. 1982, AJ, 87, 1029
- Elston et al. (1997) Elston, R., Elias, J. H., Gregory, B., & Blum, R. D. 1997, “Cerro Tololo Infrared Imager Manual,” http://www.ctio.noao.edu/instruments/ir_instruments/ir_instruments.html
- Frogel et al. (1977) Frogel, J. A., Persson, S. E., & Aaronson, M. 1977, ApJ, 213, 723
- Frogel et al. (1978) Frogel, J. A., Persson, S. E., Matthews, K., & Aaronson, M. 1978, ApJ, 220, 75
- Georgelin & Georgelin (1976) Georgelin, Y. M. & Georgelin, Y. P. 1976, A&A, 49, 57
- Ghosh et al. (1989) Gosh, S. K., Iyengar, K. V. K., Rengarajan, Tandon, S. N., Verma, R. P., Daniel, R. R., & Ho, P. T. P. 1989, ApJ347, 338
- Hamann et al. (1994) Hamann, F., DePoy, D. L., Johansson, S., & Elias, J. 1994, ApJ, 422, 626
- Hanson et al. (1996) Hanson, M. M., Conti, P. S., & Rieke, M. J. 1996, ApJS, 107 281
- Hanson et al. (1997) Hanson, M. M., Howarth, I.D., & Conti, P.S. 1997, ApJ, 489, 698
- Hanson et al. (1998) Hanson, M. M., Rieke, G., & Luhman K. L. 1998, AJ, 116 1915
- Hartmann et al. (1993) Hartmann, L., Kenyon, S. J., & Cavalet, N. 1993, ApJ, 407, 219
- Hillenbrand et al. (1992) Hillenbrand, L. A., Strom, S. E., Vrba, F. J., & Keene, J. 1992, ApJ, 397, 613
- Hillenbrand & Hartmann (1998) Hillenbrand, L. A. & Hartmann, L. W. 1998, ApJ, 492, 540
- Koornneef (1983) Koornneef, J. 1983, A&A, 128, 84
- Kurtz et al. (2000) Kurtz, S., Cesaroni, R., Churchwell, E., Hofner, P., Walmsley, M. 2000, in Protostars and Planets IV., eds Mannings, V., Boss, A. P., Russell, S. S. (Tucson:University of Arizona Press), p. 299
- Lada & Adams (1992) Lada, C. J. & Adams F. C. 1992, ApJ, 393, 278
- Mathis (1990) Mathis, J.S. 1990, ARA&A, 28, 37
- Meyer et al. (1997) Meyer, M. R., Calvet, N., & Hillenbrand, L. A. 1997, AJ, 114, 288
- Olivia & Origlia (1992) Olivia, E. & Origlia, L. 1992, A&A, 254, 466
- Pérez & Elston (1998) Pérez, G. & Elston, R. 1998, Proc. SPIE, 3352, 328
- Persson et al. (1998) Persson, S. E., Murphy, D. C., Krzeminski, W., & Roth, M. 1998, AJ, 116, 2475
- Pezzuto et al. (1997) Pezzuto, S., Strafella, F., Lorenzetti, D. 1997, ApJ, 485, 290
- Reid (1993) Reid, M. J. 1993, ARA&A, 31, 345
- Schaller et al. (1992) Schaller G., Schaerer D., Meynet G., Maeder A., 1992, A&AS, 96, 269
- Schecter et al. (1993) Schecter, P. L., Mateo, M. L., & Saha, A. 1993, PASP, 105, 1342
- Skrutskie et al. (1996) Skrutskie, M. F., Meyer, M. R., Whalen, D., & Hamilton C. 1996, AJ, 112, 2168
- Smith et al. (1978) Smith, L.F., Biermann, P. & Mezger, P.G. 1978, A&A, 66, 65
- Smith et al. (2000) Smith, N., Jackson, J.M., Kraemer, K.E., Deutsch, L.K., Bolatto, A., Hora, J.L., Fazioi. G., Hoffmann, W.F., & Dayal, A. 2000, ApJ, 540, 316
- Vacca et al. (1996) Vacca, W. D., Garmany, C. D., & Shull, J. M. 1996, ApJ, 460, 914
- Walmsley (1995) Walmsley, M. 1995, in Circumstellar Disks, Outflows, and Star Formation, Revista Mexicana de Astronomía y Astrofísica serie de confrencias, Vol. 1, eds Lizano, S. & Torrelles, J. M. (México:Universidad Nacional Autónoma de México), p. 137
- Wilson (1972) Wilson, T. L. 1970, A&A, 19, 354
- Woodward et al. (1984) Woodward, C. E., Helfer, H. L., and Pipher, J. L. 1984, MNRAS, 209, 209


| ID | aaUncertainty in photometry is the sum in quadrature of the photometric uncertainty plus the PSF fitting uncertainty; see §2. | aaUncertainty in photometry is the sum in quadrature of the photometric uncertainty plus the PSF fitting uncertainty; see §2. | bbThe uncertainty in is dominated by the variation in the power–law exponent of the Mathis (1990) interstellar extinction law; see §3.3. The uncertainty in mean is the sum in quadrature of the standard deviation in the mean plus the (0.15 mag) systematic uncertainty due to the extinction law. | ccDistance estimates assuming mean ZAMS and dwarf (V) luminosities; see text. The uncertainty in the distance is taken as the sum in quadrature of the standard deviation in the mean of the individual estimates plus a component ( 250–500 pc) due to the systematic uncertainty in . | (kpc) ccDistance estimates assuming mean ZAMS and dwarf (V) luminosities; see text. The uncertainty in the distance is taken as the sum in quadrature of the standard deviation in the mean of the individual estimates plus a component ( 250–500 pc) due to the systematic uncertainty in . |
|---|---|---|---|---|---|
| W31 #2 | 10.020.02 | 1.160.03 | 1.820.16 | 2.6 | 3.1 |
| W31 #3 | 10.300.02 | 1.060.03 | 1.670.16 | 3.2 | 3.8 |
| W31 #4 | 10.340.02 | 0.880.03 | 1.400.16 | 3.7 | 4.4 |
| W31 #5 | 10.370.03 | 1.260.04 | 1.970.16 | 2.9 | 3.4 |
| Average | 1.710.19 | 3.10.3 | 3.70.4 |
| ID | aaUncertainty in photometry is the sum in quadrature of the photometric uncertainty plus the PSF fitting uncertainty; see §2. | aaUncertainty in photometry is the sum in quadrature of the photometric uncertainty plus the PSF fitting uncertainty; see §2. | aaUncertainty in photometry is the sum in quadrature of the photometric uncertainty plus the PSF fitting uncertainty; see §2. |
|---|---|---|---|
| W31 #1 | 9.47 0.03 | 2.420.03 | 3.450.04 |
| W31 #9 | 10.690.02 | 2.760.03 | 4.080.05 |
| W31 #15 | 11.040.02 | 2.730.03 | 4.000.06 |
| W31 #26 | 11.510.03 | 2.720.04 | 4.310.15 |
| W31 #30 | 11.850.02 | 2.560.03 | 3.680.08 |
| ID | Ghosh ID aaGhosh et al. (1989) 5 GHz source ID (their Table 2) | bbUncertainty in photometry is the sum in quadrature of the photometric uncertainty plus the PSF fitting uncertainty; see §2. | bbUncertainty in photometry is the sum in quadrature of the photometric uncertainty plus the PSF fitting uncertainty; see §2. | bbUncertainty in photometry is the sum in quadrature of the photometric uncertainty plus the PSF fitting uncertainty; see §2. | Offset (′′) ccOffset in arcseconds of the Ghosh et al. (1989) 5 GHz radio source from the nearest red infrared source of this paper | Log(Q∘) ddLyman continuum luminosity from Ghosh et al. (1989) but corrected for our new distance of 3.4 kpc. | Radio SpTyp eeSpectral type corresponding to the Lyman continuum as derived by Vacca et al. (1996) |
|---|---|---|---|---|---|---|---|
| W31 #1 | 23 | 9.47 0.03 | 2.42 0.03 | 3.45 0.04 | 4.3 | 47.77 | B0.5 |
| W31 #25 | 24 | 11.50 0.03 | 3.02 0.04 | 1.9 | 48.08 | B0 | |
| W31 #26 | 21 | 11.51 0.03 | 2.73 0.04 | 4.31 0.15 | 3.0 | 48.29 | O9.5 |
| W31 #34 | 25 | 12.01 0.05 | 2.48 0.06 | 5.3 | 47.72 | B1 | |
| W31 #56 | 16 | 12.76 0.02 | 2.99 0.03 | 5.6 | 48.11 | B0 | |
| W31 #90 | 19 | 13.64 0.02 | 4.01 0.09 | 3.6 | 47.50 | ||
| W31 #165 | 17 | 14.52 0.03 | 2.41 0.06 | 3.9 | 47.84 | B0.5 | |
| W31 #169 | 22 | 14.57 0.04 | 1.67 0.05 | 4.3 | 48.00 | B0 | |
| W31 #251 | 14 | 15.08 0.05 | 1.99 0.07 | 2.7 | 48.07 | B0 | |
| 15 |