11email: ngrosso@xray.mpe.mpg.de
…
ROSAT-HRI detection of the Class I protostar YLW16A
in the Ophiuchi dark cloud
I analyze unpublished or partially published archival ROSAT data of the Ophiuchi dark cloud. This set of seven overlapping ROSAT HRI pointings, composed of eight one-hour exposures, detects mainly the X-ray brightest T Tauri stars of this star-forming region. Only two HRI sources are new X-ray sources, and their optical counterparts are proposed as new Weak T Tauri star candidates. Meanwhile the ROSAT HRI caught during just one exposure a weak X-ray source (=10; 4.1 for Gaussian statistics) among a group of three embedded young stellar objects including two Class I protostars. Previous ROSAT PSPC, ASCA GIS observations, and as I argue here one Einstein IPC observation, have already detected an X-ray source in this area, but this higher angular resolution data show clearly that X-rays are emitted by the Class I protostar YLW16A. This is the second Class I protostar detected by the ROSAT HRI in this dark cloud. The determination of the intrinsic X-ray luminosity of this event, [0.1–2.4 keV]=(9.4–450) erg s-1, critically depends on the source absorption estimate. Improvements will be obtained only by the direct determination of this parameter from fitting of Chandra and XMM-Newton spectra.
Key Words.:
Open clusters and association: Oph – Stars: pre-main sequence – X-rays: stars – infrared: stars1 Introduction
As in the 80’s the Einstein X-ray observatory discovered the high X-ray variability of low-mass pre-main sequence stars, called T Tauri stars, the ROSAT satellite reported in the 90’s the first clues of the X-ray activity of younger stellar objects ( yr), called Class I protostars (Feigelson & Montmerle (1999)). Class I protostars (Lada (1991)) are composite objects including a central forming star surrounded by an accretion disk 10–100 AU in radius, and embedded in an extended infalling remnant envelope of gas and dust up to AU in size (Shu et al. (1987)). Using the Position Sensitive Proportional Counter (PSPC), Casanova et al. (1995) reported in the $ρ$~Ophiuchi star-forming region (145 pc; de Zeeuw et al. (1999)) the detection of seven X-ray sources coinciding with Class I protostars, but possible faint non-protostellar counterparts were also found in the same error boxes. The ASCA satellite detected more clearly a group of five Class I protostars in the R~CrA star-forming region (130 pc), but the positional uncertainties was quite large (), and the individual source only partially resolved (Koyama et al. (1996)). In both cases ROSAT, with its High Resolution Imager (HRI) providing a much better spatial resolution (FWHM5″), has helped to confirm these detections (Grosso et al. (1997), hereafter paper I; Neuhäuser & Preibisch (1997)). With the goal of preparing the upcoming study of these two star-forming regions with the new generation of X-ray satellites, Chandra and XMM-Newton, their ROSAT observations must be definitively exploited. This work was already done by Neuhäuser & Preibisch (1997) on R CrA. I study here the unpublished or partially published observations of the Ophiuchi dark cloud to search for X-rays from Class I protostars.
| ROSAT | Proposal name | PI name | Exp. | Start | End | Ref. | Segment | ||
|---|---|---|---|---|---|---|---|---|---|
| archive | [ks] | [yymmdd] | [yymmdd] | 16h | -24∘ | # | |||
| 200045p-0 | Oph Core | Montmerle | 12.9 | 910305 | 913010 | 26m310 | 31′48′′ | (1) | |
| 200045p-1 | Oph Core | Montmerle | 19.9 | 910908 | 910908 | 26m310 | 31′48′′ | (1) | |
| 201709h | SR9, SR12 | Damiani | 3.3 | 940829 | 940829 | 27m281 | 31′48′′ | (2) | 1 |
| 201710h | SR9, SR12 | Damiani | 5.2 | 940831 | 940831 | 27m281 | 31′48′′ | (2) | 2 |
| 201711h | SR9, SR12 | Damiani | 2.7 | 940901 | 940901 | 27m281 | 31′48′′ | (2) | 3 |
| 201712h | SR9, SR12 | Damiani | 5.1 | 940903 | 940903 | 27m281 | 31′48′′ | (2) | 4 |
| 201713h | SR9, SR12 | Damiani | 8.1 | 940904 | 940904 | 27m281 | 31′48′′ | (2) | 5 |
| 201714h | SR9, SR12 | Damiani | 3.7 | 940905 | 940905 | 27m281 | 31′48′′ | (2) | 6 |
| 201618h-1 | ROX20 | Zinnecker | 1.9 | 940917 | 940917 | 27m140 | 51′36′′ | 7 | |
| 201834h | Oph Core F | Montmerle | 12.6 | 950309 | 950314 | 27m260 | 40′48′′ | (3, 4) | |
| 201618h-2 | ROX20 | Zinnecker | 3.6 | 950817 | 950817 | 27m140 | 51′36′′ | 8 | |
| 201834h-1 | Oph Core F | Montmerle | 27.8 | 950818 | 950820 | 27m260 | 40′48′′ | (3, 4) | |
| 201835h | Oph Core A | Montmerle | 51.7 | 950829 | 950912 | 26m020 | 23′24′′ | (4) | |
| 201834h-2 | Oph Core F | Montmerle | 37.5 | 960907 | 960911 | 27m260 | 40′48′′ | (4) |
2 ROSAT observations
I found in the ROSAT archive that ten overlapping pointings were performed on the Ophiuchi dark cloud: one with the PSPC and nine with the HRI (see Table 1 for the log of these observations). Among these HRI pointings a sequence of six short exposures ( hour) spreaded over one week, was used by Damiani et al. (1996) to study the X-ray variability of the T Tauri stars SR9 and SR12A-B. One more HRI pointing remains without published results. I thus analyzed these data (8 segments in all; see Table 1) with EXSAS (Zimmermann et al. (1997)).
Source detection was performed on each segment separately with the standard command DETECT/SOURCES, which generates a local source detection by a sliding-window technique followed by a maximum likelihood test, which compares the observed count distribution to a model of the point spread function and the local background to discriminate sources from statistical Poissonian background fluctuations. The likelihood of existence, defined as = (with the probability of the null hypothesis that the observed distribution of counts is only due to a statistical background fluctuation), provides a maximum likelihood measure for the source detection. I accepted only detections with 10 (4.1 for Gaussian statistics) to reduce the number of spurious detections per field to 0.7–1.0. Identification of these X-ray sources was made by cross-correlation with published list of confirmed or suspected cloud members (e.g. André & Montmerle (1994)), IR surveys (e.g. Barsony et al. (1997)), and optical catalogue (Monet et al. (1996)). To correct X-ray positions for boresight errors, I selected the X-ray sources not associated with protostars having a positional error lower than both in and , and compared their positions with their IR counterparts in the 2MASS catalogue (second incremental release; Cutri et al. (2000)); the mean offsets in and was then substracted to the X-ray positions of all X-ray sources, and the residual dispersion was quadratically added to the positional errors. Table 2 gives the X-ray source list.
| Source | IR | # | count rate | ||
|---|---|---|---|---|---|
| Name | Cl. | 16h [] | [cts ks-1] | ||
| (1) | (2) | (3) (4) (5) | (6) | (7) | (8) |
| 1589441 | III? | 26m045 -24°57′50″ 5 | 8 | 54.1 | |
| SR24N | II | 26m583 -24°45′32″ 3 | 7 | 10.8 | |
| 8 | 13.3 | ||||
| GY194 | III | 27m048 -24°42′18″ 5 | 7 | 10.1 | |
| ROXs20B | III | 27m151 -24°51′40″ 3 | 7 | 18.5 | |
| 8 | 38.0 | ||||
| SR12A-B | III | 27m197 -24°41′39″ 2 | 1 | 143.2 | |
| 2 | 123.0 | ||||
| 3 | 138.6 | ||||
| 4 | 128.2 | ||||
| 5 | 2150.2 | ||||
| 6 | 90.5 | ||||
| 7 | 42.9 | ||||
| 8 | 162.3 | ||||
| YLW16A | I | 27m280 -24°39′38″ 4 | 6 | 10.0 | |
| 1614157 | III? | 27m325 -25°06′16″ 6 | 7 | 21.3 | |
| 8 | 20.8 | ||||
| GY292 | II | 27m331 -24°41′20″ 5 | 2 | 11.8 | |
| 4 | 10.7 | ||||
| IRS49 | II | 27m382 -24°36′58″ 3 | 6 | 10.3 | |
| SR9 | II | 27m404 -24°22′01″ 3 | 1 | 244.9 | |
| 2 | 582.6 | ||||
| 3 | 237.5 | ||||
| 4 | 572.2 | ||||
| 5 | 1012.7 | ||||
| 6 | 367.0 | ||||
| ROXs31 | III | 27m522 -24°40′53″ 3 | 1 | 19.5 | |
| 5 | 29.8 | ||||
| 6 | 42.1 | ||||
| SR20 | III | 28m330 -24°22′55″ 9 | 1 | 12.0 | |
| SR13 | II | 28m455 -24°28′22″ 5 | 1 | 33.7 | |
| 2 | 18.9 | ||||
| 3 | 11.2 | ||||
| 4 | 96.2 | ||||
| 5 | 66.4 | ||||
| 6 | 26.2 |

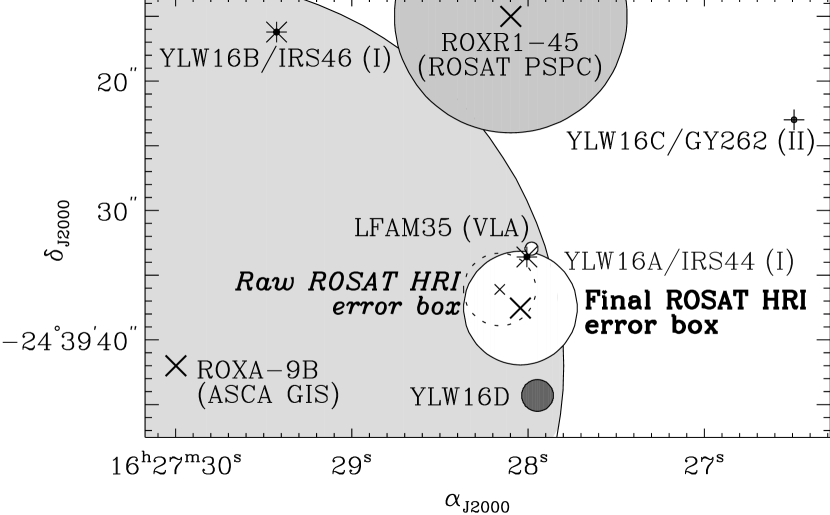
These short exposures detected mainly the X-ray brightest T Tauri stars of this star-forming region. Only two HRI sources are new X-ray sources. They are located 25 south (1 pc) of the core E/F (Loren et al. (1990)) and identified with optical stars11111589441 (=14.8, =12.6); 11614157 (=17.9, =14.1).: they are reliable Weak T Tauri star candidates. Meanwhile a weak HRI source (=10), detected just in segment 8, is associated with the IRAS source YLW16 – a group of two Class I protostars (YLW16A; and YLW16B, also called IRS46) and one embedded Classical T Tauri star (GY262). In order to discuss the possible identification of this weak HRI source with protostars, Fig. 1 visualizes the different members of YLW16 in the 2MASS reference frame, to be consistent with my previous astrometric correction. The 2MASS position of YLW16A is within the -radius error circle of the HRI source. Using a Monte-Carlo simulation, I found that the probability that this identification is only due to chance is . This reliable identification strenghtens the significance level of this weak HRI detection.
As shown in Fig. 1, other instruments detected also an X-ray source in this area. The ROSAT PSPC source ROXR1-45 (Casanova et al. (1995)) was identified with YLW16. The ASCA GIS source ROXA-9B (Kamata et al. (1997)) was only identified with YLW16B, whereas YLW16A is also in the ASCA GIS positional error box as mentioned by Carkner et al. (1998); moreover the new IR source discovered by Lucas & Roche (1998), YLW16D, is in the same error box. An ASCA follow-up observation, made 3.5 years after, did not detect again ROXA-9B (Tsuboi et al. 1997): this X-ray source is variable. I noted also in only one of the Einstein IPC observations of Montmerle et al. (1983; see observation I3749.2 Fig. 1.2) an X-ray emission around YLW16, blended with the Einstein X-ray sources associated with SR12 (ROX21) and GY292 (ROX25), which was not in the Montmerle et al.’s detection list. To solve this point, I took from HEASARC the archived screened photon event list222Sum of I3749.1 (8 March 1979), and I3749.2 (8 Sep. 1979)., and revisited it using the package XANADU/XIMAGE (also available at HEASARC). I selected only the 8 Sep. 1979 events and energy bins 3–13 (corresponding to 0.3–8.2 keV). From this event list, I studied the X-ray source standing near YLW16 with the interactive command sosta, which allows to estimate the background from a nearby area free of sources, and to tune the source box size to exclude events from neighbouring sources. I found for this source a signal to noise ratio 3.5 , and a corrected intensity 0.02 cts s-1. Fig. 2 shows a contour map constructed from these data. I conclude that the Einstein IPC also detected X-rays from YLW16 (which was not yet discovered from IR at this time), but the Einstein IPC FWHM (1′) is too large to find unambiguously the IR counterpart. By contrast to these previous detections with other X-ray instruments, we can see clearly in Fig. 1, thanks to the better angular resolution of the HRI, that the X-ray emission detected by the ROSAT HRI comes only from the Class I protostar YLW16A.
3 X-ray luminosity of YLW16A
YLW16A is the second Class I protostar detected by the HRI in the Ophiuchi dark cloud after YLW15 (paper I). It is remarkable to detect it with only an one-hour HRI exposure, whereas no detection was obtained with a 20 times longer HRI exposure (see Table 1; Grosso et al. (2000)). The fact that YLW16A was not detected by the HRI only one day before, with an exposure 2 times longer, implies a variation of its X-ray luminosity by at least a factor 2 in less than one day. This suggests that YLW16A was detected during a state of higher X-ray luminosity, probably due to an X-ray flare, usual in young stellar objects (see Feigelson & Montmerle 1999). However the source X-ray variability cannot be tested (e.g. with the Kolmogorov-Smirnov test) with only cts detected during this short exposure. It is impossible to deduce from this HRI detection whether the previous X-ray observations by other instruments actually detected YLW16A, as this X-ray source is not constant.
The determination of the intrinsic X-ray luminosities of such embedded young stellar object critically depends on the absorption of the X-ray photons by the gas along the line of sight, , combination of both the circumstellar material and the interstellar medium. As the HRI has no spectral resolution, no direct information on can be provided by the X-ray event. I thus derive from the source visual extinction due to the dust, , assuming the conversion factor =2.2310 mag cm-2 (Ryter (1996)). Applying the methods used in paper I, I find from near-IR: =30–40, and thus =(6.7–8.9) cm-2. For comparison if I assume that ASCA observed the same source, I have directly from the ASCA spectrum (the only one with enough statistics): =2.8 cm-2, corresponding to =13. Such extinction discrepancies between near-IR and X-ray estimates are not unusual for Class I protostars, but are not well understood (see Kamata et al. (1997)), and thus this low value of cannot be excluded. Taking the range =(2.8–8.9) cm-2 for the absorption, a distance of 145 pc, an isothermal Raymond-Smith plasma spectrum with a typical protostar flare temperature =4 keV, standard solar elemental abundances, I find using W3PIMMS (see HEASARC homepage): [0.1–2.4 keV]=(9.4–450) erg s-1 (for comparison 13; Wilking et al. (1989)), i.e. a factor of uncertainties remains in the X-ray luminosity of this events. Nevertheless, this X-ray luminosity is comparable to the one observed during the X-ray triple flare detected from YLW15 by ASCA (Tsuboi et al. (2000)).
Improvements of such studies will come from the Chandra and XMM-Newton observations, which will give unambiguous X-ray spectra of YLW16A, and thus will provide an accurate value of to constrain the X-ray luminosity observed by the HRI.
Acknowledgements.
I thank the anonymous referee for valuable comments, and T. Montmerle for discussions about his pioneering work with the Einstein observatory. I would like also to thank my host institution, and particularly Prof. J. Trümper and R. Neuhäuser, who have welcomed me for my Marie Curie Individual fellowship supported by the European Union (HPMF-CT-1999-00228).References
- André & Montmerle (1994) André, P. & Montmerle, T. 1994, ApJ 420, 837
- Barsony et al. (1997) Barsony, M., Kenyon, S. J., Lada, E. A., & Teuben, P. J. 1997, ApJS 112, 109
- Bouvier & Appenzeller (1992) Bouvier, J. & Appenzeller, I., 1992, A&AS 92, 481
- Carkner et al. (1998) Carkner, L., Kozak, J. A., & Feigelson, E. D. 1998, AJ 116, 1933
- Casanova et al. (1995) Casanova, S., Montmerle, T., Feigelson, E. D., & André, P. 1995, ApJ 439, 752
- Cutri et al. (2000) Cutri, R., Skrutskie, M.F., Van Dyk, S., et al. 2000, http://www.ipac.caltech.edu/2mass/releases/second/doc/explsup.html
- Damiani et al. (1996) Damiani, F., Micela, G. & Sciortino, S. 1996, in Röntgenstrahlung from the Universe, MPE Report 263, H.U. Zimmermann, J. Trümper, & H. Yorke (eds.), p. 27
- de Zeeuw et al. (1999) de Zeeuw, P. T., Hoogerwerf, R., De Bruijne, J. H. J., Brown, A. G. A. & Blaauw, A. 1999, AJ 117, 354
- Feigelson & Montmerle (1999) Feigelson, E.D. & Montmerle, T. 1999, ARAA 38, 363
- Greene & Young (1992) Greene, T.P. & Young, E.T., 1992, ApJ 395, 516 (GY)
- Grosso et al. (1997) Grosso, N., Montmerle, T., Feigelson, E. D., et al. 1997, Nat 387, 56 (paper I)
- Grosso et al. (2000) Grosso, N., Montmerle, T., Bontemps, S., André, P., & Feigelson, E. D. 2000, A&A 359, 113
- Kamata et al. (1997) Kamata, Y., Koyama, K., Tsuboi, Y., & Yamauchi, S. 1997, PASJ 49, 461
- Koyama et al. (1996) Koyama, K., Hamaguchi, K., Ueno, S., Kobayashi, N., & Feigelson, E. D. 1996, PASJ 48, L87
- Lada (1991) Lada, C. J. 1991, in The Physics of Star Formation and Early Stellar Evolution, NATO ASI, C.J. Lada & N.D. Kylafis (eds.), Kluwer, p. 329
- Leous et al. (1991) Leous, J. A., Feigelson, E. D., André, P., & Montmerle, T. 1991, ApJ 379, 683
- Loren et al. (1990) Loren, R. B., Wootten, A., & Wilking, B. A. 1990, ApJ 365, 269
- Lucas & Roche (1998) Lucas, P. W. & Roche, P. F. 1998, MNRAS 299, 699
- Monet et al. (1996) Monet, D., et al., 1996, USNO-SA1.0 catalogue, U.S. Naval Observatory, Washington DC
- Montmerle et al. (1983) Montmerle, T., Koch-Miramond, L., Falgarone, E., & Grindlay, J. E. 1983, ApJ 269, 182
- Neuhäuser & Preibisch (1997) Neuhäuser, R. & Preibisch, T. 1997, A&A 322, L37
- Ryter (1996) Ryter, C. 1996, Ap&SS 236, 285
- Shu et al. (1987) Shu, F. H., Adams, F. C., & Lizano, S. 1987, ARAA 25, 23
- Struve & Rudkjöbing (1949) Struve, O. & Rudkjöbing, M., 1949, ApJ 109, 92
- Tsuboi et al. (2000) Tsuboi, Y., Imanishi, K., Koyama, K., Grosso, N., & Montmerle, T. 2000, ApJ 532, 1089
- Wilking et al. (1989) Wilking, B.A., Lada, C.J., & Young, E.T., 1989, ApJ 340, 823
- Young et al. (1986) Young, E.T., Lada, C.J., & Wilking, B.A., 1986, ApJ 340, 823
- Zimmermann et al. (1997) Zimmermann, H.U., Böse, G., Becker, W., et al., 1997, EXSAS User’s Guide, ROSAT SDC, Garching