The radio source counts at 15 GHz and their implications for cm-wave CMB imaging
Abstract
We present the preliminary results of a new survey of radio sources using the Ryle Telescope at 15.2 GHz. This is the highest frequency at which a survey has been done that is relevant to the issue of radio source contamination in CMB experiments. The differential source count of the 66 sources found in 63 deg2 is 80, from 20 mJy to 500 mJy. Extrapolating this to 34 GHz (where many cm-wave CMB experiments operate) gives an estimated temperature contribution of sources = 9K in a CMB image, with a beam corresponding to multipole 500. A means of source subtraction is evidently necessary, otherwise the signal-to-noise ratio in CMB images will be limited to 4 or 5, becoming worse at higher resolution. We compare the population of sources observed in this new survey to that predicted by extrapolation from lower frequency surveys, finding that source fluxes, and indeed the existence of many sources, cannot be determined by extrapolation.
keywords:
cosmic microwave background – surveys – radio continuum: galaxies1 Introduction
A fundamental limitation to all measurements of primordial Cosmic Microwave Background (CMB) anisotropies is that set by astronomical foregrounds, both from the Galaxy and from extragalactic sources. The degree to which extragalactic radio sources contaminate is dependent on both the resolution and observing frequency of a particular experiment. For example, owing to relatively low collecting area and angular resolution, the results [1992] are essentially unaffected by extragalactic sources. Yet as the new generation of CMB experiments come on-line and strive to reach higher resolution and sensitivity, foreground sources are becoming an increasingly important consideration.
This can be seen simply by considering the Rayleigh–Jeans approximation for the flux density of an unresolved source as a function of the angular resolution, , of an experiment:
| (1) |
where is the source flux density, is the Boltzmann constant, is the beam solid angle, the observing wavelength and is the resulting antenna temperature. Expressing this in terms of multipole index (where for high ) we see that the temperature contribution of a source increases as :
| (2) |
Since sources are distributed randomly on the sky, the power spectrum of point sources also increases as . The correct removal of point sources therefore becomes more important as the CMB power spectrum is investigated on smaller angular scales, a regime in which there is even greater interest since the recent Boomerang [2000] and MAXIMA [2000] results.
The removal of foreground sources, however, is not trivial. They are known to have a wide range of spectral indices. At low frequencies, their spectral indices (with ) are usually steep (), but some are flat ( = 0) or may even be rising. Very occasionally, a spectrum may rise so steeply that it mimics that of the CMB with = 2 [1998].
The secure method of determining the point sources present in a CMB observation is to map at high resolution. CMB experiments, however, operate at frequencies ( 30 GHz) where the population of point sources is not well characterised. Indeed, until the present results, there existed no suitable high-frequency survey above 4.8 GHz [1991]. Windhorst et al. [1993] provide counts at 8.4 GHz of the sub-mJy source population, but these are too faint to affect primordial CMB studies. They also plot the 10.0-GHz data of Aizu et al. [1987], spanning 30–3000 mJy. However, as Aizu et al. state, their 10.0-GHz observations only include sources selected at 5 GHz and do not represent an independent survey. Theoretical predictions of the extragalactic source counts at a wide range of frequencies have also been made [1998], but observations at relevant frequencies are still needed to confirm the results. Furthermore, although source counts enable one to predict the point source contribution to a measured CMB power spectrum, this is helpful only if the source contribution is small compared with the CMB power. In general, finding the sources with high-resolution imaging is necessary.
In this paper we present the preliminary results of a source survey at 15 GHz that is part of the source-subtraction strategy for a new CMB interferometer, the Very Small Array (VSA, see Jones & Scott 1998). This is the highest frequency at which a survey has been undertaken that is relevant to the issue of radio-source contamination in cm-wavelength CMB experiments. The spectra and number count of the sources are discussed, as are the implications for the removal of extragalactic sources from CMB measurements. We stress that the temperature confusion estimates presented here apply to images of the CMB; we shall present estimates of the effects of sources on the CMB power spectrum in a subsequent paper.
2 Source Subtraction for the VSA
and the first 15-GHz survey
The VSA is a close-packed, 14-element interferometer for sensitive measurement of CMB anisotropies. In its compact configuration the VSA will measure the CMB power spectrum in the -range 120–700, whilst in its extended array it will reach = 1800. The telescope is currently operating at 34.1 GHz and we expect extragalactic radio sources to be a major contaminant in VSA observations. We have developed a strategy to deal with this problem in two steps.
First, we use low-frequency surveys, NVSS at 1.4 GHz [1998] and Green Bank at 4.8 GHz [1991], to select CMB fields in which there are predicted to be no sources brighter than 500 mJy at 34 GHz. Predictions are made by extrapolating the fluxes of every source in the 4.8-GHz catalogue to 34 GHz on the basis of its spectrum between 1.4 and 4.8 GHz. The VSA fields are also selected to be as free as possible of other Galactic and extragalactic foregrounds. In particular they have been chosen for high galactic latitude, low galactic synchrotron and free-free emission, low dust and putative dust, and a lack of nearby large-scale structure.
Having selected suitable fields, and prior to VSA observation, we locate potentially contaminating radio sources by mapping each VSA field at a much higher resolution than that of the VSA. This is achieved using the Ryle Telescope (RT) in Cambridge, operating at 15.2 GHz in a raster-scanning mode [2000]. We reach an rms noise level of = 4 mJy in order to identify all sources above 20 mJy at 15.2 GHz. Simultaneously with VSA observing, we then monitor the flux of each source using a separate single-baseline interferometer operating at the same frequency as the VSA. This interferometer uses two 3.7-m antennas located next to the VSA, using identical receivers and correlator to the main array. The monitoring is done simultaneously with VSA observations so that variable sources can be subtracted accurately.
3 Results and implications of the
15-GHz survey

The first VSA field, VSA1, covering an area of 63 deg2 and centred at 00h20m+ 30∘ (B1950), contains 66 sources with 20 mJy. The differential source count for this field is shown in Figure 1 and, between 20 and 500 mJy, is well fitted by
| (3) |
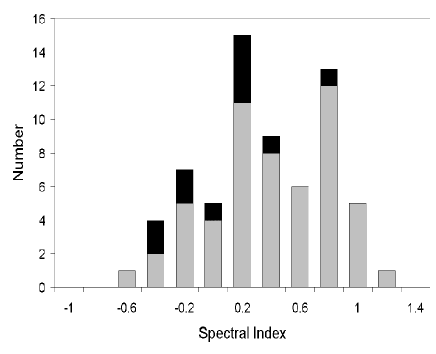
The spectral index distribution between 1.4 GHz and 15 GHz for all the sources found in our survey is shown in Figure 2. A significant fraction of these sources were not predicted to be seen at all; they have components with flat or rising spectra that only surface above 4.8 GHz. Note that in order to assign a spectral index to all the sources, we have had to use rather than since the Green Bank 4.8-GHz survey is far less deep than NVSS. A consequence of this is that is probably even steeper than for a few of the sources.
To estimate the effect of these sources on CMB images, we follow Scheuer [1957]:
| (4) |
where is the confusion noise in flux density from unsubtracted sources and is the flux density above which all sources have been subtracted. For =500 (typical of the VSA compact array and of other cm-wave experiments) and assuming a Gaussian distribution of baselines, giving a 43-arcmin beam. If source subtraction is attempted (i.e. 500 mJy, and we emphasize here that this VSA field has been pre-selected to avoid bright sources), then equation (4) predicts = 79 mJy at 15 GHz.
We now consider what might be at the VSA observing frequency of 34 GHz. Our educated guess of the mean spectral index between 15 and 34 GHz, given the change in source population from 4.8 to 15 GHz that we have found at these flux levels, is that = 0.5. This is less steep than the typical at low frequencies but reflects the increasing fraction of flat- and rising-spectrum sources at high frequency. Assuming this value of , we estimate at 34 GHz to be 52 mJy in a 43-arcmin beam corresponding to 500. Equation (1) then implies that the resulting temperature from unsubtracted sources, , is 9.2 K. This would limit the signal-to-noise ratio in CMB images to 4 or 5, and the problem becomes even worse at higher resolution. Source subtraction is evidently necessary.
By surveying for sources one can obviously decrease . If a survey reaches = 50 mJy at 15 GHz, then Equations (1) and (4) and the assumed = 0.5 give = 2.9 K at 34 GHz in a beam corresponding to 500. The fact that the RT survey reaches 20 mJy means that it will find all sources which have rising as steeply as 1. This is likely to include the majority of the source population. Sources with approaching 2, however, are known to exist (see e.g. Edge et al. 1998). An upper limit to the contribution of such sources can be found as follows. A source with = 2 and = 20 mJy will have = 103 mJy. If we assume that sources have = 2 and that is given by Equation (3), then the RT survey effectively has = 103 mJy at 34 GHz. This results in = 6.4 K in a beam corresponding to 500. The population will of course not be this extreme, and for VSA compact array maps is likely to be close to 3 K.

Finally, we consider the effect of source subtraction using only predicted source fluxes and positions extrapolated from low frequency surveys. Using this approach we expect to find 122 sources with a flux density greater than 20 mJy within our survey region of 63 deg2. We find, however, that only 55 of the predicted sources are actually found, the rest having spectra that fall off enough between 4.8 and 15 GHz to drop them below our flux limit. Furthermore, 11 sources were found in our survey which were not predicted by extrapolation. Five of the unpredicted sources do not even appear in the 4.8-GHz Green Bank catalogue. To find the residual source flux that would be left on an image if only predicted source fluxes had been subtracted, we calculate the modulus of the difference between predicted and observed flux for each source. Figure 3 shows the differential count of this residual flux; note that the remaining source contamination is somewhat worse than if no source subtraction had been attempted. Specifically, we find that substantial errors in individual source fluxes are made, both in over-predicting the fluxes of a large fraction of sources with down-curving spectra, and non-prediction of a significant fraction of sources with rising spectra. This result, however, is not unexpected. As we move to higher frequency regimes, we expect many more sources to be synchrotron-self-absorbed (SSA), exhibiting intrinsically rising spectra and increased variability. Since the surveys we used to predict the source population at 15 GHz are a decade lower in frequency, one would therefore expect to underestimate the number of SSA sources, leading to a non-prediction of many sources with rising spectra. Furthermore, the surveys used were undertaken at different epochs and hence no allowance can be made for variable sources.
4 Conclusions
-
(1).
We have used the Ryle Telescope at 15.2 GHz to survey 63 deg2 of sky chosen, on the basis of low–frequency information, to contain no source with flux density 500 mJy. The differential source count of the 66 sources found is 80 from 20 mJy to 500 mJy.
-
(2).
Extrapolating the source count to 34 GHz, near to which current cm-wave CMB experiments operate, the temperature contribution of sources to a CMB image with a 43-arcmin beam (corresponding to 500) is estimated to be = 9K. Hence, the signal-to-noise ratio in CMB images will be limited to 4 or 5, and even more at higher resolution, if foreground sources are not removed.
-
(3).
In the case of the VSA compact array, which will measure the CMB power spectrum in the -range 120–700, the RT source surveying should reduce to 3 K in a 43-arcmin beam at 34 GHz.
-
(4).
Our results show that the existence and flux density of individual sources cannot be predicted accurately by extrapolation from low-frequency surveys. We find that trying to predict source fluxes at 15 GHz by extrapolating their 1.4 and 4.8-GHz fluxes gives a greater error, i.e. a greater , than attempting no source subraction at all.
Acknowledgments
We thank the staff of the Cavendish Astrophysics group for operation of the Ryle Telescope, which is funded by PPARC. ACT acknowledges a PPARC studentship.
References
- [1987] Aizu, K., Inoue, M., Tabara, H., & Kato, T., 1987, IAU Symp. 124: Observational Cosmology, 124, 565
- [2000] de Bernardis, P. et al., 2000, Nat, 404, 955
- [1998] Condon, J. J., Cotton, W. D., Greisen, E. W., Yin, Q. F., Perley, R. A., Taylor, G. B. & Broderick, J. J., 1998, AJ, 115, 1693
- [1998] Edge, A. C., Pooley, G., Jones, M., Grainge, K. & Saunders, R., 1998, ASP Conf. Ser. 144: IAU Colloq. 164: Radio Emission from Galactic and Extragalactic Compact Sources, 187
- [1991] Gregory, P. C. & Condon, J. J., 1991, ApJS, 75, 1011
- [2000] Hanany, S. et al., 2000, ApJ, 545, L5
- [1998] Jones M. & Scott P., 1998, in Trân Thanh Vân J., et al., eds., Proceedings of XXXIIIrd Recontres de Moriond. Editions Frontièrs.
- [1957] Scheuer P.A.G. 1957, Proc. Camb. Phil. Soc., 53, 764
- [1992] Smoot, G. F. et al., 1992, ApJL, 396, L1
- [1998] Toffolatti, L., Argueso Gomez, F., de Zotti, G., Mazzei, P., Franceschini, A., Danese, L. & Burigana, C., 1998, MNRAS, 297, 117
- [2000] Waldram, E. M., & Pooley, G. G., 2000, IAU Symposium, 201, E102
- [1993] Windhorst, R. A., Fomalont, E. B., Partridge, R. B., & Lowenthal, J. D., 1993, ApJ, 405, 498