Constraints on properties of the protoplanetary disks around UX Ori and CQ Tau
Abstract
We present Very Large Array observations of the intermediate mass pre-main-sequence stars UX Ori and CQ Tau at 7 mm, 3.6 cm, and 6 cm. These stars are members of the UX Ori variability class, where the origin of optical variability is thought to derive from inhomogeneities in circumstellar disks. Both stars are detected at 7 mm but not at longer wavelengths, which confirms that the millimeter emission is dominated by dust.
The UX Ori system exhibits a remarkably flat spectral index in the millimeter range, with (). Two different disk models can reproduce this property: i) a physically small disk with optically thick emission, truncated at a radius about 30 AU, or ii) a massive () disk mainly composed of dust particles grown to radii of 10 cm (“pebbles”). The observations do not spatially resolve the 7 mm emission. We discuss implications of these two models and suggest observational tests that will discriminate between them.
The CQ Tau system exhibits a spectral index in the millimeter range of , consistent with values commonly found for disks around pre-main-sequence stars. The observations marginally resolve the 7 mm emission as an elongated structure with full width at half maximum of ( AU at 100 pc distance). The size and inclination of degrees (implied by circular symmetry) are consistent with flared disk models previously suggested to explain the optical colors and polarization properties.
1 Introduction
The study of the circumstellar material around intermediate mass pre-main sequence stars has received growing attention in recent years since it has been realized that most of these systems are surrounded by protoplanetary circumstellar disks similar to those found around low mass pre-main sequence stars (see e.g. Natta, Grinin & Mannings 2000). Herbig Ae stars (Herbig 1960; Waters & Waelkens 1998) are particularly interesting because they share the same spectral type as the much older “debris” disk systems, such as Pic or Lyrae, of which they may be a preceding evolutionary stage (Mannings & Sargent 1997; 2000; Mannings, Koerner & Sargent 1997).
UX Ori–type stars are intermediate mass pre-main sequence stars, mostly belonging to the Herbig Ae class, that show large and irregular variability at optical wavelengths, characterized by sporadic, deep minima associated with increasing polarization. This behavior is generally believed to be due to variable line of sight extinction provided by dust clumps orbiting about the central star in a flattened structure seen almost edge on (Grinin et al. 1991; Grinin 1994; Natta & Whitney 2001). The optical spectra of these stars show transient absorption features similar to those observed in the “debris” disk system Pic, and have similarly been interpreted as due to the infall of evaporating, comet-like bodies in star grazing orbits (see the reviews by Lagrange, Backman & Artymowicz 2000 and Natta et al. 2000).
Single dish and interferometric millimeter wavelength observations suggest that UX Ori–type stars are indeed surrounded by circumstellar material in a flattened structure rotating about the central star. The properties of these disks are similar to those of disks associated with T Tauri and other Herbig Ae stars (Dutrey et al. 1996; Koerner & Sargent 1995; Mannings & Sargent 1997; 2000 Natta et al. 1997; 2001). Natta & Whitney (2001) have shown that scattering of the stellar light by such disks can easily explain the polarization and colors typical of UXORs in deep minima, provided that the disk inclination is in the range 45∘ to 70∘ (Natta & Whitney 2001). The disks in UX Ori–type systems are not directly responsible for the optical variability, which is caused by a sporadic increase of the optical depth along the line of sight, probably due to density inhomogeneities of matter within the flared disk atmosphere (Bertout 2000).
Recent millimeter interferometric observations of the class prototype (UX Ori) revealed that the circumstellar material is confined within a flattened structure (a circumstellar disk); the emission is characterized by a flat (F) spectral energy distribution up to 2.7 mm, suggesting that, if the millimeter emission is entirely due to the thermal emission from the dust grains within the disk, the disk is either optically thick at millimeter wavelengths or is composed of very large (10 cm) dust particles (Natta et al. 1999).
Similar results have been obtained for two other systems in the same class, WW Vul and CQ Tau. In both cases the circumstellar material must be distributed in a disk as in the case of UX Ori (Natta et al. 2001). It is thus tempting to speculate that UX Ori–type systems are characterized by relatively evolved disks, possibly in the phase of grain growth and planetesimal formation.
In this paper we present the results of new interferometric 7 millimeter and centimeter (3.6 and 6 cm) observations of the circumstellar material surrounding UX Ori and CQ Tau. The other UX Ori–type system known to have a flat millimeter spectrum (WW Vul) was excluded from our sample because of sensitivity considerations (it is the faintest source of the sample). The aim of these observations were two-fold: i) to verify whether the flat millimeter wavelength spectral energy distribution extends up to 7 mm; and ii) to quantify, if any, the contribution to the millimeter emission due to possible free-free emission from an ionized wind. The free-free emission, if present, will tend to flatten the observed millimeter spectral energy distribution. The plan of the paper is as follows: in Sect. 2 and 3 we report the observational details and the results; in Sect. 4 we compare our observations with detailed disk models; the implications of our results are discussed in Sect. 5.
2 Observations
UX Ori and CQ Tau were observed with the NRAO111The National Radio Astronomy Observatory is a facility of the National Science Foundation operated under cooperative agreement by Associated Universities, Inc. VLA in its most compact (D) configuration in September and October 2000. The observing parameters are reported in Table 1. Each source was observed in the Q-band (43.34 GHz, 0.7 cm), X-band (8.46 GHz, 3.6 cm) and C-band (4.86 GHz, 6 cm), the latter observations were obtained at the same time as the Q-band observations using all the antennas not equipped with 43 GHz receivers (6 for UX Ori and 5 for CQ Tau). At high frequency we used a fast-switching observing cycle with total duration ranging from one to three minutes depending on the distance between the source and the chosen complex gain calibrator and on the elevation of the sources. At X- and C-band we used a standard observing sequence with 5 min cycles between source and calibrator. Hourly pointing at X-band on the calibrators were used to correct for pointing drifts during the Q-band observations. The flux density scale was set by observing 3C286 and/or 3C48, the calibration is expected to be accurate within 10-20% depending on the waveband, with the less accurate being the higher frequency band. All data editing and calibration has been performed using standard tasks within the NRAO AIPS software package. Self-calibration was not possible due to the faintness of the sources. All images presented here have been produced using the AIPS IMAGR task with natural weighting of the () datasets. No correction for primary beam attenuation has been applied, unless differently noted. At 6 cm, the image rms is higher than theoretical expectation by a factors of about 2 (UX Ori) and 5 (CQ Tau) due to the very sparse coverage and the presence of strong confusing sources in the field of view far off the phase center.
3 Results
3.1 7 mm emission
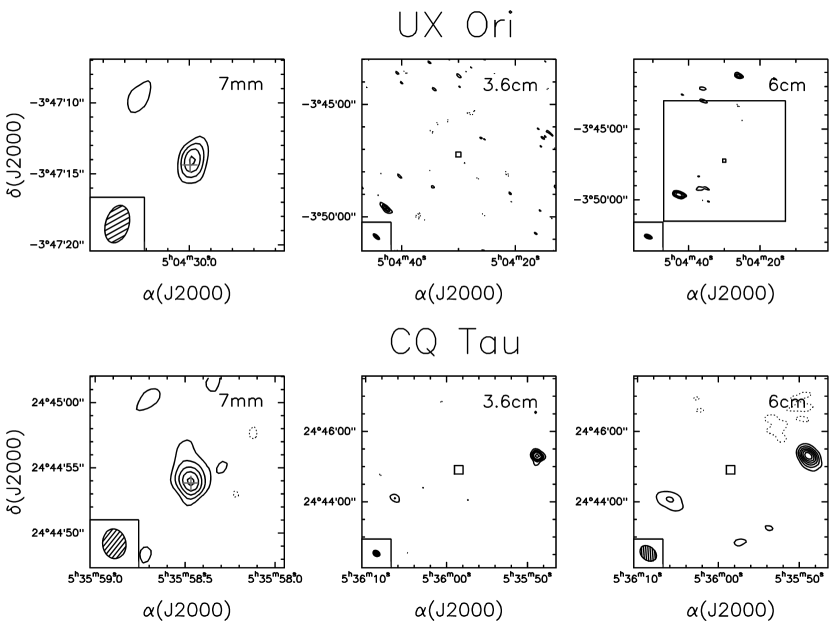
Both sources were clearly detected at 7 mm. In Figure 1 we show the 7 mm contour plots of the region surrounding the target stars. In Table 2 we report the properties of the 7 mm emission along with stellar parameters from the literature. For each source we report distance and spectral type of the target star from Natta et al. (2001, 1999), stellar age and mass as derived from the theoretical pre-main sequence evolutionary tracks of Palla & Stahler (1999), then the VLA peak position, integrated flux, and deconvolved size (or upper limit) as obtained by fitting a gaussian to the 7 mm source. In both cases the peak of the 7 mm emission is coincident (within our positional uncertainties of ) with the position of the optical star corrected for proper motion as derived from the Hipparcos catalogue (Perryman et al. 1997).
The millimeter emission is unresolved in UX Ori. In the case of CQ Tau, the 7 mm emission appears to be marginally resolved and elongated in the north-south direction (see Table 2). We find consistent results, albeit with lower signal-to-noise, by fitting a gaussian on a slightly higher resolution image of CQ Tau obtained using the “robust” weighting scheme available with the AIPS IMAGR task. Assuming a circularly symmetric, geometrically thin disk, the measured inclination of the disk axis from the line of sight is 63+10/-15 deg, in excellent agreement with that predicted by the Natta & Whitney (2001) models, who derive a value of 66 deg to explain the polarization of light during the deep optical emission minima. It is interesting to note that, based on CO(2–1) interferometric observations, Mannings & Sargent (2000) derive an upper limit to the size of the gaseous disk smaller than our 7 mm continuum observation, this difference may be due to a different surface brightness sensitivity. Clearly higher resolution observations of both the gaseous and dust components are needed to confirm the exact disk geometry.
3.2 3.6 and 6 cm emission
There is no detection of either source at 3.6 and 6 cm. In the last two columns of Table 2 the 3.6 and 6 cm upper limits (3) at the 7 mm sources positions are given. There are, however, a few sources far from the stellar positions (see Fig. 1). For the sake of completeness, in Table 3 we report positions and fluxes of these sources, as well as the NVSS counterpart name and integrated flux (when found in the NVSS catalogue, Condon et al. 1998). Following Fomalont et al. (1991) and Windhorst et al. (1993) we can estimate the number of expected background extragalactic radio sources in our fields: at 6 cm over a 200 square arcmin area we expect 3 sources brighter than 0.5 mJy, while at 3.6 cm over 50 square arcmin, 2.5 sources brighter than 0.1 mJy are expected. These predictions are in rough agreement with the number of centimeter sources we observed, and suggest that they may be extragalactic, which would also be consistent with the non-thermal spectral index of three of them (see Table 3). In any case, none of these cm wavelength radio sources is directly related to our target stars and their circumstellar material and we will not discuss them further.
3.3 The millimeter spectra of UX Ori and CQ Tau
To obtain the millimeter spectrum of the circumstellar material surrounding our target stars, we combined our measurements with available millimeter interferometric and single dish continuum observations from Natta et al. (1999) and Mannings & Sargent (1997; 2000). We include both interferometric and single dish measurements and assume that the mm-wave emitting region is confined to a compact region around the star. This assumption is supported by the fact that the 1.3 mm single dish and interferometer fluxes are consistent with each other (see also the discussion in Natta et al. 1999). The cm-wavelength upper limits can be used to constrain the possible contribution of free-free emission to the flux measured at 7 mm. Following Mannings & Sargent (1997) and using the 3.6 cm upper limits reported in Table 2, the contribution to the 7 mm flux from an ionized stellar wind, with a spectral index 0.6 (Panagia & Felli 1975), would be 0.24 and 0.2 mJy for UX Ori and CQ Tau, respectively. This estimate of the upper limit for the free-free emission confirms the earlier conclusion that the millimeter wavelength emission in these systems is due to thermal dust emission with a very small (if any) contribution from ionized gas (Mannings & Sargent 1997; Natta et al. 1999).
In Figure 2 we show the results of power law fits (F) to the millimeter spectral energy distributions. The values of that we derive are rather low. The value in UX Ori, in particular, is among the lowest of those found for Herbig Ae/Be stars (Natta et al. 2000) and is significantly smaller than the average values found for T Tauri stars (Dutrey et al. 1996). In Figure 2 we also show the 7 mm flux of UX Ori with the maximum correction for free-free emission as calculated above. The point, shown as an open triangle, would still be consistent with the thermal dust emission fit we derive. For the CQ Tau system, we obtain . In this case the maximum possible contribution from free-free emission to the 7 mm flux is so small () that it is barely visible in the Figure.
These values of are not consistent with optically thin thermal emission from standard interstellar dust grains (; Draine & Lee 1984). This result is not uncommon for circumstellar disks around young stars and can be understood if the emission is optically thick or, alternatively, if grains in circumstellar disks have grown to sizes significantly larger than those of grains in the diffuse interstellar medium (Beckwith & Sargent 1991; Pollack et al. 1994; Natta et al. 1999). In fact, for grains with physical size larger than the observing wavelength, the emissivity is just the geometrical cross section, and a flat spectral index at millimeter wavelengths may be an indication of the presence of centimeter-size dust particles (“pebbles”). We will discuss these possibilities in detail for our target systems in the following section.
4 Comparison with disk models
The spectral energy distributions (SEDs) of Herbig Ae stars in general, and of UX Ori and CQ Tau in particular, can be explained reasonably well by disk models which take into account the vertical temperature gradient caused by the stellar radiation impinging on the disk surface (Natta et al. 2001; Chiang et al. 2001). In these models, the dust features, such as the 10 m emission feature, and the mid-infrared continuum originate in the hotter optically thin surface layers of the disk (the disk atmosphere), while the emission at longer wavelengths is due to dust in the cooler disk midplane. Using the simple two-layer approximation developed by Chiang & Goldreich (1997) Natta et al. (1999, 2001) found that Herbig Ae disks are in hydrostatic equilibrium (flared disks; Kenyon & Hartmann 1987). The grains in the disk atmosphere are a mixture of amorphous silicates and some other material, possibly carbonaceous grains or metallic iron, which dominate the opacity in the UV. These atmospheric grains cannot be much larger than 1 m. In the disk midplane grains are probably much larger.
The properties of the grains in the disk midplane can only be studied at millimeter wavelengths, where the emission in many objects becomes optically thin. Its dependence on wavelength reflects the way dust opacity depends on , and may tell us about the grain size. However, optical depth effects may still be important even at 1.3 mm. As discussed in Natta et al. (1999) for UX Ori, both an optically thin disk where grains have grown to very large size (“pebbles”) and a small disk, optically thick in the millimeter, have spectral index and may fit equally well the observed SED at all wavelengths. As we will see in the following, the new 7 mm data presented in this paper allow us to clarify the issue, even if they are still not sufficient for deciding it.
To this purpose, we have computed a large grid of models for both UX Ori and CQ Tau following Chiang & Goldreich (1997) and Natta et al. (2001). For each model, we fix the stellar parameters as in Table 2, and take the values of the inclination to the line of sight of 60∘ and 66∘ for UX Ori and CQ Tau respectively, as derived by Natta & Whitney (2001). We vary the disk outer radius and the surface density profile, defined as:
| (1) |
where is a reference radius. Both and are varied over a wide range of values. The disk mass is uniquely determined once , and are fixed. Since we are interested in the disk emission at long wavelengths, the results do not depend on the disk inner radius.
We describe the opacity of the dust in the disk midplane as a power-law function of wavelength with exponent :
| (2) |
The long-wavelength flux depends on the properties of dust in the atmosphere only if and when the disk midplane is optically thin (to its own radiation). We choose dust properties for the grains in the disk atmosphere as in Natta et al. (2001); any other choice that fits the SEDs at shorter wavelengths would not affect our conclusions significantly. These “toy” models are very simplified and can be questioned on a variety of grounds (see e.g. Dullemond 2000). However, they are very useful for the general understanding of the implications of our millimetric observations.
4.1 UX Ori
The results for UX Ori are shown in Fig. 3, which plots the computed flux at 1.3mm as function of the spectral index between 1.3 and 7 mm. Each curve is computed varying () for fixed values of and , as labeled. () decreases from the upper left to the lower right of the diagram for all models. The models shown in the Figure have been computed for , but the results are not significantly different for and . All curves (, ) have a similar shape. For large values of (), the disks are optically thick at mm wavelengths, is maximum and . As () decreases, first the emission at 7 mm becomes optically thin: retains its optically thick value but increases. If () decreases further, the emission at 1.3 mm becomes optically thin, decreases and tends to its optically thin value of . The maximum value of depends on the inclination and on (see also Natta et al. 1999). For fixed values of and , the disk mass is proportional to . Fig. 4 plots the values of as function of the quantity () for AU (solid lines) and AU (dashed lines).
As shown by the cross in Fig. 3, UX Ori has a low 1.3 mm flux ( mJy; Natta et al. 1999) and a very flat spectral index. There are two families of models that can account for both properties at the same time: small disks ( 30 AU) which are still optically thick at 7 mm or disks with very large grains, such that . We have computed, using Mie theory, the cross section at millimeter wavelengths for large silicates and ices, based on data for a variety of minerals from the Jena database and for the astronomical silicates of Draine & Lee (1984). In all cases we find that grains with between 1.3 and 7 mm have radii of about 10 cm; their opacity is very low, of order of cm2 g-1 (this is the dust only mass opacity, assuming that the grains have a density of 3.5 g cm-3; no correction has been applied for the gas to dust mass ratio). This is about 3 times lower than the value in Natta et al. (1999), based on Fig. 4 of Miyake & Nakagawa (1993), who considered grains of silicates and ices with density 1.2 g cm-3. For these values of the opacity, the observed fluxes can only be reproduced by disks with a very massive dust component of about M⊙, with little dependence on other disk parameters such as and . This dust mass is a factor of three to ten higher than the largest dust masses measured in Herbig Ae/Be systems (Natta et al. 2000). When corrected for a gas to dust ratio of 100 by mass, the corresponding total disk mass would reach 0.3–1 M⊙.
Disks that are still optically thick at 7 mm up to their outer edge, where most of the 7 mm flux is emitted, have . In order to fit the low millimeter flux of UX Ori, they need to be “truncated” at AU, as shown in Fig. 3. The dust mass required depends on dust properties; it is at least M⊙ for grains typical of pre-main sequence disks ( cm2 g-1, , see also Fig. 4). Again, assuming a gas to dust ratio of 100 by mass, the total disk mass would be 0.13 M⊙. This is a rather large value, but not unique among Herbig Ae/Be systems.
Both kind of disks, “pebble” and “truncated”, fit well the UX Ori SED over the whole range of observed wavelengths, as shown in Fig. 5. However, 30 AU is a definite lower limit for the “truncated” disks radius, since smaller disks would not emit enough flux in the mid-infrared. A 30 AU disk can still scatter enough stellar light to reproduce the polarization and colors of the light during photometric minima (Natta & Whitney 2001). In a pebble disk, both the properties of the star at minima and the shape of the mid-infrared emission require the presence of rather small grains on the disk surface. This is consistent with the idea that grains grow to large size first in the disk midplane; however, the condition constrains the mass of dust in small grains to be 1% of the mass of pebble grains (Natta et al. 1999). Note, finally, that the condition that the disk is flared requires that the total disk mass is dominated by the gaseous component.
4.2 CQ Tau
The CQ Tau system is closer to the Sun and the central star is cooler than UX Ori. The millimeter wavelength spectral energy distribution is not as flat as in UX Ori, and the value of we derive is only marginally smaller than the typical value found in T Tauri systems. The location of CQ Tau on the (, ) diagram is shown in Fig. 6. It is consistent with a disk having 100 AU, as observed, and grains with , typical of pre-main sequence disks (Beckwith & Sargent 1991). The mass of dust in the disk is M⊙, again typical of Herbig Ae and T Tauri stars (Natta et al. 2000).
5 Discussion and Conclusions
UX Ori is certainly an intriguing system. The circumstellar disk may be very small and optically thick, in which case it must be “truncated” at R AU. How this could happen is unclear. It may be an evolutionary effect, but the system is not a member of a dense stellar cluster (cf. Testi et al. 1999) and the expected timescale required for the star to photoevaporate the outer regions of the disk is too long to explain such a sharp truncation at the estimated system age of 3 Myrs (Hollenbach et al. 2000; Hollenbach priv. comm.). A more plausible explanation for such a small disk is the presence of a nearby companion. To create a tidal truncation of 30 AU, the orbital separation should be roughly 60–100 AU (Lubow & Artymowicz 2000). No companion was found in the moderate (0.4″ or 200 AU) resolution search by Pirzkal et al. (1997), although Hipparcos data indirectly suggests the presence of a close companion with a minimum separation of about 20 mas ( AU at distance of 450 pc; Bertout et al. 1999).
Alternatively, the UX Ori disk may be more “normal” in size and have grown very large (10 cm) particles in its midplane. Such a disk must be very massive (0.25–1 M⊙ for a gas-to-dust mass ratio of 100 or ), much more massive than any known disk around Herbig Ae and T Tauri stars and very close to the limit for gravitational stability (Shu et al. 1990). Note that this mass estimate assumes a gas-to-dust ratio of 100 and an opacity for the “pebble” dust as derived in Sect. 4.1. A moderate gas depletion may lower this estimate of the present day disk mass. However, the dust mass in UX Ori, up to 0.01 M⊙ for “pebble” opacity, would be exceptionally high, much higher than the dust mass derived from the analysis of millimeter fluxes in other pre-main sequence stars (Natta et al. 2000); moreover the initial disk mass before gas depletion would still be very high.
With the available information, the choice between a truncated disk and a larger, pebble disk can only rely on plausibility arguments. Pebble disks must be very massive. However, uncertainties on the opacity and on the exact disk structure make it difficult to determine the mass of the disk accurately. Two possible observational tests may be able to discriminate between the possibilities: i) to search for a possible companion, and ii) to resolve the disk emission at millimeter wavelengths. A 0.2″ separation binary, even with a relatively large luminosity difference, can easily be resolved with modern near-infrared high resolution techniques, unless the geometry is very unfavorable. The detection of a close companion which could truncate the disk around the primary star would support this hypothesis. A more direct approach would be to resolve the disk and determine . As discussed earlier, a large disk radius would require pebble grains, and could be resolved at 7 mm with the VLA, or at higher frequencies with ALMA. A large disk radius would not be consistent with “normal” disk grains.
Is UX Ori a unique object? If this were the case, albeit interesting per se, it would not shed light on the structure and evolution of typical protoplanetary disks. However, it appears more likely that the properties of the disk around UX Ori are shared by a class of systems which may represent a well defined disk evolutionary stage. As discussed in Sect. 1, WW Vul, which also shares a similar optical photometric variability, has a millimeter spectrum similar to UX Ori with between 1.3 and 2.7 mm Natta et al. (2001). A set of promising candidates with flat sub–millimeter SEDs has been recently discussed by Meeus et al. (2001). Millimeter wavelength observations of these systems are needed to verify whether the disk properties are similar to that of UX Ori.
CQ Tau appears to have a disk which is similar to other pre-main sequence disks. The primary advantage of observing CQ Tau is the fact that it is near-by (D pc). Our observations with VLA in its most compact (D) configuration marginally resolve its 7 mm emission. They are consistent with the disk inclination predicted by Natta & Whitney (2001), thus providing an indirect support for their models. The sensitivity and resolution of the VLA in more extended configurations at 7 mm offer the possibility to further resolve the disk emission and directly probe the density and temperature structure of the emitting dust within the circumstellar disk of a pre-main sequence star. Very few young disk systems have been recently resolved in the millimeter continuum: the binary system L1551 (Rodríguez et al. 1998), and the TTauri systems HL Tau and TW Hyd (Wilner & Lay 2000; Wilner et al. 2000).
Our observation do not offer any clues about the possible link between the UX Ori–type optical variability and disk properties. We can only confirm the earlier suggestion that the disk surrounding CQ Tau is seen at the inclination inferred by fitting its optical light polarization properties with flared disk models. Since a prediction of these models is that the star is observed through the outer edges of the disk atmosphere, a plausible guess is that the sporadic variability may be caused by disk atmosphere inhomogeneities (Bertout 2000; Natta & Whitney 2001).
References
- Beckwith & Sargent (1991) Beckwith S.V.W. & Sargent A.I. 1991, ApJ, 381, 250
- Bertout (2000) Bertout C. 2000, A&A, 363, 984
- Bertout et al. (1999) Bertout C., Robichon N., Arenou F. 1999, A&A, 352, 574
- Chiang & Goldreich (1997) Chiang E.I. & Goldreich P. 1997, ApJ, 490, 368
- Chiang & Goldreich (1999) Chiang E.I. & Goldreich P. 1999, ApJ, 519, 279
- Chiang et al. (2001) Chiang E.I., Joung M.K., Creech-Eakman M.J., Qi C., Kessler E.J., Blake G.A., van Dishoeck E.F. 2001, ApJ, 547, 1077
- Condon et al. (1998) Condon J.J., Cotton W.D., Greisen E.W., et al. 1998, ApJ, 115, 1693
- Draine & Lee (1984) Draine B.T. & Lee H.M. 1984, ApJ, 285, 89
- Dullemond (2000) Dullemond C.P. 2000, A&A, 361, L17
- Dutrey et al. (1996) Dutrey A., Guilloteau S., Duvert G., Prato L., Simon M., Schuster K., Ménard F. 1996, A&A, 309, 493
- Fomalont et al. (1991) Fomalont E.B., Windhorst R.A., Kristian J.A., Kellerman K.I. 1991, AJ, 102, 1258
- Grinin et al. (1991) Grinin V.P., Kiselev N.N., Chernova G.P., Minikhulov N.Kh., Voshchinnikov N.V. 1991, Ap&SS, 186, 283
- Grinin et al. (1994) Grinin V.P. 1994, in ASP Conf. Ser. 62, “The Nature and Evolutionary Status of Herbig Ae/Be Stars”, eds. P.S. Thé, M.R. Pérez & E.P.J. van den Heuvel (San Francisco:ASP), p. 63
- Herbig (1960) Herbig G.H. 1960, ApJS, 4, 337
- Hildebrand (1983) Hildebrand R.H. 1983, QJRAS, 24, 267
- Hollenbach et al. (2000) Hollenbach D.J. Yorke H.W., Johnstone D. 2000, in Protostars and Planets IV eds. V. Mannings, A.P. Boss & S.S. Russell (Tucson: Univ. of Arizona Press), p. 401
- Kenyon & Hartmann (1987) Kenyon S. & Hartmann L. 1987, ApJ, 323, 714
- Koerner & Sargent (1995) Koerner D.W. & Sargent A.I. 1995, AJ, 109, 2138
- Kramer et al. (1998) Kramer C., Alves J., Lada C., Lada E., Sievers A., Ungerechts H., Walmsley M. 1998, A&A, 329, L33
- Lagrange et al. (2000) Lagrange A.-M., Backman D. E., Artymowicz P. 2000, in Protostars and Planets IV eds. V. Mannings, A.P. Boss & S.S. Russell (Tucson: Univ. of Arizona Press), p. 559
- Lubow & Artymowicz (2000) Lubow S.H. & Artymowicz P. 2000, in Protostars and Planets IV eds. V. Mannings, A.P. Boss & S.S. Russell (Tucson: Univ. of Arizona Press), p. 731
- Mannings & Sargent (1997) Mannings V. & Sargent A.I. 1997, ApJ, 490, 792
- Mannings & Sargent (2000) Mannings V. & Sargent A.I. 2000, ApJ, 529, 391
- Mannings et al. (1997) Mannings V., Koerner D.W. & Sargent A.I. 1997, Nature, 388, 555
- Meeus et al. (2001) Meeus G., Waters L.B.F.M., Bouwman J., van den Ancker M.E., Waelkens C., Malfait K. 2001, A&A, 365, 476
- Miyake & Nakagawa (1993) Miyake K. & Nakagawa Y. 1993, Icarus, 106, 20
- Natta et al. (1997) Natta A., Grinin V.P., Mannings V., Ungerechts H. 1997, ApJ, 491, 885
- Natta et al. (2000) Natta A., Grinin V.P., & Mannings V. 2000, in Protostars and Planets IV eds. V. Mannings, A.P. Boss & S.S. Russell (Tucson: Univ. of Arizona Press), p. 559
- Natta et al. (1999) Natta A., Prusti T., Neri R., Thi W.F., Grinin V.P., Mannings V. 1999, A&A, 350, 541
- Natta et al. (2001) Natta A., Prusti T., Neri R., Wooden D., Grinin V.P., Mannings V. 2001, A&A, submitted
- Natta & Whitney (2001) Natta A. & Whitney B.A. 2001, A&A, in press
- Palla & Stahler (1999) Palla F. & Stahler S.W. 1999, ApJ, 525, 772
- Panagia & Felli (1975) Panagia N. & Felli M. 1975, A&A, 39, 1
- Perryman et al. (1997) Perryman M.A.C. et al. 1997, A&A, 323, L49
- Pirzkal et al. (1997) Pirzkal N., Spillar E.J., Dyck H.M. 1997, ApJ, 481, 392
- Pollack et al. (1994) Pollack J.B., Hollenbach D., Beckwith S., Simonelli D.P., Roush T., Fong W. 1994, ApJ, 421, 615
- Rodríguez et al. (1998) Rodríguez L.F., D’Alessio P., Wilner D.J. et al. 1998, Nature, 395, 355
- Shu et al. (1990) Shu, F.H., Tremaine, S., Adams, F.C., and Ruden, S.P. 1990, ApJ, 358, 495
- Testi et al. (1999) Testi L., Palla F., Natta A. 1999, A&A, 342, 515
- Waters & Waelkens (1998) Waters L.B.F.M. & Waelkens C. 1998, ARAA, 36, 233
- Wilner et al. (2000) Wilner D.J., Ho P.T.P., Kastner J.H., Rodríguez L.F. 2000, ApJ 534, L101
- Wilner & Lay (2000) Wilner D.J. & Lay O.P. 2000, in Protostars and Planets IV eds. V. Mannings, A.P. Boss & S.S. Russell (Tucson: Univ. of Arizona Press), p. 509
- Windhorst et al. (1993) Windhorst R.A., Fomalont E.B., Partridge R.B., Lowenthal J.D. 1993, ApJ, 405, 498
| Parameter | 0.7 cm | 3.6 cm | 6 cm | 0.7 cm | 3.6 cm | 6 cm |
|---|---|---|---|---|---|---|
| UX Ori | CQ Tau | |||||
| Phase center (J2000) | 05h04m29.99s | 05h35m58.47s | ||||
| (J2000) | 03∘47′14.3′′ | 24∘44′54.1′′ | ||||
| Observing date | 10Sep00 | 05Sep00 | 10Sep00 | 02Oct00 | 02Oct00 | 05Oct00 |
| Configuration | D | D | D | D | D | D |
| Durationa (hrs) | 8 | 1 | 8 | 7 | 1 | 7 |
| Frequency (GHz) | 43.34 | 8.46 | 4.86 | 43.34 | 8.46 | 4.86 |
| Bandwidth (MHz) | 450 | 450 | 450 | 450 | 450 | 450 |
| Gain calibrators fluxes 0501019 (Jy) | 0.83 | 1.05 | 1.18 | – | – | – |
| 0559238 (Jy) | – | – | – | 0.48 | 0.51 | 0.52 |
| Primary beam | 1′ | 5.3 | 9.3 | 1′ | 5.3 | 9.3 |
| Largest structure that can be imaged | 43″ | 3′ | 5′ | 43″ | 3′ | 5′ |
| Synthesized beam (FWHM) | ||||||
| Position Angle | 15∘ | 49∘ | 69∘ | 7∘ | 58∘ | 49∘ |
| Noise (mJy/beam) | 0.1 | 0.03 | 0.07 | 0.15 | 0.025 | 0.25 |
| Star | Da | Sp.T.a | Ageb | M | F7mm | FWHM | p.a. | F3.6cm | F6cm | ||
|---|---|---|---|---|---|---|---|---|---|---|---|
| (pc) | (Myr) | (M⊙) | (J2000) | (J2000) | (mJy) | (AU) | (deg) | (mJy) | (mJy) | ||
| UX Ori | 450 | A3 | 2.2 | 2.3 | 5:04:29.98 | 3:47:14.1 | 0.840.2 | 700 | – | 0.09 | 0.2 |
| CQ Tau | 100 | F2 | 9.0 | 1.5 | 5:35:58.47 | 24:44:54.2 | 2.60.4 | 24030110 30 | 213 | 0.075 | 0.75 |
| Identifier | NVSS | |||||
|---|---|---|---|---|---|---|
| (J2000) | (J2000) | (mJy) | (mJy) | Counterpart | (mJy) | |
| J0504259034115 | 05:04:25.9 | 03:41:15 | – | 2.2 | NVSSJ0504257034112 | 4.7 |
| J0504427034938 | 05:04:42.7 | 03:49:38 | 3.9 | 3.1 | – | – |
| J0535488244519 | 05:35:48.8 | 24:45:19 | 2.5 | 3.1 | NVSSJ0535489244517 | 6.8 |
| J0536064244406 | 05:36:06.4 | 24:44:06 | 0.3 | 1.4 | – | – |
Note. — The identifiers are derived from the J2000 coordinates of the sources. The integrated fluxes have been corrected for the primary beam attenuation, since the sources are far away from the phase center the correction is large (especially at 3.6 cm) and the fluxes are affected by large uncertainties.