The Host Haloes of Lyman Break Galaxies and Sub-millimeter Sources
Abstract
We use the observed sizes and star formation rates of Lyman-break galaxies (LBGs) to understand their properties expected in the hierarchical scenario of galaxy formation. The observed size distribution constrains the masses (or circular velocities) of the host haloes of LBGs from below, because small haloes can only host galaxies with small sizes. The observed star-formation distribution constrains the masses from above, because the number density of massive haloes in duty cycle is too low to host all the observed galaxies. Assuming a flat CDM model with a cosmological constant (), we find that consistency with observations requires the circular velocities of LBG host haloes to be in the range –. The star formation in these haloes is quite efficient; a large fraction of all the gas in them can form stars on a time scale of about 10–20 per cent of the Hubble time at redshift of 3. The predicted comoving correlation length of these objects is , and the predicted velocity dispersion of their stellar contents is typically . It is likely that these LBGs are the progenitors of galactic bulges and faint ellipticals.
The same prescription applied to larger haloes in the CDM cosmogony predicts the existence of galaxies with star formation rates at redshift . We explore the possibility of identifying these galaxies to be the bright sub-millimeter (sub-mm) sources detected by SCUBA. The model predicts that the host haloes of these sub-mm sources are massive, with typical circular velocity . The typical star formation timescale in these systems is about 10 per cent of the Hubble time at redshift 3, and the comoving number density of galaxies (in their duty cycle) is –. These galaxies are predicted to be strongly correlated, with a comoving correlation length of . They are also predicted to be strongly correlated with LBG population at the same redshift, with a cross-correlation length . The descendants of the bright sub-mm sources should reside in clusters of galaxies at the present time, and it is likely that these objects are the progenitors of giant ellipticals. We estimate that about 15 per cent of the observed sub-mm background is contributed by this population of objects in the redshift range –; a comparable contribution is made by LBGs in the same redshift range. The model predicts the existence of a relatively bright and red population of galaxies at , which may be observed in the K-band.
keywords:
galaxies: formation - galaxies: structure - galaxies: halo - galaxies: starburst - galaxies: elliptical1 Introduction
At present there are two main populations of objects which may be crucial to our understanding of the formation of bright galaxies in the universe. The first is the Lyman-break population at redshifts , observed by the Lyman break technique (Steidel, Pettini & Hamilton 1995). The second is the population detected by some recent sub-mm detectors such as SCUBA on JCMT (Holland et al. 1999; Blain et al. 1999). Galaxies in both populations are found to show vigorous star formation activity, and so a large fraction of stars we observe today may have been formed in these systems
The Lyman-break technique is quite efficient in identifying star forming galaxies at . At the moment, about 1000 galaxies have been selected by this technique and confirmed by followup spectroscopic observations (Steidel et al. 1999b). The sample is selected according to a flux limit in the optical -band () which corresponds to UV in the rest-frame. Thus, the selection may imply a lower limit on the star formation rates in the selected galaxies. The typical star formation rate is (all values are quoted for a flat universe with , and ), assuming a dust correction of a factor of about 5 (e.g. Steidel et al. 1999a,b; Pettini et al. 1999a,b; Adelberger & Steidel 2000). The comoving number density of the Lyman-break galaxies (hereafter LBGs) is quite high, (Adelberger et al. 1998), comparable to the number density of local bright galaxies. They are also strongly clustered in space, with a correlation length comparable to that of normal galaxies in the local universe (Adelberger et al. 1998; Giavalisco & Dickinson 2000). With a typical half-light radius of about (Giavalisco et al. 1996; Lowenthal et al. 1997), LBGs are quite small compared to the normal galaxies in the local universe.
Since the Lyman-break technique selects galaxies according to their rest-UV luminosity, it may miss dust-enshrouded star-forming galaxies, because the UV photons from young stars in such galaxies may be absorbed by dust and re-emitted in the far-infrared. Such galaxies can be detected in the sub-mm band, and so the recent discovery of strong sub-mm sources by SCUBA on JCMT may provide important clues to the star formation at high redshifts (see Blain et al. 1999). Unfortunately, current observations are still unable to determine the nature of these sub-mm sources. In particular, spectroscopic data on these sources are generally difficult to obtain, and so most of them do not have measured redshifts. If these strong sub-mm sources have redshifts similar to the LBG population (), as many people believe, the star formation rates in them may be as high as . If this is the case, the bright sub-mm sources may be an extension of the LBG population to higher star formation rates. Observational support for this comes from the fact that galaxies with the highest UV star formation rates are indeed detected statistically in the SCUBA map (Peacock et al. 2000).
Theoretically, the nature of the LBG population has been studied by many authors, but the results are still inconclusive. There have been suggestions that LBGs might be associated with massive dark haloes at (e.g. Mo & Fukugita 1996; Baugh et al. 1998). Such association allows one to make specific predictions for the clustering of the LBG population, and the model predictions are generally consistent with the observed high correlation amplitude (Mo & Fukugita 1996; Baugh et al. 1998; Jing & Suto 1998; Moscardini et al. 1998; Haehnelt, Natarajan & Rees 1998; Peacock et al. 1998; Wechsler et al. 1998; Coles et al. 1998; Mo, Mao & White 1999; Arnouts et al. 1999; Kauffmann et al. 1999; Katz, Hernquist & Weinberg 1999). The star formation properties and structure of the LBG population have also been studied under this hypothesis (e.g. Baugh et al. 1999; Mo, Mao & White 1999; Shu 2000). However, because of the uncertainties in the observations, the theoretical interpretation is not unique. For example, some authors suggest that LBGs are starbursts triggered by galaxy interactions (Kolatt et al. 1999; Somerville et al. 2000; Wechsler et al. 2000). In this scenario, the freedom in model construction is larger. For example, in one version, all LBGs are assumed to be starbursts triggered by galaxy-galaxy collisions, and so the star formation rate is not closely related to the mass of the host halo (Kolatt et al. 1999). Alternatively, LBGs may correspond to massive systems which were undergoing temporary mergers (either major or minor), as suggested by Somerville et al. (2000).
Theoretical interpretation of the sub-mm sources is even more uncertain. At the moment, the observational data are still too sparse to rule out any speculations. It is possible that these sources belong to the extension of the LBG population to higher star formation rates, as mentioned above, but current observations cannot rule out the possibility that they form a completely distinct population. It is therefore important to make model predictions and outline key future observations which can be used to distinguish different scenarios.
In this paper, we use recent observational results to set constraints on theoretical models for the LBG population. Our approach is different from those in earlier analyses in that it is largely empirical. We show that important constraints can already be obtained from current observational data. We use models motivated by the existing observational results to make further predictions which can be tested with future observations. In particular, we examine the properties of bright sub-mm sources in the same theoretical framework, and make predictions for this largely unexplored population.
The layout of this paper is as follows. We describe our empirical approach in Section 2. Predictions for the LBG population and for the sub-mm sources are presented in Sections 3 and 4, respectively. We summarize and make further discussions of our results in Section 5.
Since we are dealing with observations at high redshifts, a cosmological model has to be assumed in order to transform observables into physical quantities. Throughout this paper we assume a flat model with matter density and a cosmological constant corresponding to . We write the Hubble constant as .
2 An Empirical Approach to the Lyman-break Population
2.1 Observational Inputs
There are two important observational constraints on the properties of the LBG population. The first is their size distribution and the second is their star formation rates. Based on the deep imaging data from the Hubble Space Telescope, the effective radii have been determined for 45 LBGs brighter than (Giavalisco et al. 1996; Lowenthal et al. 1997). In Figure 1 we plot the observed size distribution, together with a log-normal fit of the data. The number of LBGs with determined sizes is still quite small, and so significant revision of the observational size distribution is possible in the future.

The UV luminosity function of the LBG population is straightforward to derive from the observed magnitudes (Steidel et al. 1999a,b) and the result is shown in Figure 2. However, in order to transform the UV luminosity function into a distribution in star formation rate, a correction for dust extinction has to be made. This turns out to be difficult, because the correction depends on the details of the dust distribution in individual galaxies. Recently, Adelberger & Steidel (2000) carried out a detailed analysis of dust extinction in LBGs, and their dust-corrected luminosity function is shown in Figure 2. The average dust correction is a factor of 5, compared to the factor of 2 to 3 obtained earlier (Steidel et al. 1998; Dickinson 1998). In our analysis, we will adopt the dust correction given by Adelberger & Steidel (2000). We use only LBGs with observed magnitude brighter than 25.5. For comparison, we also show results for two other dust corrections: a factor of 3 (Dickinson 1998) and a factor of 11 (Cowie & Barger 1999). For convenience, we will refer these models of dust correlation as
-
•
Case (a): a dust correction of a factor of 3;
-
•
Case (b): the dust correction based on Adelberger & Steidel (2000);
-
•
Case (c): a dust correction of a factor of 11.
Once a dust model is adopted, the observed UV luminosity function can easily be converted into a distribution of the star formation rate. We use the model as given in Steidel et al. (1999b).

2.2 The Empirical Approach
Given the size and star formation rate of a galaxy, we use the following procedure to predict the other properties of the galaxy. We assume that the star formation in LBGs obeys a law similar to the Schmidt relation for local star-forming galaxies:
| (1) |
where is the star formation rate (SFR) per unit area and is the surface density of cold gas (Kennicutt 1998). This empirical relation is found to hold reasonably well for a variety of star-forming galaxies: from quiescent disks to intensive starbursts. Although the validity of this relation for high-redshift star-forming galaxies has not yet been checked by observations, there is no obvious reason why star formation at should proceed in a dramatically different way. Assuming a surface-density profile for the gas, we can infer the total amount of cold gas in a galaxy from its radius and star formation rate. For an exponential surface-density profile (which we adopt in our discussion), the total mass in cold gas () is related to the star formation rate and effective radius (within which half of the UV luminosity is contained) as
| (2) |
Notice that this relation is not very sensitive to the density profile assumed, and so is a direct result of the empirical star formation relation. If we assume the mass in the cold gas to be times the mass of the dark halo, then the halo mass is
| (3) |
The value of is not known. If all gas in a galaxy-sized halo settles into the centre as cold gas, then (where is the density parameter of baryons), which is about if we take the cosmic nucleosynthesis value for a cosmology with and . At , gas cooling is effective in galaxy-sized haloes, and so we expect unless there is a process which can keep the gas from cooling. In our discussion we will treat as a free parameter.
The observed flat rotation curves of spiral galaxies suggest that the density profiles of dark haloes are approximately isothermal at large radii. If we define the mass of a dark halo to be that within a radius such that the mean density of the halo is about 200 times the critical density (as given by spherical collapse model), then the circular velocity and radius of the halo can be inferred from
| (4) |
where is the Hubble’s constant at redshift . For a flat universe with , at . The concentration of a galaxy in its halo is defined to be
| (5) |
where is the disk scalelength (Mao, Mo & White 1998). Defined in this way, resembles the spin parameter of disk material in dark haloes (see Mo, Mao & White 1998). Hereafter we refer as the compactness parameter.
Based on the above discussion, we can construct a Monte Carlo sample of LBGs by randomly drawing and from their distribution functions. An extra assumption involved here is that and are not strongly correlated. This assumption is consistent with the observational data for galaxies with -measurements. Our conclusion does not change significantly if a positive correlation between and (, as expected if the compactness parameter is not correlated with the halo circular velocity) is included.
3 Predicted properties for the LBG Population

As discussed above, our empirical approach enables us to construct a Monte-Carlo sample of LBGs that satisfy the observed distributions of size and star formation rate. From this Monte-Carlo sample, we can obtain various other properties of the LBG population and analyze their distributions.
3.1 Properties of the host haloes
In the model outlined above, LBGs are housed in the central parts of dark matter haloes. An important characteristic of the LBG population is the typical mass (or circular velocity) of their host haloes. Figure 3 shows the predicted distribution of for the host halos of LBGs; three panels (a), (b) and (c) correspond to the three prescriptions of dust correction as defined in Section 2.1. For each dust correction model, the solid, dotted and dashed lines denote of 0.12, 0.06 and 0.03, respectively. One can see that as increases, the underlying host halo circular velocities decrease, as expected from Equations (2-4). Figure 3 also indicates that for fixed , the required circular velocities of LBG hosts increase as the dust correction increases from case (a) to case (c). This trend can be easily understood as follows: as the dust correction increases, a given observed UV luminosity corresponds to a higher intrinsic total SFR, and to produce the higher SFR, the circular velocities of underlying haloes have to increase. More quantatively, for , the median values of are (180, 205, 250) for the three dust corrections cases (a, b, c), respectively. For and , the corresponding values for are (140, 165, 190), and (110, 130, 160), respectively. In our favored dust-correction model (b), the predicted median circular velocity is different from that obtained from early analyses. The reasons for this difference will be discussed in more detail in Section 5.

Figure 4 shows the predicted distribution of the compactness parameter as defined in equation (5). For the dust correction case (b), the median values for are 0.024, 0.028 and 0.033 for and 0.12, respectively. For a given disk mass fraction , the predicted LBGs are more compact (i.e., with smaller ) as the dust correction increases, because only the more compact objects can produce high (intrinsic) SFR while keeping the size distribution unchanged. For a given dust correction, the LBGs are more compact for smaller . This is because the predicted SFR drops as decreases, so in order to simultaneously satisfy the observed SFR and size distributions, the objects have to become more compact.
The -distributions for different dust corrections and -choices all have log-normal shapes with almost identical dispersion . This dispersion is consistent with that found in numerical simulations for the spin parameter of dark matter haloes (Warren et al. 1992; Cole & Lacey 1996; Lemson & Kauffmann 1998). However, we would like to emphasize that the parameter is related to but not equivalent to the conventional spin parameter that describes the angular momentum of dark haloes. Even if the initial specific angular momentum of the gas is equal to that of the dark matter, the gas may lose angular momentum to the dark halo in the settling process. Further, the self-gravity of the disk and the dark matter response to baryonic settling in general reduce the disk size and hence decrease the parameter (cf. Equation 5; see also Mo, Mao & White 1998). Also we caution that the gas settling process is not well understood, so the final stellar component may not be completely supported by rotation if the disk gravity becomes important first; this may be the case for many of our systems since they have . In such cases, we expect that both the angular momentum and the self-gravity of the gas are important in determining the final size. Indeed, if a LBG is not supported by angular momentum, then the compactness parameter is merely a measure of the concentration of the star-forming gas in a dark halo.
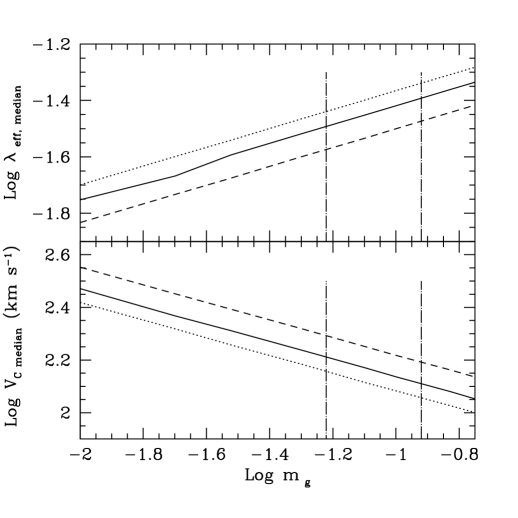
Figure 5 shows the median values for and as a function of . The dotted, solid and dashed lines are for the dust corrections of case (a), (b) and (c), respectively. For all the dust corrections, the median value of decreases with increasing while the -dependence on has an opposite sense. Again these trends are a result of the fact that we have taken the empirical distributions for the SFRs and sizes of the LBG population (see Equations 2-4).
While in Figure 5 we have plotted the parameter over a wide range, this parameter is in fact limited by two considerations. First, it must be smaller than or equal to the overall baryon mass fraction, . For the CDM cosmogony with , , if we adopt as found by Burles & Tytler (1998) from the deuterium abundance in QSO absorption line systems. Second, as we will show in the next two subsections, the duty cycle of LBGs and the abundance of dark haloes require . Hence, the typical value of should be in the range 0.06 to 0.12. These two constraints are shown as two vertical dot-dashed lines in Figure 5. The range of implies that the median value of the circular velocity for LBGs should be between 130 and 165.
3.2 Star formation timescale and duty cycle

Since LBGs are objects with high SFR at , an important question is how long can the high star formation activity be sustained. In our model, we can easily estimate the star formation timescale , defined as,
| (6) |
where is the total gas mass in Equation (2) and is the SFR. Note that in our empirical approach, the star formation timescale for LBGs is independent of the parameter , and is only a function of the dust-correction factor.
The predicted distributions of in units of the Hubble time at redshift 3 are shown in Figure 6, where the three panels are again for the three cases of dust corrections, respectively. This figure shows that, as the dust correction increases, the predicted star formation timescales become shorter on average due to increased intrinsic SFR. In all cases, the star formation timescale is of the order of a few tenths of the Hubble time, typically Gyr. This timescale is somewhat longer than the typical timescales of starbursts in the local universe, Gyr, but much shorter than the Hubble time. This short star formation timescale relative to the Hubble time implies that there must be more haloes hosting inactive ‘LBGs’ than the observed number of LBGs; these haloes are not currently forming stars actively so that they are not observable as LBGs. The short duty cycle of LBGs has important implications for the abundance of the host haloes, which we will discuss next.
3.3 Constraints from the halo abundance
As discussed in the previous subsection, the empirically inferred star formation timescales for LBGs are only a few tenths of the Hubble time at redshift 3. If we assume the lifetime of a halo is typically a Hubble time, then the short duty cycle means that there must be more haloes that once hosted LBGs; most of these hosts are dormant at . Accounting for this duty cycle, we can determine the comoving number density of LBG haloes as a function of from the dust-corrected luminosity function shown in Figure 2. Figure 7(a) shows the required number density of LBG haloes as a function of for the dust correction case (b); the solid, dotted and dashed lines are for and 0.03, respectively. The thick solid curve shows the halo abundance predicted by the Press-Schechter formalism (Press & Schechter 1974) in the CDM model (with , , , and with a shape parameter and a normalization for the power spectrum).
In the above calculation, all the gas has been assumed to have collapsed into the disk and forming stars. However, one can imagine an alternative scenario where initially only some gas collapsed into the disk; the gas left in the halo then acts as a gas reservoir to prolong the star formation timescale. As argued in §2.1, the total fraction of gas mass that can form stars must be smaller than the mass fraction in baryons, . Fig. 7(b) shows the predicted number of haloes where we have assumed that all baryons are available to fuel the star formation.

Figure 7 strongly suggests that the mass ratio cannot be much smaller than 0.1 if one considers the duty cycle of individual LBGs but allows no gas reservoir. Otherwise, the required halo number density will exceed the predicted number in the CDM model. Even if additional gas reservoir in a halo is considered, one still requires .
We have carried out the same calculation for a model with , , , and . This model requires in order to predict sufficient number of haloes with . The required is slightly larger than that allowed by cosmic nucleosynthesis.
3.4 Correlation functions
Based on the predicted distribution of the circular velocity above, we can calculate the correlation function for the LBG population using the method suggested by Mo & White (1996; see also Mo, Mao & White 1999, hereafter MMW99). The predicted correlation length as a function of the median value of for the LBG population (assuming varying ) is shown in Figure 8, where we have adopted the dust correction case (b) (the result is very insensitive to the assumed dust correction).
As we have discussed §3.1, the median value of for the LBG population is in the range of 130-165. From Figure 7, we conclude that the correlation length is in the range 2.6 to 3.4 for the CDM model. This value is smaller than the observed value obtained by Adelberger et al. (1998), but is consistent with the more recent determination by Giavalisco & Dickinson (2000) who found a correlation length (assuming the same flat cosmology as we are using here) for a sample of LBGs brighter than . The predicted correlation length is also smaller than those given by many earlier studies, because of the smaller halo circular velocities we predict for the LBG population.

Using the model given in Mo & White (1996), one can also predict the correlation function of the LBG descendants at the present time, assuming that mergers among LBGs are not significant. The predicted correlation length is about , comparable to that of normal galaxies in the local universe.
3.5 Stellar velocity dispersions

Our models predict the circular velocities of the haloes hosting LBGs, which are not directly observable. A more observationally oriented quantity is the stellar velocity dispersion () weighted by the SFR in the LBG population. As argued in MMW99, the dispersions are in general smaller than the underlying halo circular velocities as a result of projection effects and the fact that the stars only sample the inner rising part of the halo rotation curve. Following MMW99, we estimate for each LBG by
| (7) |
where is the SFR per unit area, is the total SFR, is the rotation speed at radius , is the inclination and means a face-on disk. We take to be uniformly distributed from 0 to 1. The rotation curve is assumed to be produced by a dark matter halo with Navarro, Frenk & White (1997) profile; we take the concentration parameter to be 10, the median value found in numerical simulations (e.g. Jing 2000).
The predicted distribution for is shown in Figure 9 for the dust correction of case (b). The solid, dotted and dashed lines are for and 0.03, respectively. We see that the median vulue of decreases with increasing because the predicted halo circular velocities decrease as increases (see Figure 3). As pointed out in Section 3.1, a reasonable range of is between 0.06 and 0.12, which corresponds to a predicted median value for of about .
The stellar velocity dispersions of LBGs may be estimated from the widths of nebular emission lines. A preliminary analysis of about a dozen objects gives velocity dispersions in the range , with a typical value of about (see Pettini 2000). Our prediction is compatible with this observational result. Clearly the observational sample so far is too small to draw a robust conclusion. We also point out that the correspondence between the emission-line widths and the stellar velocity dispersions may not be straightforward (see MMW99 for more discussions). Obviously, a larger sample is needed to firmly test our prediction.
4 Predictions for bright sub-mm Sources
As we have shown in the previous section, haloes hosting LBGs are predicted to have circular velocities in the range with a median value of . As one can see from Figure 7, the expected halo number density by the CDM model in this range is comparable to the required density. However, the CDM model predicts a substantial number of haloes with . A question naturally arises: what are the observational manifestations of these even larger haloes? Since the SFR is expected to be a steeply increasing function of within our theoretical framework, the SFRs in the central parts of these big haloes are expected to be much higher. As mentioned in Section 1, if the bright sub-mm sources observed by SCUBA indeed have redshifts , their SFRs must be , much higher than the typical SFR for the UV-selected LBGs. It is therefore very tempting to make a connection between the bright sub-mm sources and the massive haloes expected in the CDM cosmogonies. Below we explore in detail the consequences of this connection. Throughout this section, we take the mass fraction of cold gas in dark haloes () to be 0.1, which is within the plausible range discussed in Section 3.1.
We identify bright sub-mm sources from Monte Carlo simulations as follows. The halo circular velocities are drawn from the distribution predicted by the Press-Schecther formalism for the CDM model. Each halo is assigned a compactness parameter (defined in equation 5) drawn from a distribution identical to that for the LBG population. The SFR in each halo is derived as described in Section 2. We identify the bright sub-mm sources as systems which have SFRs higher than that of the LBGs with the highest SFRs. Since the brightest UV-selected LBG has () after applying the dust correction suggested by Adelberger & Steidel (2000), we choose the bright sub-mm sources as galaxies with SFR . This selection procedure is obviously an oversimplified approximation. In reality, whether a source can be detected as a bright sub-mm source depends not only on the intrinsic SFR, but also on the dust distribution around the galaxy. For example, a galaxy with high SFR may be more likely to be observed as a bright sub-mm source when it is more compact. Unfortunately, theoretical models of dust emission from star forming galaxies are still very uncertain and it is not yet realistic to adopt a selection criterion based on first principles (see, e.g., Granato et al. 2000). Because of this, our theoretical predictions are really only for galaxies with the highest SFRs. The connection to the bright sub-mm sources can be made only under the assumption that these sources are among the objects with the highest SFRs. With this assumption, many of our predictions (such as the circular-velocity distribution and correlation functions) are quite insensitive to the details of the selection criterion, because they are generic consequences of the high SFRs.

4.1 Circular velocities and sizes of the sub-mm sources

The predicted distribution of halo circular velocities for the bright sub-mm sources is plotted in Figure 10. The range of is from 270 to 410 with a median circular velocity of . Compared with the predictions for the LBGs (Section 3.1), the haloes of the sub-mm sources are predicted to have much higher circular velocities. The predicted distribution of effective (half-light) radius is shown in Figure 11. The median radius, , is about twice as large as the observed median value for the LBG population (see Figure 1).
4.2 Star formation timescale

Because the bright sub-mm sources all have high SFRs, it is interesting to examine their typical star formation timescale. If we define the star formation time in the same way as given by Equation (6), the distribution of for the sub-mm sources looks like that shown in Figure 12. The median value of the distribution is about 10 per cent of the Hubble time at redshift 3, somewhat smaller than that predicted for the LBGs (Section 3.2).
Taking into account this duty cycle, the comoving number density of such objects at is predicted to be about in the CDM model, which is comparable to the observational result of the sub-mm sources with assuming their redshifts (Dunlop 2000). It must be pointed out that the predicted number density is quite sensitive to the SFR threshold adopted in the selection of the sub-mm sources, because the massive haloes are already on the tail of the halo mass function at . However, the prediction that the haloes of bright sub-mm sources are massive is generic because, according to the empirical star formation prescription, the SFR strongly depends on halo circular velocity () but only weakly on the compactness parameter ().
4.3 The correlation functions
Using the model of Mo & White (1996), we can calculate the correlation function for the strong sub-mm sources at . The inferred correlation length is 6.8, about a factor of two larger than that predicted for the LBG population. Thus, bright sub-mm sources, such as the ones observed by SCUBA, should be very strongly clustered in space. The corresponding correlation length for the descendants of these sources at the present time, which can be calculated using the method described in Mo & White (1996), is about . This correlation length is larger than that for present-day field galaxies, but is comparable to that for massive elliptical galaxies. This suggests that the strong sub-mm sources may be the progenitors of massive elliptical galaxies observed in clusters of galaxies today. With the same model we can also estimate the cross-correlation function between the LBG population and the sub-mm sources. We find a correlation length of about for the model in consideration.
It should be emphasized here that although the predicted number density of the sub-mm sources is sensitive to the selection criterion, the predicted correlation lengths are not. This is because while the number density of massive haloes at depends exponentially on the halo circular velocity, the correlation amplitudes have a much weaker dependence on the halo circular velocity. Thus, the predicted correlation lengths are robust predictions which can be used to test the model.
4.4 The stellar velocity dispersions

As for the LBG population, we also calculate the SFR-weighted velocity dispersions for the sub-mm sources. The expected distribution is displayed in Figure 13. The distribution is quite broad with a median of , which is much larger than that predicted for the LBG population. This larger stellar velocity is a direct consequence of the fact that the host haloes for SCUBA sources are predicted to be much more massive. This prediction is also fairly insensitive to the selection criterion.
4.5 The contribution to the 850m background
As we have discussed, bright sub-mm sources have high star formation rate and suffer severe dust obscuration. Most UV and optical radiation is absorbed by dust and re-radiated in the FIR/sub-mm wavelength. It is therefore important for us to estimate the contribution of our model sources to the sub-mm background. According to Scoville & Young (1983) and Thronson & Telesco (1986), the FIR luminosity is related to the SFR by
| (8) |
Using our Monte Carlo sample, we can estimate the total contribution of massive galaxies to the 850m background by integrating the intensities from redshift 2.5 to 3.5 by
| (9) |
where is the monochromatic luminosity at frequency of an individual sub-mm source, is the comoving number density of sub-mm sources as a function of redshift , is the differential comoving volume from to and is the luminosity distance for redshift . We assume the comoving number density for sub-mm sources to be constant within the redshift range . For given SFR, the total FIR luminosity can be estimated using Equation (8). However, to convert it to the monochromatic luminosity (and flux), we need detailed information about the source spectral energy distribution which depends on the uncertain dust temperature. We estimate this by using Equation (7a) in Adelberger & Steidel (2000) which connects the monochromatic luminosity to the dust bolometric luminosity: ; we take and (see Adelberger & Steidel 2000 for details).
Carrying out the procedure outlined above, we find that the inferred contribution of the sub-mm sources to the 850m background is . Similarly, for the LBGs, we find a contribution of . The contribution of LBGs is about the same as that of the sub-mm sources because their larger number density compensates their lower SFRs. Both the contributions of the sub-mm sources and LBGs are about 15 per cent of the observed background, (Fixsen et al. 1998). The total SFR density for sub-mm sources and LBGs are 0.096, and 0.15. These estimates are consistent with previous studies (Blain et al. 1999). We caution, however, that this prediction for sub-mm sources, unlike all the other predictions in this section, depends quite sensitively on how we select sub-mm sources in the Monte Carlo simulations.
5 Summary and Discussion
In this paper we have adopted an empirical approach to investigate the physical properties of LBG population. We have shown that the observed sizes and star formation rates of LBGs, combined with the Kennicutt star-formation relation (Kennicutt 1998), directly constrain the circular velocity of the host haloes and the concentration of the observed galaxies within them. For the adopted CDM model, we find that observations require the circular velocities of LBG host haloes to be in the range , and with a median of . This empirically determined range of circular velocities is different from those found in previous studies, because we find that star formation in LBGs has a relatively short duty cycle; a more detailed comparison is given in in Section 5.1. The star formation in our model haloes is quite efficient; almost all the gas in them can form stars on a time scale , much shorter than the Hubble time at . This means that there must be more haloes that can host LBGs than we actually observed; this has important consequences for the abundance of the descendants of LBGs, a point which we return to in Section 5.2. The predicted comoving correlation length of LBGs is , and the predicted velocity dispersion of their stellar contents is typically . Both these predictions are compatiable with observations (Giavalisco & Dickinson 2000; Pettini et al. 1998a; Pettini 2000).
The same prescription applied to larger haloes predicted in the CDM cosmogony predicts the existence of galaxies with star formation rates at redshift . We identify these galaxies to be the bright sub-mm sources detected by SCUBA. The model predicts that the host haloes of these sub-mm sources are massive, with typical circular velocity and typical stellar velocity dispersion . Both the halo circular velocity and velocity dispersion are about a factor of larger than those for the LBGs. The typical star formation timescale in these systems is about 10 per cent of the Hubble time at redshift 3, and the comoving number density of galaxies (in their duty cycle) is –.
Since the LBGs and the bright sub-mm sources are both highly dust-obscured SFR galaxies, most of their energies are absorbed by dust and re-radiated in sub-mm sources, we estimate that they make comparable contributions (about 35 per cent in total) to the sub-mm background.
5.1 Comparisons with previous studies
In our model, the predicted circular velocities of the host haloes are smaller than those found in most previous analytical and numerical studies (see Section 1 for more complete references). For example, by matching the number density of massive haloes with the number density of LBGs, the haloes selected as LBG hosts have circular velocities (MMW99; Baugh et al. 1998). The difference arises from several factors. First, our approach is more empirically based since we directly use the observed size and SFR distributions. For given , the inferred only depends on two assumptions, i.e., the star formation occurs in an exponential disk and the Kennicutt (1998) SFR relation applies at . The first assumption is consistent with the surface photometry of LBGs (Giavalisco et al. 1996; Lowenthal et al. 1997). The second assumption is plausible, since it is satisfied by local starburst galaxies. In any case, this assumption, in one form or the other, has been adopted in all studies. We therefore believe that our estimate of relies less on theoretical modelling and should be reasonably robust. Second, the dust-correction we favor (Adelberger & Steidel 2000) is about a factor of two or three higher than that used by previous studies; this implies larger intrinsic SFRs for the LBG population. Third, due to the increased intrinsic SFRs, all gas in the host haloes of LBGs is typically consumed within a few tens of the Hubble time at . This means that the duty cycle of the LBG phase must be considered, an effect largely ignored in previous studies. A direct consequence of the duty cycle is that the number densities of haloes that can host LBGs must be larger than that of the observed LBGs (see §5.2). To satisfy this increased number density of host haloes, their circular velocities have to be correspondingly reduced. The reduced leads to a correlation length , which is smaller than that given by previous studies (e.g. Adelberger et al. 1998) but consistent with the recent determination by Giavalisco & Dickinson (2000).
5.2 Descendants of LBGs and sub-mm sources
The observed number density of LBGs down to is (Adelberger et al. 1998). As the star formation time scale is only about fifteen per cent of the Hubble time at in our model (see the middle panel in Figure 6), the haloes of possible LBG hosts must be about a factor of more abundant than the observed LBGs. The descendants of their stellar components would still have number density of about , if merging is not dominant, larger than the number density of local galaxies. It is therefore possible that some of the LBGs have survived mergers to become the progenitors of the stellar bulges in disk galaxies we see today. The sizes and stellar velocity dispersions both match the values for the spheroidal components of disk galaxies such as the Milky Way. Further the (comoving) correlation length predicted for their descendants is also similar to the present-day normal galaxies. Since the star formation time scale of LBGs is with typical SFR of about , the total stellar mass formed is , comparable to the mass of stellar bulges.
Our model predicts that the bright sub-mm sources are hosted by more massive haloes with , and their typical stellar velocity dispersion is . These kinematical properties are very similar to those found in elliptical galaxies, therefore it is natural to make a connection between the bright sub-mm sources and the present-day giant ellipticals (see also Dunlop 2000). The predicted number density of these objects is about (see §4.1). Because the SFRs in these objects are very high (), the star formation proceeds rapidly, and all gas is consumed in only about ten per cent of the Hubble time at . The required duty cycle implies that the number density of the remnants of sub-mm sources, if they survive today, can be as high as . This is within a factor of few of the observed number density of giant ellipticals in the local universe. The total stellar mass formed, , is also comparable to the stellar mass seen in giant ellipticals.
An important question is what triggers the massive star formation in the strong sub-mm sources? In the local universe, the most extreme starbursts are found in dusty ultraluminous infrared galaxies, a local analogue of the sub-mm sources. Nearly all these galaxies occur in merging galaxies (see Sanders & Mirabel 1996 for a review). In Figure 14 we show the merging probability for haloes as a function of the circular velocity at redshift 3 for the CDM model based on the extended Press-Schechter formalism (Bond et al. 1991; Bower 1991; Lacey & Cole 1993). Interestingly, one sees that the maximum merging rate occurs for , nearly identical to the predicted median value of for bright sub-mm sources. This suggests that massive starbursts may be triggered by major mergers, as seen in the local universe. Similar to the local ultraluminous IRAS galaxies, some fraction of the energy in them may be contributed by a central AGN fueled by the accreted gas (Genzel et al. 1998).

To conclude, we have modelled the LBGs and sub-mm sources using an empirical approach. This approach makes a number of robust predictions about the correlation, sizes and kinematical properties of bright sub-mm sources. One interesting consequence of the model is the existence of a population of inactive haloes at . The number density of these dormant haloes is a factor of 6-10 higher than the observed density of LBGs and SCUBA sources. The massive ones are expected to contain large amount of relatively old stars and can already be seen in the -band. It would be very interesting to explore further the observational signatures of these objects.
Acknowledgement
The authors thank Simon White for carefully reading the manuscript and useful suggestions. CS acknowledges the financial support of MPG for a visit to MPA. SM is grateful to MPA for hospitalities during a visit. This project is partly supported by the Chinese National Natural Foundation, the WKC foundation and the NKBRSF G1999075406.
References
- [1]
- [2] Adelberger K.L., Steidel C.C., Giavalisco M., Dickinson M., Pettini M., Kellogg M., 1998 ApJ 505, 18
- [3] Adelberger K.L., Steidel C.C., 2000, ApJ 544, 218
- [4] Arnouts S.,Cristiani S., Moscardini L., Matarrese S., Lucchin F., Fontana A., Giallongo E., 1999, MNRAS 310, 540
- [5] Baugh C.M.,Benson A.J., Frenk C.S., Lacey C.G., 1998, ApJ 498, 504
- [6] Baugh C.M., Cole S., Frenk C.S., Benson A.J., Lacey C.G.1999, ASP 163, Star Formation in Early Type Galaxies, p227
- [7] Blain A.W., Smail I., Ivison R.J. Kneib J.-P., 1999, MNRAS 302, 632
- [8] Bond J. R., Cole S., Efstathiou, G., Kaiser, N., 1991, ApJ, 379, 440
- [9] Bower R. G., 1991, MNRAS, 248, 332
- [10] Burles S., Tytler D., 1998, ApJ 507, 732
- [11] Cohen J.G., Hogg D.W., Blandford R., Cowie L., Hu E., Songalia A., Shopbell P. Richberg K., 2000, ApJ 538, 29
- [12] Cole S. , Lacey C., 1996, MNRAS 281, 716
- [13] Coles P., Lucchin F. , Matarrese S., 1998, MNRAS 300, 183
- [14] Cowie L.L., Barger A.J., in The Hy-redshift Universe, eds. A.J. Bunker, W.J.M. Breugel, ASP, 193, 213
- [15] Dickinson M., 1998, in The Hubble Deep Field, Eds. M. Livio, S.M. Fall, P. Madau (NY: Cambridge University Press), p. 219
- [16] Dunlop J.S., 2000, preprint (astro-ph/0011077)
- [17] Fixsen D.J., Dwek E., Mather J.C., Bennett C.L., Shafer R.A., 1998, ApJ 508, 123
- [18] Genzel R., Lutz D., Sturm E., Egami E., Kunze D., Moorwood A.F.M., Rigopoulou D., Spoon H.W.W., Sternberg A., Tacconi-Garman L.E., Tacconi L., Thatte N., 1998 ApJ 498, 579
- [19] Giavalisco M., Steidel C., Macchetto F.D., 1996, ApJ 470, 189
- [20] Giavalisco M., Dickinson M., 2000, preprint (astro-ph/0012249)
- [21] Granato G.L., Lacey C.G., Silva L., Bressan A., Baugh C.M., Cole, S., Frenk C.S., 2000, ApJ 542, 710
- [22] Haehnelt M., Natarajan P., Rees M., 1998, MNRAS 300, 817
- [23] Holland W.S., Robson E.I., Gear W.K., Cunningham C.R., Lightfoot J.F., Jenness T., Ivison R.J., Stevens J.A., Ade P.A.R., Griffin M.J., Duncan W.D., Murphy J.A., Naylor D.A., 1999, MNRAS 303, 659
- [24] Jing Y.P., 2000, ApJ 535, 30
- [25] Jing Y.P., Suto Y., 1998, ApJ 494, L5
- [26] Katz N., Hernquist L., Weinberg D.H., 1999, ApJ 523, 463
- [27] Kauffmann G., Colberg J.M., Diaferio A. White S.D.M., 1999, MNRAS 303, 188
- [28] Kennicutt R., 1998, ApJ 498, 541
- [29] Kolatt T.S., Bullock J.S., Somerville R.S., Sigad Y., Jonsson P., Kravtsov A.V., Klypin A.A., Primack J.R., Faber S.M., Dekel A., 1999, ApJ 523, L109
- [30] Lacey C., Cole S., 1993, MNRAS, 262, 627
- [31] Lemson G., Kauffmann G., 1999, MNRAS 302, L111
- [32] Lowenthal J.D., Koo D.C., Guzman R., Guzman R., Gallego J., Phillips A.C., Faber S.M., Vogt N.P., Illingworth G.D., Gronwall C., 1997 ApJ 481, 673
- [33] Mao S., Mo H.J., White S.D.M., 1998, MNRAS, 297, L71
- [34] Mo H.J., Fukugita M., 1996, ApJ 467, L9
- [35] Mo H.J., White S.D.M., 1996, MNRAS 282, 347
- [36] Mo H.J., Mao S., White S.D.M., 1998, MNRAS 295, 319
- [37] Mo H.J., Mao S., White S.D.M., 1999, MNRAS 304, 175 (MMW99)
- [38] Moscardini L., Coles P., Lucchin F., Matarrese S., 1998, MNRAS 299, 95
- [39] Navarro J.F., Frenk C.S., White S.D.M., 1997, ApJ 490, 49
- [40] Peacock J.A., Jimenez R., Dunlop J.S., Waddington I., Spinrad H., Stern D., Dey A., Windhorst R.A., 1998, MNRAS, 296, 1089
- [41] Peacock J.A., Rowan-Robinson M., Blain A.W., Dunlop J.S., Efstathiou A., Hughes D.H., Jenness T., Ivison R.J., Lawrence A., Longair M.S., Mann R.G., Oliver S.J., Serjeant S., 2000, MNRAS 318, 535
- [42] Pettini M. Steidel C., Dickinson M.E., et al. 1998a, in The Ultraviolet Universe at Low and High Redshift: Probing the Progress of Galaxy Evolution, Eds. H. Waller et al. (New York: AIP), 408, p. 279
- [43] Pettini M., Kellogg M., Steidel C.C., Dickinson M., Adelberger K.L., Giavalisco M., 1998b, ApJ 508, 539
- [44] Pettini M., 2000, RSLPT, 358, 2035 (astro-ph/0001075)
- [45] Press W.H. Schechter P.L. 1974, ApJ 187, 425 (PS)
- [46] Sanders D.B., Mirabel I.F., 1996, ARA&A 34, 749
- [47] Scoville N.Z., Young J.S., 1983, ApJ 265, 148
- [48] Shu C., 2000, A&A 354, 815
- [49] Somerville R.S., Primack J.R., Faber S.M., 2000 preprint (astro-ph/0006364)
- [50] Steidel C.C., Pettini M., Hamilton D., 1995, AJ 110, 2519
- [51] Steidel C.C., Adelberger K.L., Dickinson M., Giavalisco M., Pettini M., Kellogg M., 1998, ApJ 492, 428
- [52] Steidel C.C., Adelberger K.L., Giavalisco M., Dickinson M., Pettini M., 1999a, ApJ 519, 1
- [53] Steidel C., Adelberger K.L., Dickinson M., Giavalisco M., Pettini M., 1999b, preprint (astro-ph/9812167)
- [54] Thronson H., Telesco C., 1986, ApJ 311, 98
- [55] Warren M.S., Quinn P.J., Salmon J.K., Zurek W.H., 1992, ApJ 399, 405
- [56] Wechsler R.H., Gross M.A.K., Primack J.R., Blumenthal G.R., Dekel A., 1998, ApJ 509, 19
- [57] Wechsler R.H., Somerville R.S., Bullock J.S., Kolatt T.S., Primack J.R., Blumenthal G.R., Dekel A., 2000, preprint (astro-ph/0011261)