Kinematics of Molecular Gas in the Nucleus of NGC 1068, from H2 line emission observed with VLT ††thanks: Based on observations collected at the ESO/Paranal ANTU telescope, Proposal 63.P-0167A.
Abstract
We present results about the distribution and kinematics of the molecular environment of the AGN in NGC 1068, over a region around the central engine in NGC 1068, derived from H2 line emission detected with ISAAC at VLT/ANTU on ESO/Paranal. The H2 emitting molecular gas is found to be distributed along the East-West direction and with two main peak emission (knots) located at a distance of about 70 pc from the central engine. The eastern H2 knot is more intense than the western one. The line profiles mapped across the entire region, at a spatial resolution of , appear to be quite complex with either a blue or red wing. At first order, we find a velocity difference of 140 km/s between the two knots; if interpreted as quasi-keplerian velocity, this implies a central enclosed mass of .
Key Words.:
Galaxies : NGC 1068 – Galaxies : Seyfert – Galaxies : nuclei – Galaxies : molecular gas – Galaxies : active – Infrared : galaxies – Instrumentation: mid-IR1 Introduction
Given the proximity of NGC 1068 (14.4 Mpc and corresponding scale of 70 pc per ) and the predicted size of the molecular torus in an Active Galactic Nucleus (AGN) –from 1 to 100 pc–, any trace or signature of a molecular torus in NGC 1068 must be searched from data collected under sub-arcsec image quality. Several recent discoveries point towards the presence of a conspicuous and structured molecular/dusty environment around the central engine of NGC1068 (e.g. Gallimore et al 1997, Rouan et al 1998, Marco & Alloin 2000, Schinnerer et al 2000, and references given in these papers). One piece of information still missing to ascertain the existence of a rotating torus –in addition to other possible molecular components–, is the kinematical status of the molecular/dusty material. Such information is available for the cold molecular gas, from recent interferometric work in the CO(2–1) line (Schinnerer et al 2000): the authors infer the presence of a warped disc of cold molecular gas. In this study we have chosen to probe the molecular gas through the H2 1-0 S(1) line (rest ). Being related to the hot molecular gas and having specific excitation mechanisms, it provides complementary information to that derived from the CO transition which traces the cold molecular gas. After the pioneering discovery of the H2 2.12 line emission in NGC 1068 by Thompson et al (1978), a first attempt to image the AGN of NGC 1068 in the H2 2.12 line has been reported by Rotaciuc et al (1991), covering a region at a resolution of . It is imperative to push further the spatial resolution.
Adaptive optics high resolution K, L and M band images of the AGN have unveiled the presence and structure of hot to warm dust (Rouan et al 1998, Marco & Alloin 2000) within the region around the central engine. We have selected from these observations two particular directions for our kinematical study: (a) PA 102° possibly tracing the equatorial plane of the molecular/dusty torus around the central engine; (b) PA 12° which features the axis of the torus and is found to be close to the axis of the ionizing cone to the North-East. The location of the central engine – only visible directly in the IR as an unresolved core carrying around 90% of the emission and in the radio as the radio source S1 in Muxlow et al (1996) – is taken here as that derived by Marco et al (1997) from simultaneous K and I band high resolution imaging with adaptive optics. Given the error bar on this position () , it is coincident with the astrometric position of the 12.4 m unresolved core (Braatz et al 1993), the K band peak observed by Thatte et al (1997) and the center of symmetry of the polarization pattern in the near-IR and mid-IR (Lumsden et al 1999). We leave aside attempts at locating the central engine from UV data which are quite sensitive to dust extinction and provide so far discrepant results (Capetti et al 1995a & b, Kishimoto 1999).
We present and discuss results of long-slit spectroscopy in the near-IR, obtained with ISAAC at VLT/ANTU on ESO/Paranal. In this Letter, we concentrate on the H2 2.12 line emission observed over a region through the central engine at PA 102°. The kinematics of the hot molecular gas in particular is investigated to test the presence of an eventual super massive object in NGC 1068.
2 Data collection and Reduction
The observations were performed using the SWS1 short wavelength arm of
the instrument ISAAC attached to the Nasmyth focus of ANTU (Moorwood et al
1999,
Cuby et al 2000). The measured seeing value was of (FWHM) in the
K band.
The slit width was set to while its length
was of at PA 102°. A spectrum was first obtained with
the slit centered on the near-IR unresolved core, imaged prior to the
spectroscopic observations. Then the position of the slit was offset by
and on each side of the core, to the North
and to the South, providing a complete mapping of a area.
A complete description of the data collection and reduction procedures is
given in Galliano & Alloin (2001). The final spectral resolution at the
observed
2.15 wavelength of the H2 line is 35 km/s.
From the reduced 2D spectra, we extracted a series of 1D spectra, through a
window
3 pixels-high (i.e.
) along the slit, and with a sliding step of 1 pixel
(). In the very central area, the intense continuum produces a
fringing pattern at
the level of 4% (peak to peak)
that cannot be fully corrected, leaving some residuals which prevent the
measurement of eventual faint H2 line emission at a distance less than
15 pc from the central engine.
3 Results and Discussion
3.1 H2 line profiles
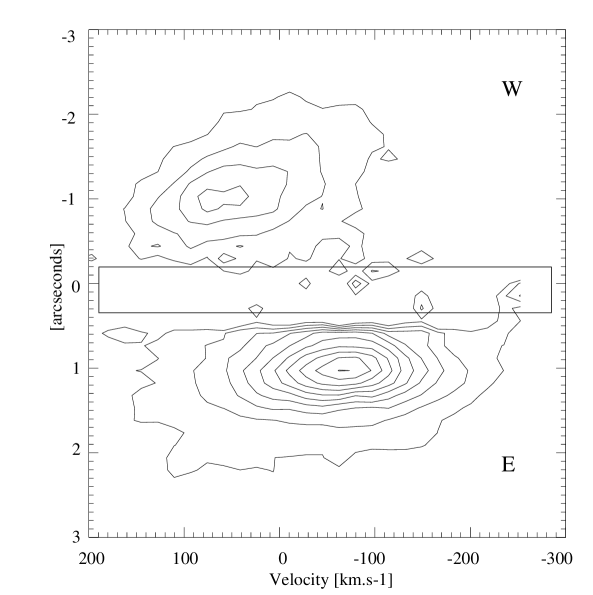
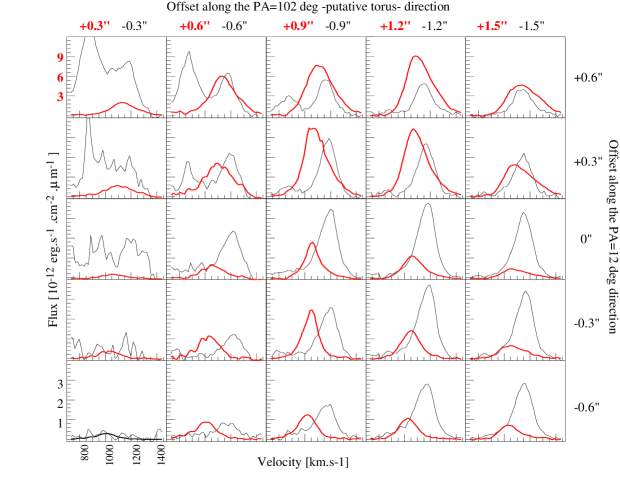
We provide in Figure 2, a set of the H2 line profiles observed at various positions across the central area extended along the equatorial plane of the suspected torus (PA 102°). At each position, the displayed line profile corresponds to an emitting patch. We did not deconvolve the individual successive spectra: given the seeing ( in the K band), each spectrum is only moderately contaminated by its neighbours. The H2 line profiles are presented in the following manner: for each frame, offset coordinates of the patch to which the line-profile refers are given with respect to the central engine location. The horizontal axis provides the offsets along PA 102° and the vertical axis the offsets along PA 12°. In each frame, the black (thin) line features the line profile observed to the West of the AGN (from to ), while the red (thick) line features the line profile observed to the East (from to ). Therefore, each frame provides the line profile of a given patch and the line profile of its symmetrical counter part with respect to the axis of the suspected torus. Because of a large difference between the line fluxes to the East and West of the central engine, we have rescaled by a factor 3, in Figure 2, the line profiles detected to the West. In most of the frames, the line shows a complex profile: from double peak (North) to the presence of an extended wing ( blue wing to the West and red wing to the East). The velocity difference between the main peaks in two symmetrical patches is maximum for patches [;] and [;] and reaches a value of .
3.2 Spatial distribution of the H2 line emission
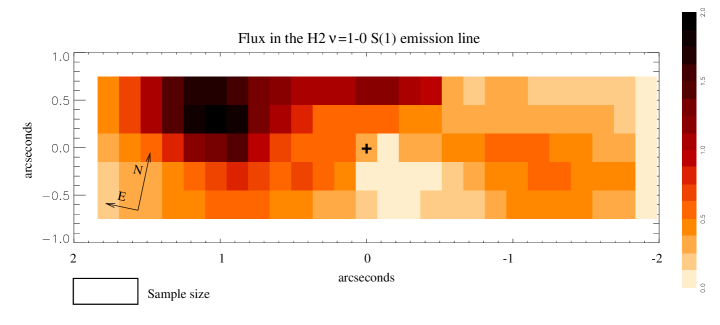
For each emitting patch we have measured the total integrated H2 line emission and, from these values, we have reconstructed the 2D map in H2 line emission shown in Figure 3. The existence of two symmetrical emission knots (eastern and western knots) with large flux difference is conspicuous. This map can be compared to the early image in the H2 line provided by Rotaciuc et al (1991, their figure 2), within the limitation of different spatial resolutions and spatial coverage. Indeed, the ISAAC reconstructed H2 map is consistent with the inner part of the image by Rotaciuc, although the more limited area covered by the ISAAC data set may miss the maximum of the western knot (which is also slightly shifted to the South). A detailed flux comparison between H2 data sets obtained previously (references in Section 1) and the ISAAC data set is presented in Galliano & Alloin (2001). We concentrate here on the positional/kinematical aspects measured for the first time from this ISAAC H2 data. The strong eastern H2 knot, located about to the East of the central engine, is also well identified in velocity space (Figure 1). In addition to the eastern and western knots, extended and asymmetric wings on the line profiles suggest the presence of an extended source of H2 emission, possibly in the form of an outflow (Galliano & Alloin 2001). We have also reconstructed a 2D map of the average continuum between and (not shown here) from which we have positioned the cross featuring the central engine in Figure 2.
3.3 Kinematics of the H2 molecular material
As a first order result, a jump in radial velocity of about is detected between the eastern and western knots at 70 pc from the central engine. The [Position– Velocity] diagram (Figure 1) enlights this result. If the material associated with these knots pertains to a structured ensemble of molecular clouds in keplerian orbit, this implies the presence of an enclosed object with dynamical mass . A comparable value is found by Schinnerer et al (2000) from CO line emission observed on a scale of . Yet, the enclosed central mass derived from H2O maser observations on a scale of less than 1 pc, is only (Greenhill & Gwinn 1997). It should be noticed as well that the rotation axis of the molecular and maser “pseudo” discs differ by at least 30°. This result suggests that the mass enclosed within the 70 pc radius region around the central engine in NGC 1068 is shared among different components.
At second order, across the western knot itself, an increase of the H2 line velocity is observed towards the center, as expected in the case of pseudo-keplerian rotation of the system, but a similar behaviour does not appear in an obvious way in the eastern knot where the brightest peak seems to remain at constant blueshift when approaching the center. Considering the large flux difference between both sides, we cannot exclude a superposition of components along the line of sight to the East of the central engine, or the existence of peculiar kinematics as discussed from CO line data by Schinnerer et al (2000). A more refined analysis of the velocity field of the H2 emitting molecular material is in progress, aiming in particular at fitting the line profiles across the entire region.
3.4 Comparison with CO high resolution map and Discussion
The integrated H2 line map derived from ISAAC data can be compared with the map recently obtained at IRAM with an beam by Schinnerer et al (2000). The strong H2 line emission of the eastern knot is detected as well in CO, at the same location. On the western side, the ISAAC spatial coverage does not allow to check whether the CO peak – located to the West and to the South – is also emitting in the H2 line. However, we do detect in H2 the tip of the western CO knot. The spatial coincidence of CO and H2 emission in the eastern and western knots is interesting and indicative that, in these knots, H2 is emitted in photo (or/and X-ray) dissociation regions (PDR or XDR) at the surface of molecular clouds. Given the AGN environment, rich in UV photons, X-rays and shocks, it is still unclear what would be the main source of excitation of the H2 line. For the time-being, let us simply assume that the H2 line emission originates from molecular gas at temperature around 2000 K (e.g. Hawarden et al 1995): we find that the total observed H2 line emission in the central area is of , corresponding to a total luminosity of . Following Thompson (1978), an amount of of hot molecular gas is needed to produce this emission. Conversely, CO line emission is thought to arise from cold molecular gas with temperature at least one order of magnitude less (e.g. Barvainis et al, 1997). The total mass of molecular hydrogen derived from the CO line flux by Schinnerer & al (2000), over the same region, is of the order of , 4 orders of magnitude larger than the hot emitting H2 molecular gas. Such a result is not surprising and is consistent with the PDRs or XDRs origin of H2. Still to be understood is the more diffuse H2 emission which is traced in the wings in the H2 line profiles (Figure 1) and we are developping a kinematical model for this extended component (Galliano & Alloin 2001).
Another interesting point to resolve is whether the dynamical mass enclosed within a 70 pc radius region around the central engine (as derived both from cold and hot molecular gas kinematics independently) corresponds to a super massive confined object or a mass-distributed component (stellar cluster and molecular/dust gas). As there is most probably a contribution from each of these components, their respective share is an issue we intend to address in the near future (Galliano & Alloin 2001).
Acknowledgements.
We are gratefully indebted to the ESO Service Observing team on Paranal and to the User Support Group and Archive Support Group at ESO/Garching for efficient help. We acknowledge precious advice from C. Lidman for the ISAAC spectra reduction and interesting comments from an anonymous referee.References
- (1) Barvainis R., Maloney P., Antonucci R., Alloin D., 1997, ApJ 484, 695
- (2) Braatz J.A., Wilson A.S., Gezari D.Y. et al, 1993, ApJ 409, L5
- (3) Capetti A., Axon D., Maccheto F.D. et al, 1995a, ApJ 446, 155
- (4) Capetti A., Maccheto F.D., Axon D. et al, 1995b, ApJ 452, L87
- (5) Cuby JG., Lidman C., Moutou C., Petr M., 2000, SPIE 4008, 1036
- (6) Galliano E. & Alloin D., 2001, in preparation
- (7) Gallimore J.F., Baum, S.A., O’Dea C.P., 1997, Nature 388, 852
- (8) Greenhill L.J., Gwinn C.R., 1997, Ap&SS, 248, 261
- (9) Hawarden T., Israel F., Geballe T., Wade R, 1995, MNRAS 276, 1197
- (10) Kishimoto M., 1999, ApJ 518, 676
- (11) Lumsden S., Moore T., Smith C. et al, 1999, MNRAS 303, 209
- (12) Marco O., Alloin D., Beuzit J.L., 1997, A&A 320, 399
- (13) Marco O., Alloin D., 2000, A&A 353, 465
- (14) Moorwood A., Cuby, J.-G., Ballester P. et al, 1999, The Messenger, 95, 1-5
- (15) Muxlow T.W., Pedlar A., Holloway A. et al, 1996, MNRAS 278, 854
- (16) Rotaciuc V., Krabbe A., Cameron M. et al, 1991, ApJ, 370, L23-L26
- (17) Rouan D., Rigaut F., Alloin D. et al, 1998, A&A 339, 687
- (18) Schinnerer E., Eckart A., Tacconi L.J., Genzel R., Downes D., 2000,ApJ 533, 850
- (19) Thatte N., Quirrenbach A., Genzel R. et al, 1997,ApJ 490, 238
- (20) Thompson R.I., Lebofsky M.J., Rieke G.H., 1978, ApJ 222, L49-L53