Implications of the BOOMERANG and MAXIMA-I results for the Baryon Mass Fraction in Clusters of galaxies
Abstract
Recent BOOMERANG and MAXIMA-I analyses of the angular power spectrum of the Cosmic Microwave Background put more stringent constraints on the cosmological parameters. I show that these constraints are consistent with the observed baryon budget in clusters of galaxies, allowing any further contribution to this budget from baryons not in stars and not X-ray emitting to be less than 14 per cent at the 90 per cent level of confidence.
keywords:
galaxies: cluster: general – galaxies: fundamental parameters – intergalactic medium – X-ray: galaxies – cosmology: observations – dark matter.May 00
1 INTRODUCTION
The calculations on the primordial nucleosynthesis abundance of the light elements (e.g. D, 3He, 4He, 7Li) give a direct measurement of the value of the baryon density, , relative to the critical density necessary to close the Universe. If the regions that collapse to form rich clusters maintain the same ratio as the rest of the Universe, a measure of the cluster baryon fraction can be then used with the estimate of to constrain the “cold”, clustered component, , of the total density parameter, .
The clusters baryon budget is composed mainly from the luminous baryons of the X-ray emitting gas that falls into the cluster dark matter halo. Other contributions come from the baryonic mass in galaxies, , from intergalactic stars (Theuns & Warren 1997) and a still hypothetical baryonic dark matter (like MACHOs, Alcock et al. 2000; but see Freese, Fields & Graff 2000). Given the large uncertainties on the relative contribution of the latter two sources to the baryon budget, I qualify these as “other baryons”, . Therefore, one can put the following relation between the relative amount of baryons in the Universe and in clusters with total gravitating mass, , as inferred from the equation of the hydrostatic equilibrium between the gas and the gravitational potential that does not include the self-gravity of the hot plasma (e.g. Suto, Sasaki & Makino 1998):
| (1) |
where , , . (Note that any dependence upon the Hubble constant is discussed in the next section). In the following section, I discuss this equality in more details, considering the corrections required to compare the cluster baryon fraction to the universal value.
When new tighter and lower constraints from nucleosynthesis were published by Walker et al. (1991; but see discussions in recent years on the abundance of the light elements, e.g. Hogan 1998), it became evident that just the amount of baryons visible in X-ray was enough to put in crisis an Einstein-de Sitter Universe with , giving rise to the so-called baryon catastrophe in clusters of galaxies (White & Frenk 1991, White et al. 1993, White & Fabian 1995, David, Jones & Forman 1995, Evrard 1997, Ettori & Fabian 1999, Mohr et al. 1999; cf. Fig. 1).
Now that independent and well-constrained measurements of the cosmological parameters from estimates of the angular power spectrum of the Cosmic Microwave Background (CMB) are available, one can reverse the problem and, using the estimated values for and and the observed gas mass fraction, investigate the composition of the cluster baryon budget.
In particular, one can estimate the ratio
| (2) |
that is expected to be close, but less than, the unity from eqn. 1.
To do this, I use the estimates on the gas mass fraction published in Evrard 1997 (E97, as compilation of the measurements in White & Fabian 1995 and David, Jones, Forman 1995), Ettori & Fabian 1999 (EF99, for a sample of highly X-ray luminous clusters, erg s-1), Mohr et al. 1999 (MME99, for an X-ray flux limited sample). I use the measurements quoted at , where the mean density in the cluster is 500 times the background value. The overdensity of 500 represents a confident outer limit where our assumptions on the intracluster gas as isothermal and in hydrostatic equilibrium still hold.
Moreover, one can also include the stellar contribution to the baryon clusters budget. This is (White et al. 1993, Fukugita et al. 1998).
Hereafter, I refer to as the total matter density in unity of the critical density, , where is the Hubble constant that we represent as km s-1 Mpc-1. Hence, the total energy in the Universe in units of the critical value can be written as
| (3) |
where is the constant energy density associated with the “vacuum” (e.g. Carroll et al. 1992) and is the energy density related to the curvature111Contribution from neutrinos is not considered because their role, i.e. their mass, is still uncertain. For a flat Universe, and .
2 The Cosmological Constraints from BOOMERANG and MAXIMA-I
BOOMERANG (de Bernardis et al. 2000, Lange et al. 2000) and MAXIMA-I (Hanany et al. 2000, Balbi et al. 2000) are two baloon experiments that looking to the CMB on scales of few tens of arcminutes have permitted to constrain the cosmological models with a fit to the angular power spectrum of the temperature anisotropy in the detected signal. Jaffe et al. (2001) have combined these limits with the ones obtained from COBE/DMR (Bennett et al. 1996) on scales of few degrees.
I consider here the best-fit results on and quoted in Table 1 of Lange et al. (2001) and the values for an assumed of km s-1 Mpc-1 in Jaffe et al. (2001).
The ratio represents the relative amount of baryons with respect to the cold dark matter as measured in clusters of galaxies from the ratio of the baryonic mass to the total mass in hydrostatic equilibrium with the gas itself at a given radius. Using the gas fraction estimates in E97, EF99, MME99, I compute the ratio that is expected to be .

Before to proceed to the measure of , we have to correct the estimates of the observed , that are generally expressed in terms of and , for changes in the cosmological models and known systematic errors. These corrections are listed below and their contribution indicated as relative error, .
The gas mass fraction, is given by the ratio of the gas mass and of the total gravitating mass within some radius, in the present study:
| (4) |
where I assume that the plasma is isothermal and in hydrostatic equilibrium with the gravitational potential, is the physical radius and depends upon the angular separation, , and the angular diameter distance, , is the cluster gas temperature, is the mean molecular weight in a.m.u. (), is the gravitational constant and is the proton mass.
Equation 4 depends on cosmology to define (i) the physical radius, , and (ii) the overdensity here assumed equal to 500 for an “” Universe.
The first cosmological correction, , is evaluated as follows. Given that the surface brightness, , is the integration along the line of sight of the emissivity of the intracluster plasma due to thermal bremsstrahlung [i.e., ], the gas density is proportional to . Combining this with the other dependence in eqn. 4,
| (5) |
I compute the angular diameter distance as a function of the cosmological parameters (cf. eqn. 25 in Carroll, Press & Turner 1992):
| (6) |
where is sinh, , for greater than, equal to and less than 0, respectively, and
| (7) |
For , eqn. 6 can be written as
| (8) |
The correction, , introduced by a low matter density Universe and a Hubble constant lower the gas fraction by about 40 per cent () mainly due to the dependence upon the Hubble constant (). As shown in Fig. 2, a low density Universe rises the gas fraction measurement for nearby clusters by about 10 per cent.


The second cosmological correction, , appears as variation of the radius, , at which the given mean overdensity of the total mass within the cluster, , with respect to the background value, , is reached in different cosmological scenarios. To estimate in function of the cosmological parameters, I use the relation valid for a “” Universe (e.g. Kitayama & Suto 1996, Henry 2000; see Fig. 2):
| (9) |
where .
The measurement of requires an observed mass profile , so that . Considering that in the region of interest,
| (10) |
where 500 is the mean overdensity adopted in the samples of data considered here for an “” Universe. Observations (David et al. 1995, EF99) and hydrodynamical simulations (see E97) agree on the radial dependence of the gas fraction near , . Thus, the gas fraction has to be corrected by
| (11) |
This correction increases the gas fraction value by about 6 per cent or less ().
A third correction, , is required from the evidence in both simulations and observations of baryon depletion in galaxy clusters. The combined N-body and gas dynamics simulations suggest that the amount of the cosmic baryons that falls in clusters as gas component at is slightly lower than 1 (, Frenk et al. 1999; 0.88 in MME99), in agreement with the observed increase of the gas fraction with radius as near to (EF99, David et al. 1995). This implies that the estimated gas fraction (and the derived value ) might be underestimated by about 12 per cent ().
A fourth correction, , comes still from hydrodynamical simulations of galaxy clusters that indicate an overestimate of the gas mass due to the neglected clumping of the plasma. Considering that the observed thermal emission scales proportionally to , the presence of X-ray emitting clumps induce an overestimate on the gas fraction by about 12 per cent respect to the “true” value in simulated clusters, as shown by MME99 ().
Other systematic errors present in the measurements of the gas fraction and whose magnitude is still uncertain are discussed in Section 2.2.
Our analysis now requires an estimate of the “true” gas mass fraction given the four corrections listed above:
| (12) |
Note that just the two ones related to the cosmological models assumed play a relevant role, because the third and fourth ones cancel (i.e. ).
I calculate a weighted mean value of the distribution in the gas fraction measurements (after the cosmological corrections are applied and including the quoted errors) for each dataset independently:
| (13) |
I plot the results for in Fig. 3.
I observe that (i) for all the sets of cosmological values discussed in Table 1 of Lange and collaborators (see Fig. 3), providing evidence that there is now agreement between the favorite cosmological scenario and the observed amount of baryons in galaxy clusters, (ii) none of these cosmological sets can be excluded on the basis of the cluster baryon budget due to the large (a relative error of 40 per cent at level) uncertainty still presents in the estimate of .


2.1 Cluster baryon budget: gas, galaxies and … then?
From the estimate of , and including the contribution from stars in galaxies, we are left with plausible constraints on any additional baryonic components, like baryons in form of dark matter or intergalactic stars:
| (14) |
From the best-fit results in Jaffe et al. (2001), I obtain that (error at level):
| (15) |
Therefore, no more than 14 per cent (90 per cent confidence level ; 23 per cent at 99.7 per cent level of confidence) of the total matter in clusters of galaxies can be baryons not accounted for in X-ray emitting plasma and stars in galaxies.
2.2 Systematic uncertainties on
The assumption of an isothermal gas in hydrostatic equilibrium with the gravitational potential provides an useful framework to work out the contribution of the X-ray emitting plasma to the cluster baryon budget. However, several aspects of the physics of the intracluster medium are still under investigations and can introduce some systematics errors on the measure of the gas mass fraction. I list here the most significant of these, considering their effect on the estimates of the values of and .
-
•
While the gas mass is well constrained from present X-ray observations, the total mass profile still represents a significant uncertainty in the the baryon fraction estimates. Particularly, the shape of cluster temperature profiles is still defined with contradictory results (Markevitch 1998, Irwin et al. 1999, White 2000). I have assumed here an isothermal gas. Now, I investigate the variation of once a polytropic profile for the intracluster gas () is considered. I model the changes in the total gravitating mass using a model (Cavaliere & Fusco-Femiano 1976, Ettori 2000) with parameters Mpc, and a polytropic index, , equal to 1.24 (Markevitch 1998).
-
•
The presence of a magnetic field in the cluster plasma, like the recent reported measurements of Faraday Rotation (Clarke et al. 1999, Taylor et al. 1999) and excess in emission in the Hard X-ray band (Fusco-Femiano et al. 1999) seem suggest, might support a non-thermal component that (i) contributes to the total pressure and (ii) mimics the thermal emission by a contribution of about 10-25 per cent (Fusco-Femiano et al. 1999) that has to be accounted for once the cluster luminosity is recovered from the X-ray count rate. Assuming a proportional dependence between the non-thermal pressure, , and the gas pressure, , such as , the total pressure is then and affects the total gravitating mass through the hydrostatic equation. I also include the correction by a factor of the gas density due to the non-thermal contribution to the total observed emissivity that can be reduced .
Referring to the corrected quantities as NEW with respect to the previous, OLD ones, I can write:
| (16) |
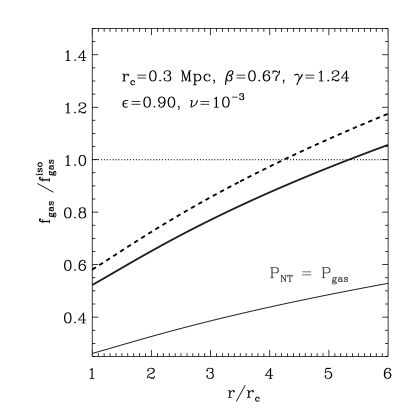
I plot in Fig. 4 how the gas fraction estimated under the isothermal assumption changes for the corrections discussed here. I note that the presence of a temperature gradient reduces the total mass and, therefore, increases the gas fraction value, whereas a non-thermal spectral component lowers the observed thermal contribution and, consequently, the estimate of the gas fraction at .
Then, a negative gradient in the plasma temperature profile can reduce up to the 40 per cent the room available for any further baryonic contribution, only partially compensated (if below the limit of the equipartition with thermal plasma) by the presence of a non-thermal component.
3 Conclusions
Comparing the recent cosmological constraints from measurements of the angular power spectrum of the temperature anisotropy in the CMB with the observed distribution of the gas mass fraction in clusters of galaxies, I conclude that
-
1.
the ratio is close to 1 (Fig. 3) for all the sets of cosmological values discussed in Jaffe et al. (2001) and Lange et al. (2001). Although I can not ruled out any of these models just from cluster baryon budget due to the large relative error that affects , on the other hand it shows that the most favorite cosmological scenario is consistent with the observed baryon budget in clusters of galaxies;
-
2.
there is evidence that only 14 per cent (90 per cent confidence level; 23 per cent at level of confidence) of the total mass can be present in galaxy clusters in the form of baryons neither in stars nor X-ray emitting. It is worth to note that using the calculations in Freese et al. (2000) and B-band luminosity and X-ray mass of the Coma Cluster in White et al. (1993), I estimate a contribution of MACHOs to the cluster mass, , of about 2 per cent, that is within the above constraint.
-
3.
the upper limit of 14 per cent is in the order of the observed scatter in the gas mass distribution of about 15–20 per cent (cf. Fig. 1), suggesting that part of this scatter might be due to still unobserved baryons. It is worth to note, however, that the present accuracy of the gas mass measurements is in the order of 10 per cent (cf. simulations in MME99) and probably larger uncertainty is still related to the gravitating mass estimates (see next item). The combination of these uncertainties could explain the observed scatter in the gas mass fraction distribution. Data from Chandra and XMM-Newton X-ray observatories are in condition to reduce significantly the size of these uncertainties;
-
4.
systematic errors on the gas mass fraction measurement, like the presence of a temperature gradient in the plasma or a non-thermal component in the cluster emission, tends to reduce by a value between 25 and 40 per cent the estimate of the fraction of the gravitating mass as “unseen” baryons.
ACKNOWLEDGEMENTS
I am grateful to the anonymous referee for comments which improved the presentation of this work. I acknowledge the support of the Royal Society.
References
- [] Alcock C. et al., 2000, ApJ 542, 281
- [] Balbi A. et al., 2000, ApJL 545, L1
- [] Bennett C. et al., 1996, ApJ 464, L1
- [] de Bernardis P. et al., 2000, Nature 404, 955
- [] Burles S., Tytler D., 1998, Space Science Reviews 84 (1/2), 65
- [] Carroll S.M., Press W.H., Turner E.L., 1992, ARAA 30, 499
- [] Cavaliere A., Fusco-Femiano R., 1976, A&A 49, 137
- [] Clarke T.E., Kronberg P.P., Böringer H., 1999, proc. of “Diffuse Thermal and Relativistic Plasma in Galaxy Clusters”, Ringberg Workshop, MPE Report 271, p. 82
- [] David L.P., Jones C., Forman W., 1995, ApJ 445, 578
- [] Ettori S., Fabian A.C., 1999, MNRAS 305, 834 (EF99)
- [] Ettori S., 2000, MNRAS 311, 313
- [] Evrard A.E., 1997, MNRAS 292, 289 (E97)
- [] Freese K., Fields B., Graff D., 2000, contribution to “Sources and Detection of Dark Matter in the Universe”, Marina del Rey, CA, February 2000 (astro-ph/0007444)
- [] Frenk C. et al., 1999, ApJ 525, 554
- [] Fukugita M., Hogan C.J., Peebles P.J.E., 1998, ApJ 503, 518
- [] Fusco-Femiano R., dal Fiume D., Feretti L., Giovannini G., Grandi P., Matt G., Molendi S., Santangelo A., 1999, ApJ, 513, L21
- [] Hanany S. et al., 2000, ApJL 545, L5
- [] Henry J.P., 2000, ApJ 534, 565
- [] Hogan C.J., 1998, Space Science Reviews 84 (1/2), 127
- [] Jaffe A.H. et al., 2001, Phys. Rev. Lett., submitted (astro-ph/0007333)
- [] Kitayama T., Suto Y., 1996, ApJ 469, 480
- [] Lange A.E. et al., 2001, Phys. Rev. D, 63, 42001
- [] Irwin J.A., Bregman J.N. & Evrard A.E., 1999, ApJ 519, 518
- [] Markevitch M., Forman W.R., Sarazin C.L., Vikhlinin A., 1998, ApJ 503, 77
- [] Mohr J.J., Mathiesen B., Evrard A.E., 1999, ApJ 517, 627 (MME99)
- [] Suto Y., Sasaki S., Makino N., 1998, ApJ 509, 544
- [] Taylor G.B., Allen S.W., Fabian A.C., 1999, proc. of “Diffuse Thermal and Relativistic Plasma in Galaxy Clusters”, Ringberg Workshop, MPE Report 271, p. 77
- [] Theuns T., Warren S.J., 1997, MNRAS 284, L11
- [] Walker T.P., Steigman G., Schramm D.N., Olive K.A., Kang H.S., 1991, ApJ 376, 51
- [] White D.A., Fabian A.C., 1995, MNRAS 273, 72
- [] White D.A., 2000, MNRAS, 312, 663
- [] White S.D.M., Frenk C.S., 1991, ApJ 379, 52
- [] White S.D.M., Navarro J.F., Evrard A.E., Frenk C.S., 1993, Nature 366, 429